
PUBLISHER: Roots Analysis | PRODUCT CODE: 2037820

PUBLISHER: Roots Analysis | PRODUCT CODE: 2037820
Cyber Physical Systems Market, Till 2035: Distribution by Type of Cyber Physical System, Type of Component, Type of Security, End Users, and Geographical Regions: Industry Trends and Global Forecasts
Cyber Physical Systems Market Outlook
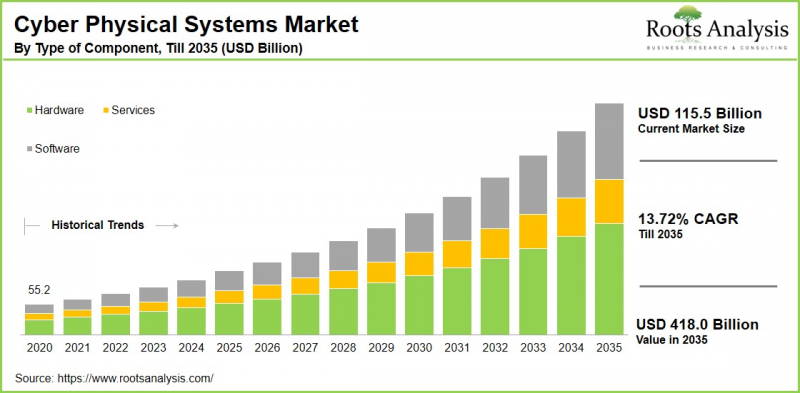
As per Roots Analysis, the global cyber physical systems market size is estimated to grow from USD 115.5 billion in current year to USD 418 billion by 2035, at a CAGR of 13.72% during the forecast period, till 2035.
Cyber-physical systems (CPS) refer to integrated frameworks that combine physical components (such as machines and sensors) with advanced computational algorithms and networked software to monitor, control, and optimize real-world processes in a coordinated manner. These systems play a crucial role in modern industrial environments by enabling efficient resource management, real-time data analysis, and high-quality production. Through the seamless integration of physical processes with computer-based monitoring and network analytics, CPS has significantly contributed to advancements across sectors, particularly in healthcare and manufacturing.
The adoption and demand for CPS are expanding rapidly, driven by the growth of smart factories and the implementation of Industry 4.0 initiatives, especially in emerging economies. Their relatively straightforward implementation and well-designed technological architecture make CPS an attractive solution for industries seeking digital transformation. Additionally, advancements in energy-efficient CPS technologies enable effective power management, supporting the development of smart grid applications in manufacturing. The increasing use of predictive maintenance solutions and machine learning techniques further strengthens CPS adoption, extending its applications across diverse sectors, including healthcare and agriculture.
Strategic Insights for Senior Leaders
Key Drivers Propelling Growth of Cyber Physical Systems Market
The growth of the cyber-physical systems (CPS) market is primarily driven by the increasing demand for intelligent transportation systems, which rely on real-time data integration and automated control for enhanced efficiency and safety. Additionally, the rising adoption of smart vehicles and smart home technologies has accelerated CPS deployment by expanding its application across interconnected and data-driven environments. Furthermore, CPS is widely used for its ability to optimize resource management and implement cost-reduction strategies while maintaining high production quality. Collectively, these factors are significantly contributing to the expansion and sustained momentum of the CPS market.
Cyber Physical Systems Market: Competitive Landscape of Companies in this Industry
The competitive landscape of the cyber-physical systems industry is characterized by intense rivalry and evolving market dynamics, driven by the presence of both large and emerging local players. While established enterprises continue to dominate in terms of market share due to their extensive resources, smaller companies are focusing on niche segments by offering specialized solutions and tailored services. Across the industry, organizations are actively pursuing strategies to strengthen their competitive positioning, including the development of innovative technologies, formation of strategic alliances and partnerships, and expansion of product portfolios. Additionally, sustained investments in research, recent technological advancements, are further enabling companies to enhance their CPS offerings and broaden their global presence.
Emerging Trends in Cyber Physical Systems Industry
Emerging trends in the CPS industry are shaped by the convergence of advanced digital technologies with physical infrastructure, enabling more intelligent, autonomous, and secure operations. One of the most prominent trends is the integration of artificial intelligence and machine learning into CPS architectures, which enhances real-time decision-making. Additionally, the growing adoption of edge computing is facilitating decentralized data processing, allowing CPS to operate with reduced latency and improved efficiency.
Another key trend is the increasing emphasis on cybersecurity within CPS environments, driven by the rising frequency and advancement of cyber-physical attacks targeting critical infrastructure and connected devices. Organizations are adopting advanced security frameworks, including zero-trust architectures and operational technology (OT)-aware monitoring systems, to safeguard integrated environments and ensure system resilience. Moreover, the shift towards energy-efficient and sustainable systems is gaining momentum, with CPS playing a crucial role in optimizing resource utilization and supporting smart grid technologies.
Asia Dominates the Cyber Physical Systems Market
According to our analysis, in the current year, Asia captures the highest share of the global cyber physical systems market. This leadership is primarily attributed to combination of favorable government initiatives, increasing adoption of intelligent transportation systems, and the operational advantages of CPS technologies. Furthermore, the large and expanding automotive market, supported by high population density and fast-growing economies, has further accelerated CPS adoption. In addition, substantial investments in research and development across the region are playing a pivotal role in shaping the future trajectory of cyber-physical systems in Asia.
Key Challenges in the Cyber Physical Systems Market
Despite strong growth projections, the market faces several challenges that hinder the widespread implementation of these technologies. A primary concern is the complexity of data generation and utilization within CPS environments, which makes data management and integration increasingly difficult. Additionally, CPS often rely on customized software solutions, the development of which can be both time-consuming and costly. Furthermore, concerns related to cybersecurity, data privacy, and lack of user trust continue to pose significant barriers, potentially limiting the pace of market adoption.
Cyber Physical Systems Market: Key Market Segmentation
Market Share by Type of Cyber Physical System
- EP-CPS
- IT-CPS
- Others
Market Share by Type of Component
- Hardware
- Services
- Software
Market Share by Type of Security
- Embedded
- Industrial Control Systems (ICS)
- Internet of Things (IoT)
- Robotics
- Others
Market Share by End Users
- Aerospace and Defense
- Automotive
- Consumer Electronics
- E-commerce
- Energy Utility
- Healthcare
- Manufacturing
- Others
Market Share by Geographical Regions
- North America
- US
- Canada
- Mexico
- Other North American countries
- Europe
- Austria
- Belgium
- Denmark
- France
- Germany
- Ireland
- Italy
- Netherlands
- Norway
- Russia
- Spain
- Sweden
- Switzerland
- UK
- Other European countries
- Asia
- China
- India
- Japan
- Singapore
- South Korea
- Other Asian countries
- Latin America
- Brazil
- Chile
- Colombia
- Venezuela
- Other Latin American countries
- Middle East and North Africa
- Egypt
- Iran
- Iraq
- Israel
- Kuwait
- Saudi Arabia
- UAE
- Other MENA countries
- Rest of the World
- Australia
- New Zealand
- Other countries
Example Players in Cyber Physical Systems Market
- Astri
- Broadcom
- Dell
- EIT Digital
- Galois
- Hewlett Packard
- Hitachi Vantara
- Honeywell
- IBM
- Intel
- ITIH
- MathWorks
- Microsoft
- NIST
- Oracle
- SAP
- Schneider
- SEI
- Siemens
- TCS
Cyber Physical Systems Market: Report Coverage
The report on the cyber physical systems market features insights on various sections, including:
- Market Sizing and Opportunity Analysis: An in-depth analysis of the cyber physical systems market, focusing on key market segments, including [A] type of cyber physical system, [B] type of component, [C] type of security, [D] end users, and [E] geographical regions.
- Competitive Landscape: A comprehensive analysis of the companies engaged in the cyber physical systems market, based on several relevant parameters, such as [A] year of establishment, [B] company size, [C] location of headquarters and [D] ownership structure.
- Company Profiles: Elaborate profiles of prominent players engaged in the cyber physical systems market, providing details on [A] location of headquarters, [B] company size, [C] company mission, [D] company footprint, [E] management team, [F] contact details, [G] financial information, [H] operating business segments, [I] product / technology portfolio, [J] recent developments, and an informed future outlook.
- Megatrends: An evaluation of ongoing megatrends in the cyber physical systems industry.
- Patent Analysis: An insightful analysis of patents filed / granted in the cyber physical systems domain, based on relevant parameters, including [A] type of patent, [B] patent publication year, [C] patent age and [D] leading players.
- Recent Developments: An overview of the recent developments made in the cyber physical systems market, along with analysis based on relevant parameters, including [A] year of initiative, [B] type of initiative, [C] geographical distribution and [D] most active players.
- Porter's Five Forces Analysis: An analysis of five competitive forces prevailing in the cyber physical systems market, including threats of new entrants, bargaining power of buyers, bargaining power of suppliers, threats of substitute products and rivalry among existing competitors.
- SWOT Analysis: An insightful SWOT framework, highlighting the strengths, weaknesses, opportunities and threats in the domain. Additionally, it provides Harvey ball analysis, highlighting the relative impact of each SWOT parameter.
Key Questions Answered in this Report
- What is the current and future market size?
- Who are the leading companies in this market?
- What are the growth drivers that are likely to influence the evolution of this market?
- What are the key partnership and funding trends shaping this industry?
- Which region is likely to grow at higher CAGR till 2035?
- How is the current and future market opportunity likely to be distributed across key market segments?
Reasons to Buy this Report
- Detailed Market Analysis: The report provides a comprehensive market analysis, offering detailed revenue projections of the overall market and its specific sub-segments. This information is valuable to both established market leaders and emerging entrants.
- In-depth Analysis of Trends: Stakeholders can leverage the report to gain a deeper understanding of the competitive dynamics within the market. Each report maps ecosystem activity across partnerships, funding, and patent landscapes to reveal growth hotspots and white spaces in the industry.
- Opinion of Industry Experts: The report features extensive interviews and surveys with key opinion leaders and industry experts to validate market trends mentioned in the report.
- Decision-ready Deliverables: The report offers stakeholders with strategic frameworks (Porter's Five Forces, value chain, SWOT), and complimentary Excel / slide packs with customization support.
Additional Benefits
- Complimentary Dynamic Excel Dashboards for Analytical Modules
- Exclusive 15% Free Content Customization
- Personalized Interactive Report Walkthrough with Our Expert Research Team
- Free Report Updates for Versions Older than 6-12 Months
TABLE OF CONTENTS
SECTION I: REPORT OVERVIEW
1. PREFACE
- 1.1. Introduction
- 1.2. Market Share Insights
- 1.3. Key Market Insights
- 1.4. Report Coverage
- 1.5. Key Questions Answered
- 1.6. Chapter Outlines
2. RESEARCH METHODOLOGY
- 2.1. Chapter Overview
- 2.2. Research Assumptions
- 2.3. Database Building
- 2.3.1. Data Collection
- 2.3.2. Data Validation
- 2.3.3. Data Analysis
- 2.4. Project Methodology
- 2.4.1. Secondary Research
- 2.4.1.1. Annual Reports
- 2.4.1.2. Academic Research Papers
- 2.4.1.3. Company Websites
- 2.4.1.4. Investor Presentations
- 2.4.1.5. Regulatory Filings
- 2.4.1.6. White Papers
- 2.4.1.7. Industry Publications
- 2.4.1.8. Conferences and Seminars
- 2.4.1.9. Government Portals
- 2.4.1.10. Media and Press Releases
- 2.4.1.11. Newsletters
- 2.4.1.12. Industry Databases
- 2.4.1.13. Roots Proprietary Databases
- 2.4.1.14. Paid Databases and Sources
- 2.4.1.15. Social Media Portals
- 2.4.1.16. Other Secondary Sources
- 2.4.2. Primary Research
- 2.4.2.1. Introduction
- 2.4.2.2. Types
- 2.4.2.2.1. Qualitative
- 2.4.2.2.2. Quantitative
- 2.4.2.3. Advantages
- 2.4.2.4. Techniques
- 2.4.2.4.1. Interviews
- 2.4.2.4.2. Surveys
- 2.4.2.4.3. Focus Groups
- 2.4.2.4.4. Observational Research
- 2.4.2.4.5. Social Media Interactions
- 2.4.2.5. Stakeholders
- 2.4.2.5.1. Company Executives (CXOs)
- 2.4.2.5.2. Board of Directors
- 2.4.2.5.3. Company Presidents and Vice Presidents
- 2.4.2.5.4. Key Opinion Leaders
- 2.4.2.5.5. Research and Development Heads
- 2.4.2.5.6. Technical Experts
- 2.4.2.5.7. Subject Matter Experts
- 2.4.2.5.8. Scientists
- 2.4.2.5.9. Doctors and Other Healthcare Providers
- 2.4.2.6. Ethics and Integrity
- 2.4.2.6.1. Research Ethics
- 2.4.2.6.2. Data Integrity
- 2.4.3. Analytical Tools and Databases
- 2.4.1. Secondary Research
3. MARKET DYNAMICS
- 3.1. Forecast Methodology
- 3.1.1. Top-Down Approach
- 3.1.2. Bottom-Up Approach
- 3.1.3. Hybrid Approach
- 3.2. Market Assessment Framework
- 3.2.1. Total Addressable Market (TAM)
- 3.2.2. Serviceable Addressable Market (SAM)
- 3.2.3. Serviceable Obtainable Market (SOM)
- 3.2.4. Currently Acquired Market (CAM)
- 3.3. Forecasting Tools and Techniques
- 3.3.1. Qualitative Forecasting
- 3.3.2. Correlation
- 3.3.3. Regression
- 3.3.4. Time Series Analysis
- 3.3.5. Extrapolation
- 3.3.6. Convergence
- 3.3.7. Forecast Error Analysis
- 3.3.8. Data Visualization
- 3.3.9. Scenario Planning
- 3.3.10. Sensitivity Analysis
- 3.4. Key Considerations
- 3.4.1. Demographics
- 3.4.2. Market Access
- 3.4.3. Reimbursement Scenarios
- 3.4.4. Industry Consolidation
- 3.5. Robust Quality Control
- 3.6. Key Market Segmentations
- 3.7. Limitations
4. MACRO-ECONOMIC INDICATORS
- 4.1. Chapter Overview
- 4.2. Market Dynamics
- 4.2.1. Time Period
- 4.2.1.1. Historical Trends
- 4.2.1.2. Current and Forecasted Estimates
- 4.2.2. Currency Coverage
- 4.2.2.1. Overview of Major Currencies Affecting the Market
- 4.2.2.2. Impact of Currency Fluctuations on the Industry
- 4.2.3. Foreign Exchange Impact
- 4.2.3.1. Evaluation of Foreign Exchange Rates and Their Impact on Market
- 4.2.3.2. Strategies for Mitigating Foreign Exchange Risk
- 4.2.4. Recession
- 4.2.4.1. Historical Analysis of Past Recessions and Lessons Learnt
- 4.2.4.2. Assessment of Current Economic Conditions and Potential Impact on the Market
- 4.2.5. Inflation
- 4.2.5.1. Measurement and Analysis of Inflationary Pressures in the Economy
- 4.2.5.2. Potential Impact of Inflation on the Market Evolution
- 4.2.6. Interest Rates
- 4.2.6.1. Overview of Interest Rates and Their Impact on the Market
- 4.2.6.2. Strategies for Managing Interest Rate Risk
- 4.2.7. Commodity Flow Analysis
- 4.2.7.1. Type of Commodity
- 4.2.7.2. Origins and Destinations
- 4.2.7.3. Values and Weights
- 4.2.7.4. Modes of Transportation
- 4.2.8. Global Trade Dynamics
- 4.2.8.1. Import Scenario
- 4.2.8.2. Export Scenario
- 4.2.9. War Impact Analysis
- 4.2.9.1. Russian-Ukraine War
- 4.2.9.2. Israel-Hamas War
- 4.2.10. COVID Impact / Related Factors
- 4.2.10.1. Global Economic Impact
- 4.2.10.2. Industry-specific Impact
- 4.2.10.3. Government Response and Stimulus Measures
- 4.2.10.4. Future Outlook and Adaptation Strategies
- 4.2.11. Other Indicators
- 4.2.11.1. Fiscal Policy
- 4.2.11.2. Consumer Spending
- 4.2.11.3. Gross Domestic Product (GDP)
- 4.2.11.4. Employment
- 4.2.11.5. Taxes
- 4.2.11.6. R&D Innovation
- 4.2.11.7. Stock Market Performance
- 4.2.11.8. Supply Chain
- 4.2.11.9. Cross-Border Dynamics
- 4.2.1. Time Period
SECTION II: QUALITATIVE INSIGHTS
5. EXECUTIVE SUMMARY
6. INTRODUCTION
- 6.1. Chapter Overview
- 6.2. Overview of Cyber Physical Systems Market
- 6.2.1. Type of Cyber Physical Systems
- 6.2.2. Type of Components
- 6.2.3. Type of Security
- 6.2.4. Type of End Users
- 6.3. Future Perspective
7. REGULATORY SCENARIO
SECTION III: MARKET OVERVIEW
8. COMPREHENSIVE DATABASE OF LEADING PLAYERS
9. COMPETITIVE LANDSCAPE
- 9.1. Chapter Overview
- 9.2. Cyber physical systems: Overall Market Landscape
- 9.2.1. Analysis by Year of Establishment
- 9.2.2. Analysis by Company Size
- 9.2.3. Analysis by Location of Headquarters
- 9.2.4. Analysis by Ownership Structure
10. WHITE SPACE ANALYSIS
11. COMPANY COMPETITIVENESS ANALYSIS
12. STARTUP ECOSYSTEM IN THE CYBER PHYSICAL SYSTEMS MARKET
- 12.1. Cyber Physical Systems Market: Market Landscape of Startups
- 12.1.1. Analysis by Year of Establishment
- 12.1.2. Analysis by Company Size
- 12.1.3. Analysis by Company Size and Year of Establishment
- 12.1.4. Analysis by Location of Headquarters
- 12.1.5. Analysis by Company Size and Location of Headquarters
- 12.1.6. Analysis by Ownership Structure
- 12.2. Key Findings
SECTION IV: COMPANY PROFILES
13. COMPANY PROFILES
- 13.1. Chapter Overview
- 13.2. Astri*
- 13.2.1. Company Overview
- 13.2.2. Company Mission
- 13.2.3. Company Footprint
- 13.2.4. Management Team
- 13.2.5. Contact Details
- 13.2.6. Financial Performance
- 13.2.7. Operating Business Segments
- 13.2.8. Service / Product Portfolio (project specific)
- 13.2.9. MOAT Analysis
- 13.2.10. Recent Developments and Future Outlook
- 13.3. Broadcom
- 13.4. Dell
- 13.5. EIT Digital
- 13.6. Galois
- 13.7. Hewlett Packard
- 13.8. Hitachi Vantara
- 13.9. Honeywell
- 13.10. IBM
- 13.11. Intel
- 13.12. ITIH
- 13.13. MathWorks
- 13.14. Microsoft
- 13.15. NIST
- 13.16. Oracle
- 13.17. SAP
- 13.18. Schneider
- 13.19. SEI
- 13.20. Seimens
- 13.21. TCS
SECTION V: MARKET TRENDS
14. MEGA TRENDS ANALYSIS
15. UNMET NEED ANALYSIS
16. PATENT ANALYSIS
17. RECENT DEVELOPMENTS
- 17.1. Chapter Overview
- 17.2. Recent Funding
- 17.3. Recent Partnerships
- 17.4. Other Recent Initiatives
SECTION VI: MARKET OPPORTUNITY ANALYSIS
18. GLOBAL CYBER PHYSICAL SYSTEMS MARKET
- 18.1. Chapter Overview
- 18.2. Key Assumptions and Methodology
- 18.3. Trends Disruption Impacting Market
- 18.4. Demand Side Trends
- 18.5. Supply Side Trends
- 18.6. Global Cyber Physical Systems Market, Historical Trends (Since 2020) and Forecasted Estimates (Till 2035)
- 18.7. Multivariate Scenario Analysis
- 18.7.1. Conservative Scenario
- 18.7.2. Optimistic Scenario
- 18.8. Investment Feasibility Index
- 18.9. Key Market Segmentations
19. MARKET OPPORTUNITIES BASED ON TYPE OF CYBER PHYSICAL SYSTEM
- 19.1. Chapter Overview
- 19.2. Key Assumptions and Methodology
- 19.3. Revenue Shift Analysis
- 19.4. Market Movement Analysis
- 19.5. Penetration-Growth (P-G) Matrix
- 19.6. Cyber Physical Systems Market for EP-CPS: Historical Trends (Since 2020) and Forecasted Estimates (Till 2035)
- 19.7. Cyber Physical Systems Market for IT-CPS: Historical Trends (Since 2020) and Forecasted Estimates (Till 2035)
- 19.8. Cyber Physical Systems Market for Others: Historical Trends (Since 2020) and Forecasted Estimates (Till 2035)
- 19.9. Data Triangulation and Validation
- 19.9.1. Secondary Sources
- 19.9.2. Primary Sources
- 19.9.3. Statistical Modeling
20. MARKET OPPORTUNITIES BASED ON TYPE OF COMPONENT
- 20.1. Chapter Overview
- 20.2. Key Assumptions and Methodology
- 20.3. Revenue Shift Analysis
- 20.4. Market Movement Analysis
- 20.5. Penetration-Growth (P-G) Matrix
- 20.6. Cyber Physical Systems Market for Hardware: Historical Trends (Since 2020) and Forecasted Estimates (Till 2035)
- 20.7. Cyber Physical Systems Market for Services: Historical Trends (Since 2020) and Forecasted Estimates (Till 2035)
- 20.8. Cyber Physical Systems Market for Software: Historical Trends (Since 2020) and Forecasted Estimates (Till 2035)
- 20.9. Data Triangulation and Validation
- 20.9.1. Secondary Sources
- 20.9.2. Primary Sources
- 20.9.3. Statistical Modeling
21. MARKET OPPORTUNITIES BASED ON TYPE OF SECURITY
- 21.1. Chapter Overview
- 21.2. Key Assumptions and Methodology
- 21.3. Revenue Shift Analysis
- 21.4. Market Movement Analysis
- 21.5. Penetration-Growth (P-G) Matrix
- 21.6. Cyber Physical Systems Market for Embedded: Historical Trends (Since 2020) and Forecasted Estimates (Till 2035)
- 21.7. Cyber Physical Systems Market for Industrial Control Systems (ICT): Historical Trends (Since 2020) and Forecasted Estimates (Till 2035)
- 21.8. Cyber Physical Systems Market for Internet of Things (IoT): Historical Trends (Since 2020) and Forecasted Estimates (Till 2035)
- 21.9. Cyber Physical Systems Market for Robotics: Historical Trends (Since 2020) and Forecasted Estimates (Till 2035)
- 21.10. Cyber Physical Systems Market for Others: Historical Trends (Since 2020) and Forecasted Estimates (Till 2035)
- 21.11. Data Triangulation and Validation
- 21.11.1. Secondary Sources
- 21.11.2. Primary Sources
- 21.11.3. Statistical Modeling
22. MARKET OPPORTUNITIES BASED ON END USERS
- 22.1. Chapter Overview
- 22.2. Key Assumptions and Methodology
- 22.3. Revenue Shift Analysis
- 22.4. Market Movement Analysis
- 22.5. Penetration-Growth (P-G) Matrix
- 22.6. Cyber Physical Systems Market for Aerospace and Defense: Historical Trends (Since 2020) and Forecasted Estimates (Till 2035)
- 22.7. Cyber Physical Systems Market for Automotive: Historical Trends (Since 2020) and Forecasted Estimates (Till 2035)
- 22.8. Cyber Physical Systems Market for Consumer Electronics: Historical Trends (Since 2020) and Forecasted Estimates (Till 2035)
- 22.9. Cyber Physical Systems Market for E-Commerce: Historical Trends (Since 2020) and Forecasted Estimates (Till 2035)
- 22.10. Cyber Physical Systems Market for Energy Utility: Historical Trends (Since 2020) and Forecasted Estimates (Till 2035)
- 22.11. Cyber Physical Systems Market for Healthcare: Historical Trends (Since 2020) and Forecasted Estimates (Till 2035)
- 22.12. Cyber Physical Systems Market for Manufacturing: Historical Trends (Since 2020) and Forecasted Estimates (Till 2035)
- 22.13. Cyber Physical Systems Market for Others: Historical Trends (Since 2020) and Forecasted Estimates (Till 2035)
- 22.14. Data Triangulation and Validation
- 22.14.1. Secondary Sources
- 22.14.2. Primary Sources
- 22.14.3. Statistical Modeling
23. MARKET OPPORTUNITIES CYBER PHYSICAL SYSTEMS IN NORTH AMERICA
- 23.1. Chapter Overview
- 23.2. Key Assumptions and Methodology
- 23.3. Revenue Shift Analysis
- 23.4. Market Movement Analysis
- 23.5. Penetration-Growth (P-G) Matrix
- 23.6. Cyber Physical Systems Market in North America: Historical Trends (Since 2020) and Forecasted Estimates (Till 2035)
- 23.6.1. Cyber Physical Systems Market in the US: Historical Trends (Since 2020) and Forecasted Estimates (Till 2035)
- 23.6.2. Cyber Physical Systems Market in Canada: Historical Trends (Since 2020) and Forecasted Estimates (Till 2035)
- 23.6.3. Cyber Physical Systems Market in Mexico: Historical Trends (Since 2020) and Forecasted Estimates (Till 2035)
- 23.6.4. Cyber Physical Systems Market in Other North American Countries: Historical Trends (Since 2020) and Forecasted Estimates (Till 2035)
- 23.7. Data Triangulation and Validation
24. MARKET OPPORTUNITIES FOR CYBER PHYSICAL SYSTEMS IN EUROPE
- 24.1. Chapter Overview
- 24.2. Key Assumptions and Methodology
- 24.3. Revenue Shift Analysis
- 24.4. Market Movement Analysis
- 24.5. Penetration-Growth (P-G) Matrix
- 24.6. Cyber Physical Systems Market in Europe: Historical Trends (Since 2020) and Forecasted Estimates (Till 2035)
- 24.6.1. Cyber Physical Systems Market in Austria: Historical Trends (Since 2020) and Forecasted Estimates (Till 2035)
- 24.6.2. Cyber Physical Systems Market in Belgium: Historical Trends (Since 2020) and Forecasted Estimates (Till 2035)
- 24.6.3. Cyber Physical Systems Market in Denmark: Historical Trends (Since 2020) and Forecasted Estimates (Till 2035)
- 24.6.4. Cyber Physical Systems Market in France: Historical Trends (Since 2020) and Forecasted Estimates (Till 2035)
- 24.6.5. Cyber Physical Systems Market in Germany: Historical Trends (Since 2020) and Forecasted Estimates (Till 2035)
- 24.6.6. Cyber Physical Systems Market in Ireland: Historical Trends (Since 2020) and Forecasted Estimates (Till 2035)
- 24.6.7. Cyber Physical Systems Market in Italy: Historical Trends (Since 2020) and Forecasted Estimates (Till 2035)
- 24.6.8. Cyber Physical Systems Market in Netherlands: Historical Trends (Since 2020) and Forecasted Estimates (Till 2035)
- 24.6.9. Cyber Physical Systems Market in Norway: Historical Trends (Since 2020) and Forecasted Estimates (Till 2035)
- 24.6.10. Cyber Physical Systems Market in Russia: Historical Trends (Since 2020) and Forecasted Estimates (Till 2035)
- 24.6.11. Cyber Physical Systems Market in Spain: Historical Trends (Since 2020) and Forecasted Estimates (Till 2035)
- 24.6.12. Cyber Physical Systems Market in Sweden: Historical Trends (Since 2020) and Forecasted Estimates (Till 2035)
- 24.6.13. Cyber Physical Systems Market in Sweden: Historical Trends (Since 2020) and Forecasted Estimates (Till 2035)
- 24.6.14. Cyber Physical Systems Market in Switzerland: Historical Trends (Since 2020) and Forecasted Estimates (Till 2035)
- 24.6.15. Cyber Physical Systems Market in the UK: Historical Trends (Since 2020) and Forecasted Estimates (Till 2035)
- 24.6.16. Cyber Physical Systems Market in Other European Countries: Historical Trends (Since 2020) and Forecasted Estimates (Till 2035)
- 24.7. Data Triangulation and Validation
25. MARKET OPPORTUNITIES FOR CYBER PHYSICAL SYSTEMS IN ASIA
- 25.1. Chapter Overview
- 25.2. Key Assumptions and Methodology
- 25.3. Revenue Shift Analysis
- 25.4. Market Movement Analysis
- 25.5. Penetration-Growth (P-G) Matrix
- 25.6. Cyber Physical Systems Market in Asia: Historical Trends (Since 2020) and Forecasted Estimates (Till 2035)
- 25.6.1. Cyber Physical Systems Market in China: Historical Trends (Since 2020) and Forecasted Estimates (Till 2035)
- 25.6.2. Cyber Physical Systems Market in India: Historical Trends (Since 2020) and Forecasted Estimates (Till 2035)
- 25.6.3. Cyber Physical Systems Market in Japan: Historical Trends (Since 2020) and Forecasted Estimates (Till 2035)
- 25.6.4. Cyber Physical Systems Market in Singapore: Historical Trends (Since 2020) and Forecasted Estimates (Till 2035)
- 25.6.5. Cyber Physical Systems Market in South Korea: Historical Trends (Since 2020) and Forecasted Estimates (Till 2035)
- 25.6.6. Cyber Physical Systems Market in Other Asian Countries: Historical Trends (Since 2020) and Forecasted Estimates (Till 2035)
- 25.7. Data Triangulation and Validation
26. MARKET OPPORTUNITIES FOR CYBER PHYSICAL SYSTEMS IN MIDDLE EAST AND NORTH AFRICA (MENA)
- 26.1. Chapter Overview
- 26.2. Key Assumptions and Methodology
- 26.3. Revenue Shift Analysis
- 26.4. Market Movement Analysis
- 26.5. Penetration-Growth (P-G) Matrix
- 26.6. Cyber Physical Systems Market in Middle East and North Africa (MENA): Historical Trends (Since 2020) and Forecasted Estimates (Till 2035)
- 26.6.1. Cyber Physical Systems Market in Egypt: Historical Trends (Since 2020) and Forecasted Estimates (Till 205)
- 26.6.2. Cyber Physical Systems Market in Iran: Historical Trends (Since 2020) and Forecasted Estimates (Till 2035)
- 26.6.3. Cyber Physical Systems Market in Iraq: Historical Trends (Since 2020) and Forecasted Estimates (Till 2035)
- 26.6.4. Cyber Physical Systems Market in Israel: Historical Trends (Since 2020) and Forecasted Estimates (Till 2035)
- 26.6.5. Cyber Physical Systems Market in Kuwait: Historical Trends (Since 2020) and Forecasted Estimates (Till 2035)
- 26.6.6. Cyber Physical Systems Market in Saudi Arabia: Historical Trends (Since 2020) and Forecasted Estimates (Till 2035)
- 26.6.7. Cyber Physical Systems Market in United Arab Emirates (UAE): Historical Trends (Since 2020) and Forecasted Estimates (Till 2035)
- 26.6.8. Cyber Physical Systems Market in Other MENA Countries: Historical Trends (Since 2020) and Forecasted Estimates (Till 2035)
- 26.7. Data Triangulation and Validation
27. MARKET OPPORTUNITIES FOR CYBER PHYSICAL SYSTEMS IN LATIN AMERICA
- 27.1. Chapter Overview
- 27.2. Key Assumptions and Methodology
- 27.3. Revenue Shift Analysis
- 27.4. Market Movement Analysis
- 27.5. Penetration-Growth (P-G) Matrix
- 27.6. Cyber Physical Systems Market in Latin America: Historical Trends (Since 2020) and Forecasted Estimates (Till 2035)
- 27.6.1. Cyber Physical Systems Market in Argentina: Historical Trends (Since 2020) and Forecasted Estimates (Till 2035)
- 27.6.2. Cyber Physical Systems Market in Brazil: Historical Trends (Since 2020) and Forecasted Estimates (Till 2035)
- 27.6.3. Cyber Physical Systems Market in Chile: Historical Trends (Since 2020) and Forecasted Estimates (Till 2035)
- 27.6.4. Cyber Physical Systems Market in Colombia Historical Trends (Since 2020) and Forecasted Estimates (Till 2035)
- 27.6.5. Cyber Physical Systems Market in Venezuela: Historical Trends (Since 2020) and Forecasted Estimates (Till 2035)
- 27.6.6. Cyber Physical Systems Market in Other Latin American Countries: Historical Trends (Since 2020) and Forecasted Estimates (Till 2035)
- 27.7. Data Triangulation and Validation
28. MARKET OPPORTUNITIES FOR CYBER PHYSICAL SYSTEMS IN REST OF THE WORLD
- 28.1. Chapter Overview
- 28.2. Key Assumptions and Methodology
- 28.3. Revenue Shift Analysis
- 28.4. Market Movement Analysis
- 28.5. Penetration-Growth (P-G) Matrix
- 28.6. Cyber Physical Systems Market in Rest of the World: Historical Trends (Since 2020) and Forecasted Estimates (Till 2035)
- 28.6.1. Cyber Physical Systems Market in Australia: Historical Trends (Since 2020) and Forecasted Estimates (Till 2035)
- 28.6.2. Cyber Physical Systems Market in New Zealand: Historical Trends (Since 2020) and Forecasted Estimates (Till 2035)
- 28.6.3. Cyber Physical Systems Market in Other Countries
- 28.7. Data Triangulation and Validation
29. MARKET CONCENTRATION ANALYSIS: DISTRIBUTION BY LEADING PLAYERS
30. ADJACENT MARKET ANALYSIS
SECTION VII: STRATEGIC TOOLS
31. KEY WINNING STRATEGIES
32. PORTER'S FIVE FORCES ANALYSIS
33. SWOT ANALYSIS
34. VALUE CHAIN ANALYSIS
35. ROOTS STRATEGIC RECOMMENDATIONS
- 35.1. Chapter Overview
- 35.2. Key Business-related Strategies
- 35.2.1. Research & Development
- 35.2.2. Product Manufacturing
- 35.2.3. Commercialization / Go-to-Market
- 35.2.4. Sales and Marketing
- 35.3. Key Operations-related Strategies
- 35.3.1. Risk Management
- 35.3.2. Workforce
- 35.3.3. Finance
- 35.3.4. Others
SECTION VIII: OTHER EXCLUSIVE INSIGHTS
36. INSIGHTS FROM PRIMARY RESEARCH
37. REPORT CONCLUSION
SECTION IX: APPENDIX
38. TABULATED DATA
39. LIST OF COMPANIES AND ORGANIZATIONS
40. CUSTOMIZATION OPPORTUNITIES
41. ROOTS SUBSCRIPTION SERVICES
42. AUTHOR DETAILS

