
PUBLISHER: Roots Analysis | PRODUCT CODE: 2055603

PUBLISHER: Roots Analysis | PRODUCT CODE: 2055603
Biologics API Market: Trends and Forecast Til 2035 - Distribution Type of Modality, Type of Expression System, Type of Bioreactor, Scale of Operation, Type of Manufacturer, and Geographical Regions
Biologics API Market: Overview
As per Roots Analysis, the global biologics API market is estimated to grow from USD 68.4 billion in the current year to USD 145.9 billion by 2035, at a CAGR of 8.0% during the forecast period, till 2035.
Biologics API Market: Growth and Trends
Biologics active pharmaceutical ingredients (API) refer to the biologically active substances in biological medications that are accountable for generating the intended therapeutic outcomes in patients. The therapeutic biologically active components are generated through a variety of biotechnological methods / techniques, including recombinant DNA technology. It is important to note that till date, over 400 biologics have been approved by the FDA, which includes monoclonal antibodies, mRNA therapies and vaccines, as well as bispecific antibodies. Significantly, the worldwide transition to personalized therapy has heightened interest and investment in the biologics API sector.
Numerous major biopharmaceutical companies, including Novartis, Pfizer, Roche, and Eli Lilly, are backing the active pharmaceutical ingredient production within their in-house API manufacturing sites to efficiently produce a range of biologics. Additionally, substantial advancements are occurring in the biomanufacturing sector. Recently, Merck revealed plans for a 470,000-square-foot advanced biologics center of excellence in Wilmington, Delaware, aimed at the commercial manufacturing of innovative biologics and therapies, including powerful antibody-drug conjugates (ADCs).
With the advancement of biologics and their approval by regulatory bodies, it is anticipated that API production will increase, coupled with biologic developers manufacturing active pharmaceutical ingredients in their own facilities. Additionally, to satisfy the demand for biologics, the production of APIs will continue to be outsourced to contract manufacturers, creating a market opportunity for biologics API CDMO.
Growth Drivers: Strategic Enablers of Market Expansion
Market drivers in the biologics API market include rising prevalence of chronic diseases and accelerating demand for advanced biologics like cell / gene therapies, vaccines, bispecific antibodies, and ADCs.
Market Challenges: Critical Barriers Impeding Progress
Stringent regulatory standards for quality, safety, and efficacy pose major hurdles, alongside high manufacturing costs and complex production processes. Supply chain disruptions, need for specialized high-containment facilities, and scaling difficulties for high-potency biologics add operational barriers. Intense competition and environmental sustainability concerns in API production also threaten profitability.
Biologics API Market: Key Insights
The report delves into the current state of the biologics API market and identifies potential growth opportunities within industry. Some key findings from the report include:
- Presently, the biologics API market (by value) is anticipated to be USD 70 billion, with monoclonal antibodies capturing the majority market share by value.
- The market growth is indicative of the growing interest of stakeholders in the field of biologics active pharmaceutical ingredients; in fact, close to 50% of market is likely to be captured by North America.
- Given the rising prevalence of chronic diseases and the increasing demand for biologics, the biologics active pharmaceutical ingredients industry is well-positioned for future growth.
- Over 25 million liters is the current volume of other biologics API market. This demand is likely to reach more than 75 million liters by 2035 with monoclonal antibodies API capturing the majority (50.5%) market share.
Biologics API Market
The market sizing and opportunity analysis has been segmented across the following parameters:
By Type of Modality
- Monoclonal Antibodies
- Proteins / Peptides
- Vaccines
- Cell Therapies
- Biosimilars
- Bispecific Antibodies
- ADCs
- Gene Therapies
- mRNA Therapies and Vaccines
By Type of Expression System
- Mammalian
- Microbial
- Others
By Type of Bioreactor
- Single-use Bioreactors
- Stainless-steel Bioreactors
By Scale of Operation
- Preclinical / Clinical
- Commercial
By Type of Manufacturer
- In-house Manufacturers
- CMOs / CDMOs
- Hybrid Manufacturers
By Geographical Regions
- North America
- Europe
- Asia-Pacific
- Middle East and North Africa
- Latin America
Biologics API Market: Key Segments
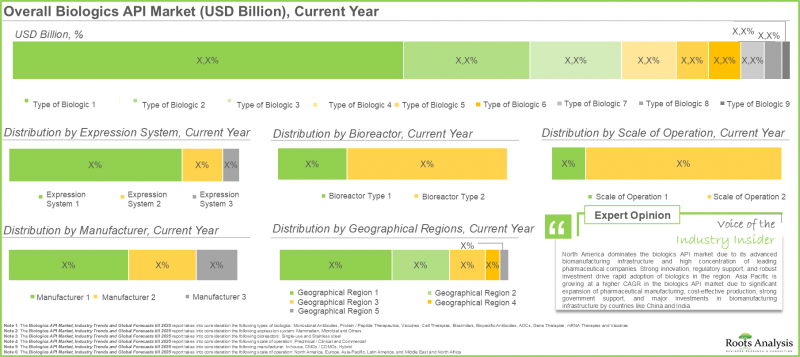
Market Share by Type of Expression System: Mammalian Expression Systems are Likely to Drive the Demand
In terms of expression systems, the biologics API market is segmented across mammalian, microbial and other expression systems. The biologics API market analysis forecast suggests that the mammalian expression system category will dominate the market, securing over 75% of the overall revenue share. Moreover, the existing mammalian expression system constitutes 90%, 86%, and 77% of the overall ADC API market, cell and gene therapy API market. The other expression systems segment is anticipated to reach a greater CAGR. This results from the growing use of plant and insect cell lines to produce various biologics, including protein-peptide therapeutics.
Market Share by Type of API Manufacturer: How Large is the API Manufacturer Segment?
According to the biologics API market forecast, currently, in-house segment holds the biggest share and is expected to remain stable moving forward. This arises from the proactive investment, growth, and acquisition efforts of the internal producers in this field. Certain biologics API producers with internal facilities are AbbVie, Amgen, Eli Lilly, and Sanofi. In the coming years, the hybrid manufacturing segment is expected to expand at a higher CAGR (8.3%) throughout the prediction period.
North America: Remains the Center for Technological Innovations
At present, North America leads the market and is expected to continue this trend in the future. This expansion results from the presence of prominent pharmaceutical developers and manufacturers, advanced healthcare systems, and strong research and development (R&D) capabilities in the area, promoting ongoing advancement for tailored therapies. Moreover, the significant occurrence of chronic illnesses in this area has prompted the government to enhance efforts for creating novel treatments.
Biologics API Market: Research Coverage
- Market Sizing and Opportunity Analysis: The report features an in-depth analysis of the biologics API market, focusing on key market segments, including [A] type of modality, [B] type of expression system, [C] type of bioreactor, [D] scale of operation, [E] type of manufacturer, and [F] geographical regions.
- Market Landscape Analysis: A detailed overview of the current market landscape of biologics API manufacturers along with information on several relevant parameters, such as [A] year of establishment, [B] company size, [C] location of headquarters, [D] type of biologic, [E] type of API manufactured, [F] scale of operation, and [G] geographical presence.
- Company Competitiveness Analysis: An insightful company competitiveness analysis of prominent biologics API contract manufacturers in the biologics API manufacturing industry, based on several relevant parameters, such as [A] supplier strength, [A] service portfolio and [A] number of biologics offered.
- Company Profiles: In-depth profiles of prominent players North America, Europe and Asia-Pacific that are engaged in the peptide therapeutics manufacturing market based on [A] year of establishment, [B] location of headquarters, [C] product portfolio, [D] recent developments and [E] an informed future outlook.
- Market Impact Analysis: An in-depth analysis of the factors that can impact the growth of the global biologics API market. It also features identification and analysis of [A] key drivers, [B] potential restraints, [C] emerging opportunities, and [D] existing challenges.
Key Questions Answered in this Report
- Which are the leading companies in the biologics API market?
- Which region dominates the biologics API market?
- What are the key trends observed in the biologics API market?
- What factors are likely to influence the evolution of this market?
- What are the primary challenges faced by biologic API developers?
- What is the current and future market size?
- What is the CAGR of this market?
- How is the current and future market opportunity likely to be distributed across key market segments?
Reasons to Buy this Report
- The report provides a comprehensive market analysis, offering detailed revenue projections of the overall market and its specific sub-segments. This information is valuable to both established market leaders and emerging entrants.
- The report offers stakeholders a comprehensive overview of the market, including key drivers, barriers, opportunities, and challenges. This information empowers stakeholders to stay abreast of market trends and make data-driven decisions to capitalize on growth prospects.
- The report can aid businesses in identifying future opportunities in any sector. It also helps in understanding if those opportunities are worth pursuing.
- The report helps in identifying customer demand by understanding the needs, preferences, and behavior of the target audience in order to tailor products or services effectively.
- The report equips new entrants with requisite information regarding a particular market to help them build successful business strategies.
- The report allows for more effective communication with the audience and in building strong business relations.
Additional Benefits
- Complementary PPT Insights Pack
- Complimentary Excel Data Packs for all Analytical Modules in the Report
- 15% Free Content Customization
- Detailed Report Walkthrough Session with Research Team
- Free Updated report if the report is 6-12 months old or older
TABLE OF CONTENTS
1. BACKGROUND
- 1.1. Context
- 1.2. Project Objectives
2. RESEARCH METHODOLOGY
- 2.1. Research Assumptions
- 2.1.1. Market Landscape and Market Trends
- 2.1.2. Market Forecast and Opportunity Analysis
- 2.1.3. Comparative Analysis
- 2.2. Database Building
- 2.2.1. Data Collection
- 2.2.2. Data Validation
- 2.2.3. Data Analysis
- 2.3. Project Methodology
- 2.3.1. Project Commencement
- 2.3.2. Secondary Research
- 2.3.2.1. Annual Reports
- 2.3.2.2. Academic Research Papers
- 2.3.2.3. Company Websites
- 2.3.2.4. Investor Presentations and Regulatory Filings
- 2.3.2.5. White Papers
- 2.3.2.6. Industry Publications
- 2.3.2.7. Conferences and Seminars
- 2.3.2.8. Government Portals
- 2.3.2.9. Media and Press Releases
- 2.3.2.10. Newsletters
- 2.3.2.11. Industry and Paid Databases
- 2.3.2.12. Roots Proprietary Databases
- 2.3.3. Primary Research
- 2.3.4. Data Analysis and Interpretation
- 2.3.5. Market Forecast and Validation
- 2.3.6. Report Compilation
- 2.4. Research Ethics and Integrity
- 2.5. Analytical Tools and Databases
- 2.7. Robust Quality Control Framework
3. MARKET DYNAMICS
- 3.1. Forecast Methodology
- 3.1.1. Top-Down Approach
- 3.1.2. Bottom-Up Approach
- 3.1.3. Hybrid Approach
- 3.2. Market Assessment Framework
- 3.2.1. Total Addressable Market (TAM)
- 3.2.2. Serviceable Addressable Market (SAM)
- 3.2.3. Serviceable Obtainable Market (SOM)
- 3.2.4. Currently Acquired Market (CAM)
- 3.3. Forecasting Tools and Techniques
- 3.3.1. Qualitative Forecasting
- 3.3.2. Correlation
- 3.3.3. Regression
- 3.3.4. Extrapolation
- 3.3.5. Convergence
- 3.3.6. Sensitivity Analysis
- 3.3.7. Scenario Planning
- 3.3.8. Data Visualization
- 3.3.9. Time Series Analysis
- 3.3.10. Forecast Error Analysis
- 3.4. Key Considerations
- 3.4.1. Demographics
- 3.4.2. Economic Factors
- 3.4.3. Competitive Landscape
- 3.4.4. Government Regulations and Policies
- 3.4.5. R&D Investment
- 3.4.6. Technological Factors
- 3.4.7. Industry Consolidation
- 3.4.8. Supply Chain
- 3.4.9. Market Access
- 3.4.10. Pandemics / Unforeseen Disruptions Impact
4. MACRO-ECONOMIC INDICATORS
- 4.1. Market Dynamics
- 4.1.1. Time Period
- 4.1.1.1. Historical Trends
- 4.1.1.2. Current and Forecasted Estimates
- 4.1.2. Currency Coverage
- 4.1.2.1. Overview of Major Currencies Affecting the Market
- 4.1.2.2. Impact of Currency Fluctuations on the Industry
- 4.1.3. Foreign Exchange Impact
- 4.1.3.1. Evaluation of Foreign Exchange Rates and Their Impact on Market
- 4.1.3.2. Strategies for Mitigating Foreign Exchange Risk
- 4.1.4. Recession
- 4.1.4.1. Historical Analysis of Past Recessions and Lessons Learnt
- 4.1.4.2. Assessment of Current Economic Conditions and Potential Impact on the Market
- 4.1.5. Inflation
- 4.1.5.1. Measurement and Analysis of Inflationary Pressures in the Economy
- 4.1.5.2. Potential Impact of Inflation on the Market Evolution
- 4.1.7. Other Indicators
- 4.1.7.1. War Impact Analysis
- 4.1.7.2. Cross-border Dynamics
- 4.1.7.3. Consumer Spendings and Gross Domestic Product
- 4.1.7.4. Stock Market Performance
- 4.1.1. Time Period
5. EXECUTIVE SUMMARY
6. MARKET LANDSCAPE
- 6.1. Chapter Overview
- 6.2. Peptide API Contract Manufacturing: Overall Market Landscape
- 6.3. Analysis by Year of Establishment
- 6.4. Analysis by Company Size
- 6.5. Analysis by Location of Headquarters
- 6.6. Analysis by Type of Biologic Manufactured
- 6.7. Analysis by Type of API Manufactured
- 6.8. Analysis by Scale of Operation
- 6.9. Analysis by Type of Service Offered
- 6.10. Analysis by Geographical Presence
7. COMPANY COMPETITIVENESS ANALYSIS
- 7.1. Chapter Overview
- 7.2. Key Parameters
- 7.3. Methodology
- 7.4. Company Competitiveness Analysis
- 7.5. Biologics API Contract Manufacturers Headquartered in North America
- 7.6. Biologics API Contract Manufacturers Headquartered in Europe
- 7.7. Biologics API Contract Manufacturers Headquartered in Asia-Pacific and Rest of the World
8. COMPANY PROFILES: BIOLOGICS API CONTRACT MANUFACTURERS
- 8.1. Chapter Overview
- 8.2. Biologics API Manufacturers: List of Companies
- 8.2.1. Company A
- 8.2.2.1. Company Overview
- 8.2.1.2. Biologics API manufacturing Portfolio
- 8.2.1.3. Biologics API Manufacturing Facilities and Capabilities
- 8.2.1.4. Recent Developments and Future Outlook
- 8.2.2. Company B
- 8.2.3. Company C
- 8.2.4. Company D
- 8.2.1. Company A
9. GLOBAL BIOLOGICS API MARKET (BY VALUE)
- 9.1. Key Assumptions and Methodology
- 9.2. Biologics API Market: Distribution by Type of Biologic
- 9.3. Biologics API Market: Distribution by Expression System
- 9.4. Biologics API Market: Distribution by Bioreactor
- 9.5. Biologics API Market: Distribution by Scale of Operation
- 9.6. Biologics API Market: Distribution by Manufacturer
- 9.7. Biologics API Market: Distribution by Geographical Regions
10. ADC API MARKET (BY VALUE)
- 10.1. Key Assumptions and Methodology
- 10.2. ADC API Market, Till 2035
- 10.3. ADC API Market: Distribution by Expression System
- 10.4. ADC API Market: Distribution by Bioreactor
- 10.5. ADC API Market: Distribution by Scale of Operation
- 10.6. ADC API Market: Distribution by Manufacturer
- 10.7. ADC API Market: Distribution by Geographical Regions
11. GENE THERAPY API MARKET (BY VALUE)
- 11.1. Key Assumptions and Methodology
- 11.2. Gene Therapy API Market, Till 2035
- 11.3. Gene Therapy API Market: Distribution by Expression System
- 11.4. Gene Therapy API Market: Distribution by Bioreactor
- 11.5. Gene Therapy API Market: Distribution by Scale of Operation
- 11.6. Gene Therapy API Market: Distribution by Manufacturer
- 11.7. Gene Therapy API Market: Distribution by Geographical Regions
12. MONOCLONAL ANTIBODY API MARKET (BY VALUE)
- 12.1. Key Assumptions and Methodology
- 12.2. Monoclonal Antibody API Market, Till 2035
- 12.3. Monoclonal Antibody API Market: Distribution by Expression System
- 12.4. Monoclonal Antibody API Market: Distribution by Bioreactor
- 12.5. Monoclonal Antibody API Market: Distribution by Scale of Operation
- 12.6. Monoclonal Antibody API Market: Distribution by Manufacturer
- 12.7. Monoclonal Antibody API Market: Distribution by Geographical Regions
13. BIOSIMILAR API MARKET (BY VALUE)
- 13.1. Key Assumptions and Methodology
- 13.2. Biosimilar API Market, Till 2035
- 13.3. Biosimilar API Market: Distribution by Expression System
- 13.4. Biosimilar API Market: Distribution by Bioreactor
- 13.5. Biosimilar API Market: Distribution by Scale of Operation
- 13.6. Biosimilar API Market: Distribution by Manufacturer
- 13.7. Biosimilar API Market: Distribution by Modality
- 13.8. Biosimilar API Market: Distribution by Geographical Regions
14. VACCINE API MARKET (BY VALUE)
- 14.1. Key Assumptions and Methodology
- 14.2. Vaccine API Market, Till 2035
- 14.3. Vaccine API Market: Distribution by Expression System
- 14.4. Vaccine API Market: Distribution by Bioreactor
- 14.5. Vaccine API Market: Distribution by Scale of Operation
- 14.6. Vaccine API Market: Distribution by Manufacturer
- 14.7. Vaccine API Market: Distribution by Geographical Regions
15. BISPECIFIC ANTIBODY API MARKET (BY VALUE)
- 15.1. Key Assumptions and Methodology
- 15.2. Bispecific Antibody API Market, Till 2035
- 15.3. Bispecific Antibody API Market: Distribution by Expression System
- 15.4. Bispecific Antibody API Market: Distribution by Bioreactor
- 15.5. Bispecific Antibody API Market: Distribution by Scale of Operation
- 15.6. Bispecific Antibody API Market: Distribution by Manufacturer
- 15.7. Bispecific Antibody API Market: Distribution by Geographical Regions
16. mRNA THERAPEUTICS API MARKET (BY VALUE)
- 16.1. Key Assumptions and Methodology
- 16.2. mRNA Therapeutics API Market, Till 2035
- 16.3. mRNA Therapeutics API Market: Distribution by Bioreactor
- 16.4. mRNA Therapeutics API Market: Distribution by Scale of Operation
- 16.5. mRNA Therapeutics API Market: Distribution by Manufacturer
- 16.6. mRNA Therapeutics API Market: Distribution by Geographical Regions
17. PROTEIN / PEPTIDE THERAPEUTICS API MARKET (BY VALUE)
- 17.1. Key Assumptions and Methodology
- 17.2. Protein / Peptide Therapeutics API Market, Till 2035
- 17.3. Protein / Peptide Therapeutics API Market: Distribution by Expression System
- 17.4. Protein / Peptide Therapeutics API Market: Distribution by Bioreactor
- 17.5. Protein / Peptide Therapeutics API Market: Distribution by Scale of Operation
- 17.6. Protein / Peptide Therapeutics API Market: Distribution by Manufacturer
- 17.7. Protein / Peptide Therapeutics API Market: Distribution by Geographical Region
18. CELL THERAPY API MARKET (BY VALUE)
- 18.1. Key Assumptions and Methodology
- 18.2. Cell Therapy API Market, Till 2035
- 18.3. Cell Therapy API Market: Distribution by Expression System
- 18.4. Cell Therapy API Market: Distribution by Bioreactor
- 18.5. Cell Therapy API Market: Distribution by Scale of Operation
- 18.6. Cell Therapy API Market: Distribution by Manufacturer
- 18.7. Cell Therapy API Market: Distribution by Type of Cell Therapy
- 18.8. Cell Therapy API Market: Distribution by Geographical Regions
19. GLOBAL BIOLOGICS API MARKET (BY VOLUME)
- 19.1. Key Assumptions and Methodology
- 19.2. Biologics API Market: Distribution by Type of Biologic
- 19.3. Biologics API Market for Monoclonal Antibodies
- 19.4. Biologics API Market for Protein / Peptide Therapeutics
- 19.5. Biologics API Market for Biosimilars
- 19.6. Biologics API Market for ADCs
- 19.7. Biologics API Market for Bispecific Antibodies
- 19.8. Biologics API Market for mRNA Therapeutics
- 19.9. Biologics API Market for Cell Therapies
- 19.10.Biologics API Market for Gene Therapies
20. GENE THERAPY API MARKET (BY VOLUME)
- 20.1. Key Assumptions and Methodology
- 20.2. Gene Therapy API Market, Forecasted Estimates (till 2035)
- 20.3. Gene Therapy API Market: Distribution by Expression System
- 20.4. Gene Therapy API Market: Distribution by Bioreactor
- 20.5. Gene Therapy API Market: Distribution by Scale of Operation
- 20.6. Gene Therapy API Market: Distribution by Manufacturer
- 20.7. Gene Therapy API Market: Distribution by Geographical Regions
21. CELL THERAPY API MARKET (BY VOLUME)
- 21.1. Key Assumptions and Methodology
- 21.2. Cell Therapy API Market, Forecasted Estimates (till 2035)
- 21.3. Cell Therapy API Market: Distribution by Expression System
- 21.4. Cell Therapy API Market: Distribution by Bioreactor
- 21.5. Cell Therapy API Market: Distribution by Scale of Operation
- 21.6. Cell Therapy API Market: Distribution by Manufacturer
- 21.7. Cell Therapy API Market: Distribution by Geographical Regions
22. DATA TRIANGULATION AND VALIDATION (BY VALUE AND VOLUME)
23. CONCLUDING REMARKS'
List of Figures
- Figure 2.1 Research Methodology: Project Methodology
- Figure 2.2 Research Methodology: Data Sources for Secondary Research
- Figure 2.3 Research Methodology: Robust Quality Control
- Figure 3.1 Market Dynamics: Forecast Methodology
- Figure 3.2 Market Dynamics: Market Assessment Framework
- Figure 3.3 Market Dynamics: Example List of Parameters
- Figure 4.1 Historical Analysis of Past Recessions and Lessons Learnt
- Figure 5.2 Executive Summary: Market Forecast and Opportunity Analysis
- Figure 6.1 Biologics API Market: Distribution by Type of Modality
- Figure 6.2 Biologics API Market: Distribution by Expression System
- Figure 6.3 Biologics API Market: Distribution by Bioreactor
- Figure 6.4 Biologics API Market: Distribution by Scale of Operation
- Figure 6.5 Biologics API Market: Distribution by Manufacturer
- Figure 6.6 Biologics API Market: Distribution by Geographical Regions
- Figure 7.1 ADC API Market, Forecasted Estimates (till 2035) (USD Billion)
- Figure 7.2 ADC API Market: Distribution by Expression System
- Figure 7.3 ADC API Market: Distribution by Bioreactor
- Figure 7.4 ADC API Market: Distribution by Scale of Operation
- Figure 7.5 ADC API Market: Distribution by Manufacturer
- Figure 7.6 ADC API Market: Distribution by Geographical Regions
- Figure 8.1 Gene Therapy API Market, Forecasted Estimates (till 2035) (USD Billion)
- Figure 8.2 Gene Therapy API Market: Distribution by Expression System
- Figure 8.3 Gene Therapy API Market: Distribution by Bioreactor
- Figure 8.4 Gene Therapy API Market: Distribution by Scale of Operation
- Figure 8.5 Gene Therapy API Market: Distribution by Manufacturer
- Figure 8.6 Gene Therapy API Market: Distribution by Geographical Regions
- Figure 9.1 Monoclonal Antibody API Market, Forecasted Estimates (till 2035) (USD Billion)
- Figure 9.2 Monoclonal Antibody API Market: Distribution by Expression System
- Figure 9.3 Monoclonal Antibody API Market: Distribution by Bioreactor
- Figure 9.4 Monoclonal Antibody API Market: Distribution by Scale of Operation
- Figure 9.5 Monoclonal Antibody API Market: Distribution by Manufacturer
- Figure 9.6 Monoclonal Antibody API Market: Distribution by Geographical Regions
- Figure 10.1 Biosimilar API Market, Forecasted Estimates (till 2035) (USD Billion)
- Figure 10.2 Biosimilar API Market: Distribution by Expression System
- Figure 10.3 Biosimilar API Market: Distribution by Bioreactor
- Figure 10.4 Biosimilar API Market: Distribution by Scale of Operation
- Figure 10.5 Biosimilar API Market: Distribution by Manufacturer
- Figure 10.6 Biosimilar API Market: Distribution by Modality
- Figure 10.7 Biosimilar API Market: Distribution by Geographical Regions
- Figure 11.1 Vaccine API Market, Forecasted Estimates (till 2035) (USD Billion)
- Figure 11.2 Vaccine API Market: Distribution by Expression System
- Figure 11.3 Vaccine API Market: Distribution by Bioreactor
- Figure 11.4 Vaccine API Market: Distribution by Scale of Operation
- Figure 11.5 Vaccine API Market: Distribution by Manufacturer
- Figure 11.6 Vaccine API Market: Distribution by Geographical Regions
- Figure 12.1 Bispecific Antibody API Market, Forecasted Estimates (till 2035) (USD Billion)
- Figure 12.2 Bispecific Antibody API Market: Distribution by Expression System
- Figure 12.3 Bispecific Antibody API Market: Distribution by Bioreactor
- Figure 12.4 Bispecific Antibody API Market: Distribution by Scale of Operation
- Figure 12.5 Bispecific Antibody API Market: Distribution by Manufacturer
- Figure 12.6 Bispecific Antibody API Market: Distribution by Geographical Regions
- Figure 13.1 mRNA Therapeutics API Market, Forecasted Estimates (till 2035) (USD Billion)
- Figure 13.2 mRNA Therapeutics API Market: Distribution by Bioreactor
- Figure 13.3 mRNA Therapeutics API Market: Distribution by Scale of Operation
- Figure 13.4 mRNA Therapeutics API Market: Distribution by Manufacturer
- Figure 13.5 mRNA Therapeutics API Market: Distribution by Geographical Regions
- Figure 14.1 Protein / Peptide Therapeutics API Market, Forecasted Estimates (till 2035) (USD Billion)
- Figure 14.2 Protein / Peptide Therapeutics API Market: Distribution by Expression System
- Figure 14.3 Protein / Peptide Therapeutics API Market: Distribution by Bioreactor
- Figure 14.4 Protein / Peptide Therapeutics API Market: Distribution by Scale of Operation
- Figure 14.5 Protein / Peptide Therapeutics API Market: Distribution by Manufacturer
- Figure 14.6 Protein / Peptide Therapeutics API Market: Distribution by Geographical Regions
- Figure 15.1 Cell Therapy API Market, Forecasted Estimates (till 2035) (USD Billion)
- Figure 15.2 Cell Therapy API Market: Distribution by Expression System
- Figure 15.3 Cell Therapy API Market: Distribution by Bioreactor
- Figure 15.4 Cell Therapy API Market: Distribution by Scale of Operation
- Figure 15.5 Cell Therapy API Market: Distribution by Manufacturer
- Figure 15.6 Cell Therapy API Market: Distribution by Cell Therapy
- Figure 15.7 Cell Therapy API Market: Distribution by Geographical Regions
- Figure 16.1 Biologics API Market (by Volume): Distribution by Type of Biologic
- Figure 16.2 Biologics API Market for Monoclonal Antibodies (Million Liters)
- Figure 16.3 Biologics API Market for Protein / Peptide Therapeutics (Million Liters)
- Figure 16.4 Biologics API Market for Biosimilars (Million Liters)
- Figure 16.5 Biologics API Market for ADCs (Million Liters)
- Figure 16.6 Biologics API Market for Bispecific Antibodies (Million Liters)
- Figure 16.7 Biologics API Market for mRNA Therapeutics (Million Liters)
- Figure 16.8 Biologics API Market for Cell Therapies (10^6 Cells)
- Figure 16.9 Biologics API Market for Gene Therapies (Liters)
- Figure 17.1 Gene Therapy API Market (by Volume), Forecasted Estimates (till 2035) (Liters)
- Figure 17.2 Gene Therapy API Market (by Volume): Distribution by Expression System
- Figure 17.3 Gene Therapy API Market (by Volume): Distribution by Bioreactor
- Figure 17.4 Gene Therapy API Market (by Volume): Distribution by Scale of Operation
- Figure 17.5 Gene Therapy API Market (by Volume): Distribution by Manufacturer
- Figure 17.6 Gene Therapy API Market (by Volume): Distribution by Geographical Regions
- Figure 18.1 Cell Therapy API Market (by Volume), Forecasted Estimates (till 2035) (10^6 Cells)
- Figure 18.2 Cell Therapy API Market (by Volume): Distribution by Expression System
- Figure 18.3 Cell Therapy API Market (by Volume): Distribution by Bioreactor
- Figure 18.4 Cell Therapy API Market (by Volume): Distribution by Scale of Operation
- Figure 18.5 Cell Therapy API Market (by Volume): Distribution by Manufacturer
- Figure 18.6 Cell Therapy API Market (by Volume): Distribution by Geographical Regions

