
PUBLISHER: Roots Analysis | PRODUCT CODE: 2072252

PUBLISHER: Roots Analysis | PRODUCT CODE: 2072252
Liquid Biopsy Market (5th Edition) by Type of Technology, Type of Sample, Type of Circulating Biomarker, Type of Cancer, Application, End-user and Geographical Regions - Trends and Global Forecasts, 2026-2035
Liquid Biopsy Market: Overview
As per Roots Analysis, the liquid biopsy market is estimated to grow from USD 9.49 billion in the current year to USD 33.45 billion by 2035, at a CAGR of 15.0% during the forecast period, till 2035.
Liquid Biopsy Market: Growth and Trends
Tissue biopsy has long been regarded by experts as the gold standard for cancer diagnosis. However, the inherent limitations of this invasive procedure, including patient discomfort, pain, and the risk of complications have constrained its broader acceptance. In response, ongoing research and technological advancements have led to the emergence of liquid biopsy as a credible alternative for cancer detection.
Liquid biopsy technologies provide a minimally invasive and highly accessible approach to early cancer detection and disease monitoring. These assays analyze blood samples or other bodily fluids, such as urine or plasma, to detect genetic alterations and circulating biomarkers, including circulating tumor DNA (ctDNA), cell-free DNA (cfDNA), and extracellular vesicles. As a result, these non-invasive diagnostic solutions are increasingly transforming cancer care, particularly for patients with advanced-stage disease.
The liquid biopsy market is experiencing robust growth and remains highly dynamic, driven by significant investments in research and development by numerous industry players. These investments are leveraging ongoing scientific advancements, positioning liquid biopsy at the forefront of innovation in oncology diagnostics. With continued progress in this field, the adoption of liquid biopsy and other non-invasive diagnostic technologies is expected to expand substantially, thereby driving market growth over the forecast period.
Growth Drivers: Strategic Enablers of Market Expansion
Technological advancements have played a pivotal role in strengthening the clinical utility of liquid biopsy. Breakthroughs in next-generation sequencing (NGS) and digital PCR technologies have significantly enhanced the sensitivity and specificity of these assays, enabling the detection of extremely low concentrations of circulating tumor DNA (ctDNA) and circulating tumor cells (CTCs). As a result, clinicians can now identify actionable genomic alterations that were previously undetectable without relying on traditional solid tissue biopsies.
In addition, the integration of artificial intelligence (AI) and advanced bioinformatics tools has further transformed the interpretation of complex liquid biopsy data. Machine learning algorithms improve the signal-to-noise ratio, facilitating more precise identification of genetic and epigenetic patterns. This computational support not only reduces the likelihood of false positives but also accelerates clinical decision-making, enhancing overall diagnostic efficiency. Further, the growing demand for real-time treatment monitoring is reinforcing the adoption of liquid biopsy in oncology practice. By providing a dynamic genomic snapshot of the disease, liquid biopsy enables oncologists to track therapeutic response and detect emerging resistance mutations at an early stage. This allows for timely adjustments to treatment strategies, ultimately contributing to improved patient outcomes.
Market Challenges: Critical Barriers Impeding Progress
Despite significant progress in liquid biopsy technologies, several challenges continue to impede broader market adoption. One of the primary constraints is the substantial capital investment required for research and development. The high costs associated with advancing and validating novel diagnostic solutions often limit participation by smaller companies and can delay the commercialization of innovative technologies.
In addition to financial barriers, complexities related to data integration and interpretation present ongoing challenges. The large volumes of data generated through next-generation sequencing (NGS) necessitate robust bioinformatics infrastructure and expertise. Furthermore, the absence of standardized protocols for data analysis and clinical interpretation of genetic variants can result in inconsistencies in reporting. These limitations collectively hinder the seamless integration of liquid biopsy into routine clinical practice and slow its widespread adoption.
Liquid Biopsy Market: Key Insights
The report delves into the current state of the liquid biopsy market and identifies potential growth opportunities within industry. Some key findings from the report include:
- Close to 340 liquid biopsy solutions are either commercialized or being developed by various stakeholders in order to cater to the rising demand for early cancer detection solutions, across the globe.
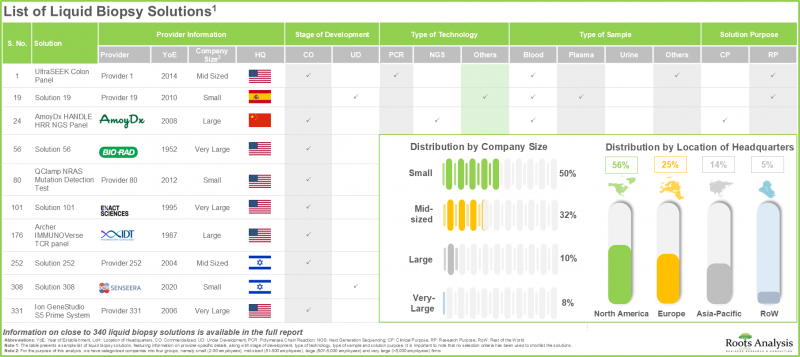
- Around 90% of liquid biopsy solutions comprise of assay kits; of these, ~35% have employed polymerase chain reaction technique for the detection of various cancer indications.
- The maximum number of collaborations were signed by the players based in North America; notably, more than 65% of the agreements were intracontinental deals, followed by intercontinental deals (~35%).
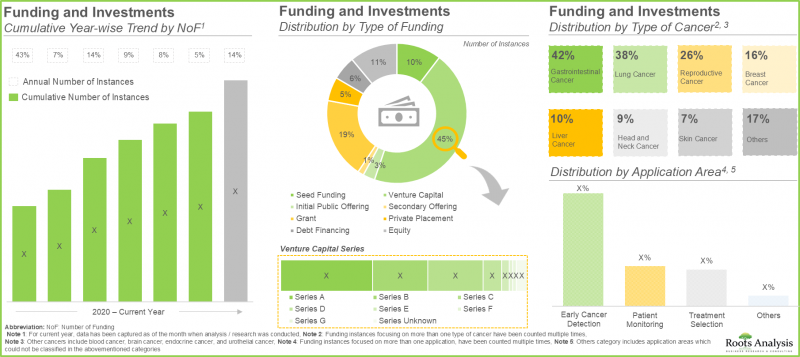
- Over the years, the overall funding activity has increased at a CAGR of 13.8%; majority (45%) of the instances were related to venture capital.
- Several big pharmaceutical companies have marked their presence in this domain by either collaborating with liquid biopsy solution providers or by investing in this industry.
- We have analyzed close to 100 companies in liquid biopsy domain; of these, nearly 60% of the companies were identified as potential acquisition targets.
- Given the increasing demand for cancer solutions, technological advancements and supportive regulatory frameworks, the market is expected to witness a steady growth in the foreseen future.
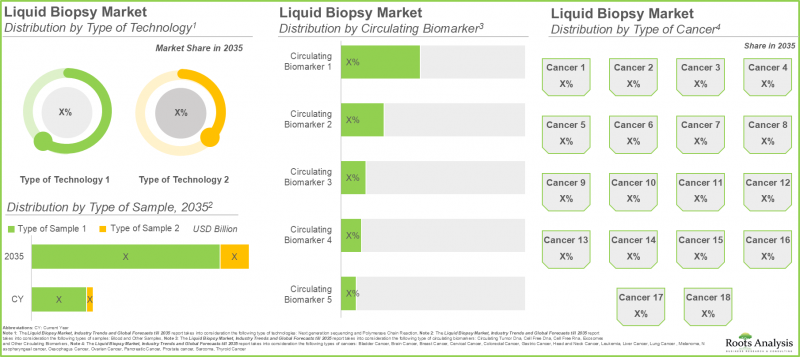
- The liquid biopsy market is likely to grow at an annualized rate (CAGR) of 15.0%, till 2035; notably, the next generation sequencing is anticipated to capture the majority share in the market by 2035.
- The liquid biopsy market in North America is expected to capture maximum share by 2035; further, majority of the liquid biopsy solutions are intended for early diagnosis of cancer.
- Driven by ongoing approvals of liquid biopsy products for various oncological disorders, the market is likely to experience notable growth in the coming years.
Liquid Biopsy Market
The market sizing and opportunity analysis has been segmented across the following parameters:
By Type of Technology
- Next-Generation Sequencing
- Polymerase Chain Reaction
By Type of Sample
- Blood
- Other Samples
By Type of Circulating Biomarker
- Circulating Tumor DNA
- Cell Free DNA
- Cell Free RNA
- Exosomes
- Other Circulating Biomarkers
By Type of Cancer
- Breast Cancer
- Colorectal Cancer
- Prostate cancer
- Lung Cancer
- Bladder Cancer
- Melanoma
- Thyroid Cancer
- Gastric Cancer
- Head and Neck Cancer
- Leukemia
- Brain Cancer
- Liver Cancer
- Cervical Cancer
- Ovarian Cancer
- Oesophagus Cancer
- Pancreatic Cancer
- Nasopharyngeal cancer
- Sarcoma
By Application Area
- Early Diagnosis
- Patient Monitoring
- Recurrence Monitoring
By End-user
- Hospitals / Laboratories
- Research Institutes
- Other End-users
By Geographical Regions
- North America
- US
- Europe
- France
- UK
- Germany
- Italy
- Spain
- Asia-Pacific
- China
- India
- Japan
- Australia
Liquid Biopsy Market: Key Segments
Which Type of Technology Accounts for the Largest Share in the Liquid Biopsy Market?
Based on the type of technology, the next-generation sequencing (NGS) segment is expected to account for approximately 53% of the total market share in the current year. This dominance is driven by its superior capability for high-throughput, multi-gene profiling, continued reductions in sequencing costs, and enhanced sensitivity in detecting rare genetic mutations, making it highly suitable for precision oncology applications. Furthermore, NGS is projected to witness robust growth at a CAGR of 17.1%, supported by the increasing demand for advanced, high-throughput diagnostic solutions in clinical oncology.
Regional Analysis: Fastest Growing Region in Liquid Biopsy Testing Domain
North America: Dominating the Market by Securing Highest Share
Regionally, North America is anticipated to maintain its leadership position, capturing nearly 55% of the global liquid biopsy market revenue in 2026. This can be attributed to the presence of a well-established pharmaceutical and biotechnology ecosystem, strong regulatory frameworks, and a high concentration of key liquid biopsy solution providers, all of which collectively drive market expansion in the region.
Which Type of Sample Accounts for the Largest Share in the Liquid Biopsy Market?
In terms of sample type, blood-based assays dominate the market, contributing approximately 89.5% of the total revenue. This is largely due to their minimally invasive nature and the widespread availability of established clinical infrastructure for blood-based biomarker analysis.
Which Type of Circulating Biomarker Accounts for the Largest Share in the Liquid Biopsy Market?
With respect to circulating biomarkers, circulating tumor DNA (ctDNA) currently holds the largest share, accounting for 44.8% of the market. Its ability to provide real-time insights into tumor dynamics throughout the patient care continuum underpins its widespread adoption. Looking ahead, the exosomes segment is expected to grow at a faster rate, with a projected CAGR of 16.5%, driven by their capacity to transport diverse molecular components and their enhanced stability across various body fluids.
Which Type of Cancer Accounts for the Largest Share in the Liquid Biopsy Market?
Based on the type of cancer, the breast cancer segment is projected to hold the largest market share at 28.8% in 2026. This is primarily due to the increasing global prevalence of breast cancer and the growing adoption of non-invasive diagnostic approaches for early detection and treatment monitoring. Additionally, nasopharyngeal cancer is anticipated to experience comparatively faster growth, supported by the high predictive value of plasma Epstein-Barr virus (EBV) DNA in monitoring treatment response and detecting minimal residual disease.
Which Application Area Accounts for the Largest Share in the Liquid Biopsy Market?
In terms of application, early diagnosis represents the largest segment, accounting for approximately 67.3% of the total market revenue. This is driven by an increasing emphasis on early cancer detection to improve clinical outcomes and reduce overall treatment costs. The segment is also expected to witness accelerated growth in the coming years, as early diagnostic capabilities enable timely interventions, improve survival rates, and facilitate personalized treatment strategies.
Which End-user Accounts for the Largest Share in the Liquid Biopsy Market?
Hospitals and laboratories constitute the leading end-user segment, capturing 75.4% of the overall market share. Their dominance is attributed to high testing volumes, availability of skilled personnel, and seamless integration with existing diagnostic workflows. This segment is also projected to grow at a steady pace, supported by ongoing investments in advanced diagnostic technologies and a rising patient population seeking comprehensive cancer screening services.
Example Players in Liquid Biopsy Market
- Amoy Diagnostics
- Biocartis
- DiaCarta
- Exact Sciences
- Gencurix
- GeneCast Biotechnology
- Integrated DNA Technologies
- Lucence
- MedGenome
- Medicover Genetics
- nRICH dx
- Precipio
- QIAGEN
- RGCC Group
- Screen Cell
- Singlera Genomics
- Thermo Fisher Scientific
Primary Research Overview
The opinions and insights presented in this study were influenced by discussions conducted with multiple stakeholders. The research report features detailed transcripts of interviews held with the following industry stakeholders:
- Director, Mid-sized Company, US
- Innovation Director, Mid-sized Company, Spain
- Founder and Chief Executive officer, Small-sized Company, India
- Founder, President and Chief Technology Officer, Small-sized Company, US
- Former Strategic Technology Advisor, Small-sized Company, Australia
- Founder and Medical Director, Small-sized Company, Germany
- Chief Executive officer, Small-sized Company, Australia
- Chief Operating Officer and Co-Founder, Small-sized Company, Canada
- Chief Medical Officer, Mid-sized Company, US
- Chairman, Small-sized Company, US
- Former Sales and Marketing Manager, Small-sized Company, Italy
- Former Marketing Director, Mid-sized Company, Belgium
- Former Founder, Small-sized Company, US
- Former Chief Executive Officer, Mid-sized Company, US
- Founder, Small-sized Company, Sweden
- Former Chief Executive Officer and Co-founder, Small-sized Company, US
- Chief Scientific Officer, Mid-sized Company, US
Liquid Biopsy Market: Research Coverage
- Market Sizing and Opportunity Analysis: The report features an in-depth analysis of the liquid biopsy market, focusing on key market segments, including [A] type of technology, [B] type of sample, [C] type of circulating biomarker, [D] type of cancer, [E] application, [F] end-user, and [G] geographical regions.
- Market Landscape: A comprehensive evaluation of liquid biopsy products, considering various parameters, such as [A] stage of development, [B] type of product, [C] type of sample, [D] type of technique, [E] type of circulating biomarker, [F] target disease indication, [G] and [H] application area. In addition, it provides a list of players engaged in manufacturing liquid biopsy products, along with the information on their [I] year of establishment, [J] company size (based on number of employees), [K] location of headquarters (region), [L] location of headquarters (country), [M] most active players (in terms of number of liquid biopsy products).
- Non-Invasive Cancer Screening and Diagnosis: An overview on the need for non-invasive cancer diagnostics and their importance; it also features different imaging techniques, screening assays and advanced approaches used for diagnosis of cancer along with their advantages and disadvantages.
- Company Profiles: In-depth profiles of key industry players manufacturing liquid biopsy products, focusing on [A] company overviews, [B] financial information (if available), [C] product portfolio, [D] recent developments and [E] an informed future outlook.
- Partnerships and Collaborations: An analysis of partnerships established in this sector, since 2020, based on several parameters, such as [A] year of partnership, [B] type of partnership, [C] type of partner, [D] type of circulating biomarker, [E] target disease indication, [F] most active players. This section also highlights the regional distribution of partnership activity in this market.
- Funding and Investment Analysis: A detailed evaluation of the investments made in the liquid biopsy domain, encompassing seed financing, venture capital, capital raised from IPOs, secondary offerings, grants / awards, other equity and debt financing, based on several parameters, such as [A] year of investment, [B] amount invested, [C] type of funding, [D] type of circulating biomarker, [E] target disease indication, [F] application area, [G] geography, [H] most active players (in terms of number of funding instances and amount invested) and [I] leading investors (in terms of number of funding instances).
- Product Competitiveness Analysis: A comprehensive competitive analysis of liquid biopsy products, examining factors, such as [A] supplier strength, [B] product competitiveness and [C] company size.
- Big Pharma Analysis: A comprehensive examination of various initiatives focused on liquid biopsy products undertaken by major pharmaceutical companies. This analysis covers various relevant parameters, such as [A] number of initiatives, [B] type of initiative, [C] stage of development, [D] type of product, [E] type of circulating biomarker, [F] target disease indication, and [G] application area.
- Key Acquisition Targets: A detailed analysis of the key acquisition targets, taking into consideration the historical trend of the acquisition activity of the players that have acquired other firms. It offers a means for other industry stakeholders to identify potential acquisition targets.
- Other Non-Invasive Cancer Diagnostics: A detailed overview of the various non invasive diagnostic tests other than liquid biopsies, being manufactured by various companies for cancer screening and early detection.
- Market Impact Analysis: The report analyzes various factors such as drivers, restraints, opportunities, and challenges affecting the market growth.
Key Questions Answered in this Report
- Which are the leading companies in the liquid biopsy market?
- Which region dominates the liquid biopsy market?
- What are the key trends observed in the liquid biopsy market?
- What factors are likely to influence the evolution of this market?
- What are the primary challenges faced by liquid biopsy solution providers?
- What is the current and future market size?
- What is the CAGR of this market?
- How is the current and future market opportunity likely to be distributed across key market segments?
Reasons to Buy this Report
- The report provides a comprehensive market analysis, offering detailed revenue projections of the overall market and its specific sub-segments. This information is valuable to both established market leaders and emerging entrants.
- The report offers stakeholders a comprehensive overview of the market, including key drivers, barriers, opportunities, and challenges. This information empowers stakeholders to stay abreast of market trends and make data-driven decisions to capitalize on growth prospects.
- The report can aid businesses in identifying future opportunities in any sector. It also helps in understanding if those opportunities are worth pursuing.
- The report helps in identifying customer demand by understanding the needs, preferences, and behavior of the target audience in order to tailor products or services effectively.
- The report equips new entrants with requisite information regarding a particular market to help them build successful business strategies.
- The report allows for more effective communication with the audience and in building strong business relations.
Additional Benefits
- Complimentary Excel Data Packs for all Analytical Modules in the Report
- 15% Free Content Customization
- Detailed Report Walkthrough Session with Research Team
- Free Updated report if the report is 6-12 months old or older
TABLE OF CONTENTS
1 PREFACE
- 1.1. Introduction
- 1.2. Report Coverage
- 1.3. Market Segmentation
- 1.4. Key Market Insights
- 1.5. Market Share Insights
- 1.6. Key Questions Answered
2 RESEARCH METHODOLOGY
- 2.1. Chapter Overview
- 2.2. Research Assumptions
- 2.2.1. Market Landscape and Market Trends
- 2.2.2. Market Forecast and Opportunity Analysis
- 2.2.3. Comparative Analysis
- 2.3. Database Building
- 2.3.1. Data Collection
- 2.3.2. Data Validation
- 2.3.3. Data Analysis
- 2.4. Project Methodology
- 2.4.1. Secondary Research
- 2.4.1.1. Annual Reports
- 2.4.1.2. Academic Research Papers
- 2.4.1.3. Company Websites
- 2.4.1.4. Investor Presentations
- 2.4.1.5. Regulatory Filings
- 2.4.1.6. White Papers
- 2.4.1.7. Industry Publications
- 2.4.1.8. Conferences and Seminars
- 2.4.1.9. Government Portals
- 2.4.1.10. Media and Press Releases
- 2.4.1.11. Newsletters
- 2.4.1.12. Industry Databases
- 2.4.1.13. Roots Proprietary Databases
- 2.4.1.14. Paid Databases and Sources
- 2.4.1.15. Social Media Portals
- 2.4.1.16. Other Secondary Sources
- 2.4.2. Primary Research
- 2.4.2.1. Types of Primary Research
- 2.4.2.1.1. Qualitative Research
- 2.4.2.1.2. Quantitative Research
- 2.4.2.1.3. Hybrid Approach
- 2.4.2.2. Advantages of Primary
- 2.4.2.3. Techniques for Primary Research
- 2.4.2.3.1. Interviews
- 2.4.2.3.2. Surveys
- 2.4.2.3.3. Focus Groups
- 2.4.2.3.4. Observational Research
- 2.4.2.3.5. Social Media Interactions
- 2.4.2.4. Key Opinion Leaders Considered in Primary Research
- 2.4.2.4.1. Company Executives (CXOs)
- 2.4.2.4.2. Board of Directors
- 2.4.2.4.3. Company Presidents and Vice Presidents
- 2.4.2.4.4. Research and Development Heads
- 2.4.2.4.5. Technical Experts
- 2.4.2.4.6. Subject Matter Experts
- 2.4.2.4.7. Scientists
- 2.4.2.4.8. Doctors and Other Healthcare Providers
- 2.4.2.5. Ethics and Integrity
- 2.4.2.5.1. Research Ethics
- 2.4.2.5.2. Data Integrity
- 2.4.2.1. Types of Primary Research
- 2.4.3. Analytical Tools and Databases
- 2.4.1. Secondary Research
- 2.5. Robust Quality Control
3 ECONOMIC AND OTHER PROJECT-SPECIFIC CONSIDERATIONS
- 3.1. Chapter Overview
- 3.2. Forecast Methodology
- 3.2.1. Top-down Approach
- 3.2.2. Bottom-up Approach
- 3.2.3. Hybrid Approach
- 3.3. Market Assessment Framework
- 3.3.1. Total Addressable Market (TAM)
- 3.3.2. Serviceable Addressable Market (SAM)
- 3.3.3. Serviceable Obtainable Market (SOM)
- 3.3.4. Currently Acquired Market (CAM)
- 3.4. Forecasting Tools and Techniques
- 3.4.1. Qualitative Forecasting
- 3.4.2. Correlation
- 3.4.3. Regression
- 3.4.4. Extrapolation
- 3.4.5. Convergence
- 3.4.6. Sensitivity Analysis
- 3.4.7. Scenario Planning
- 3.4.8. Data Visualization
- 3.4.9. Time Series Analysis
- 3.4.10. Forecast Error Analysis
- 3.5. Key Considerations
- 3.5.1. Demographics
- 3.5.2. Government Regulations
- 3.5.3. Reimbursement Scenarios
- 3.5.4. Market Access
- 3.5.5. Supply Chain
- 3.5.6. Industry Consolidation
- 3.5.7. Pandemic / Unforeseen Disruptions Impact
- 3.6. Limitations
4 MACRO-ECONOMIC INDICATORS
- 4.1. Chapter Overview
- 4.2. Market Dynamics
- 4.2.1. Time Period
- 4.2.1.1. Historical Trends
- 4.2.1.2. Current and Forecasted Estimates
- 4.2.2. Currency Coverage
- 4.2.2.1. Major Currencies Affecting the Market
- 4.2.2.2. Factors Affecting Currency Fluctuations
- 4.2.2.3. Impact of Currency Fluctuations on the Industry
- 4.2.3. Foreign Currency Exchange Rate
- 4.2.3.1. Impact of Foreign Exchange Rate Volatility on the Market
- 4.2.3.2. Strategies for Mitigating Foreign Exchange Risk
- 4.2.4. Recession
- 4.2.4.1. Assessment of Current Economic Conditions and Potential Impact on the Market
- 4.2.4.2. Historical Analysis of Past Recessions and Lessons Learnt
- 4.2.5. Inflation
- 4.2.5.1. Measurement and Analysis of Inflationary Pressures in the Economy
- 4.2.5.2. Potential Impact of Inflation on the Market Evolution
- 4.2.6. Interest Rates
- 4.2.6.1. Interest Rates and Their Impact on the Market
- 4.2.6.2. Strategies for Managing Interest Rate Risk
- 4.2.7. Commodity Flow Analysis
- 4.2.7.1. Type of Commodity
- 4.2.7.2. Origins and Destinations
- 4.2.7.3. Value and Weights
- 4.2.7.4. Modes of Transportation
- 4.2.8. Global Trade Dynamics
- 4.2.8.1. Import Scenario
- 4.2.8.2. Export Scenario
- 4.2.8.3. Trade Policies
- 4.2.8.4. Strategies for Mitigating the Risks Associated with Trade Barriers
- 4.2.8.5. Impact of Trade Barriers on the Market
- 4.2.9. War Impact Analysis
- 4.2.9.1. Russian-Ukraine War
- 4.2.9.2. Israel-Hamas War
- 4.2.10. COVID Impact / Related Factors
- 4.2.10.1. Global Economic Impact
- 4.2.10.2. Industry-specific Impact
- 4.2.10.3. Government Response and Stimulus Measures
- 4.2.10.4. Future Outlook and Adaptation Strategies
- 4.2.11. Other Indicators
- 4.2.11.1. Fiscal Policy
- 4.2.11.2. Consumer Spending
- 4.2.11.3. Gross Domestic Product (GDP)
- 4.2.11.4. Employment
- 4.2.11.5. Taxes
- 4.2.11.6. Stock Market Performance
- 4.2.11.7. Cross-Border Dynamics
- 4.2.1. Time Period
- 4.3. Conclusion
5. EXECUTIVE SUMMARY
- 5.1. Liquid Biopsy Solutions: Market Landscape
- 5.2. Liquid Biopsy Solutions: Market Trends
- 5.3. Liquid Biopsy Solutions: Market Forecast and Opportunity Analysis
6. INTRODUCTION
- 6.1. Chapter Overview
- 6.2. Cancer Statistics and Burden of the Disease
- 6.3. Importance of Early Cancer Detection
- 6.4. Cancer Screening and Diagnosis
- 6.5. Conventional Invasive Cancer Diagnostic Tests
- 6.5.1. Biopsy
- 6.5.2. Fine Needle Aspiration Biopsy
- 6.5.3. Core Needle Aspiration Biopsy
- 6.5.4. Vacuum-Assisted Biopsy
- 6.5.5. Image Guided Biopsy
- 6.5.6. Sentinel Node Biopsy
- 6.5.7. Surgical Biopsy
- 6.5.8. Endoscopic Biopsy
- 6.5.9. Bone Marrow Biopsy
- 6.5.10. Endoscopy
- 6.6. Need for Non-Invasive Approaches
- 6.7. Liquid Biopsy: Diagnosing Circulating Biomarkers
- 6.7.1. Circulating Tumor Cells
- 6.7.2. Circulating Tumor DNA / Cell Free DNA
- 6.7.3. Exosomes
- 6.8. Costs and Benefits Associated with Liquid Biopsy and Non-Invasive Tests
- 6.9. Emerging Trends in Intellectual Property Related to Non-Invasive Cancer Diagnostics
- 6.10. Challenges Associated with Non-Invasive Cancer Diagnostics
- 6.11. Future Perspectives
7. CASE-STUDY: NON-INVASIVE CANCER SCREENING AND DIAGNOSIS
- 7.1. Chapter Overview
- 7.2. Diagnostic Imaging
- 7.2.1. Magnetic Resonance Imaging (MRI)
- 7.2.2. Mammography
- 7.2.3. Bone Scan
- 7.2.4. Computerized Tomography (CT) Scan
- 7.2.5. Integrated Positron Emission Tomography (PET)- CT Scan
- 7.2.6. Ultrasound
- 7.2.7. X-ray Radiography (Barium Enema)
- 7.3. Screening Assays
- 7.3.1. Circulating Tumor Marker Test
- 7.3.2. Digital Rectal Exam (DRE)
- 7.3.3. Fecal Occult Blood Test (FOBT)
- 7.3.4. Multigated Acquisition (MUGA) Scan
- 7.3.5. Papanicolaou Test and Human Papilloma Virus Test
- 7.4. Advanced Non-Invasive Approaches
- 7.4.1. Cytogenetic / Gene Expression Studies
- 7.4.2. Molecular Signature-based Non-Invasive Methods
- 7.4.3. Saliva-based Oral Cancer Diagnostics
- 7.4.4. Vital Staining
- 7.4.5. Optical Biopsy
- 7.4.6. Other Diagnostic Techniques
8. MARKET LANDSCAPE
- 8.1. Chapter Overview
- 8.2. Liquid Biopsy Solutions: Overall Market Landscape
- 8.2.1. Analysis by Stage of Development
- 8.2.2. Analysis by Type of Solution
- 8.2.3. Analysis by Type of Technology
- 8.2.4. Analysis by Type of Sample
- 8.2.5. Analysis by Type of Circulating Biomarker
- 8.2.6. Analysis by Type of Cancer
- 8.2.7. Analysis by Solution Purpose
- 8.2.8. Analysis by Application Area
- 8.3. Liquid Biopsy Market: Overall Developer Landscape
- 8.3.1. Analysis by Year of Establishment
- 8.3.2. Analysis by Company Size
- 8.3.3. Analysis by Location of Headquarters
- 8.3.4. Analysis by Most Active Players
9. PRODUCT COMPETITIVENESS ANALYSIS
- 9.1. Chapter Overview
- 9.2. Assumptions and Key Parameters
- 9.3. Methodology
- 9.4. Overview of Peer Groups
- 9.4.1. Peer Group I: Overview of Liquid Biopsy Assay Kits
- 9.4.2. Peer Group II: Overview of Liquid Biopsy Devices
- 9.4.3. Peer Group III: Overview of Liquid Biopsy Software and Other Solutions
- 9.5. Product Competitiveness Analysis
- 9.5.1. Liquid Biopsy Assay Kits
- 9.5.1.1. Liquid Biopsy Assay Kits Offered by Providers Based in North America
- 9.5.1.2. Liquid Biopsy Assay Kits Offered by Providers Based in Europe
- 9.5.1.3. Liquid Biopsy Assay Kits Offered by Providers Based in Asia-Pacific and RoW
- 9.5.2. Liquid Biopsy Devices
- 9.5.2.1. Liquid Biopsy Assay Kits Offered by Providers Based in North America
- 9.5.2.2. Liquid Biopsy Assay Kits Offered by Providers Based in Europe
- 9.5.2.3. Liquid Biopsy Assay Kits Offered by Providers Based in Asia-Pacific and RoW
- 9.5.3. Liquid Biopsy Software and Other Solutions
- 9.5.3.1. Liquid Biopsy Software and Other Solutions Offered by Providers
- 9.5.1. Liquid Biopsy Assay Kits
10. COMPANY PROFILES: LIQUID BIOPSY SOLUTION PROVIDERS
- 10.1. Chapter Overview
- 10.2. Amoy Diagnostics
- 10.2.1. Company Overview
- 10.2.2. Liquid Biopsy Portfolio
- 10.3. BioCartis
- 10.3.1. Company Overview
- 10.3.2. Liquid Biopsy Portfolio
- 10.4. DiaCarta
- 10.4.1. Company Overview
- 10.4.2. Liquid Biopsy Portfolio
- 10.5. Exact Sciences
- 10.5.1. Company Overview
- 10.5.2. Liquid Biopsy Portfolio
- 10.6. Gencurix
- 10.6.1. Company Overview
- 10.6.2. Liquid Biopsy Portfolio
- 10.7. Genecast Biotechnology
- 10.7.1. Company Overview
- 10.7.2. Liquid Biopsy Portfolio
- 10.8. Integrated DNA Technologies
- 10.8.1. Company Overview
- 10.8.2. Liquid Biopsy Portfolio
- 10.9. Lucence Diagnostics
- 10.9.1. Company Overview
- 10.9.2. Liquid Biopsy Portfolio
- 10.10. MedGenome
- 10.10.1. Company Overview
- 10.10.2. Liquid Biopsy Portfolio
- 10.11. Medicover Genetics
- 10.11.1. Company Overview
- 10.11.2. Liquid Biopsy Portfolio
- 10.12. nRichDx
- 10.12.1. Company Overview
- 10.12.2. Liquid Biopsy Portfolio
- 10.13. Precipio
- 10.13.1. Company Overview
- 10.13.2. Liquid Biopsy Portfolio
- 10.14. Qiagen
- 10.14.1. Company Overview
- 10.14.2. Liquid Biopsy Portfolio
- 10.15. RGCC
- 10.15.1. Company Overview
- 10.15.2. Liquid Biopsy Portfolio
- 10.16. ScreenCell
- 10.16.1. Company Overview
- 10.16.2. Liquid Biopsy Portfolio
- 10.17. Singlera Genomics
- 10.17.1. Company Overview
- 10.17.2. Liquid Biopsy Portfolio
- 10.18. Thermo Fisher Scientific
- 10.18.1. Company Overview
- 10.18.2. Liquid Biopsy Portfolio
11 PARTNERSHIPS AND COLLABORATIONS
- 11.1. Chapter Overview
- 11.2. Partnership Models
- 11.3. Liquid Biopsy Solutions: Partnerships and Collaborations
- 11.3.1. Analysis by Year of Partnership
- 11.3.2. Analysis by Type of Partnership
- 11.3.3. Analysis by Year and Type of Partnership
- 11.3.4. Analysis by Type of Partner
- 11.3.5. Analysis by Type of Circulating Biomarker
- 11.3.6. Analysis by Type of Cancer
- 11.3.7. Most Active Players: Analysis by Number of Partnerships
- 11.3.8. Analysis by Geography
- 11.3.8.1. Local and International Agreements
- 11.3.8.2. Intercontinental and Intracontinental Agreements
12 FUNDING AND INVESTMENTS
- 12.1. Chapter Overview
- 12.2. Funding Models
- 12.3. Liquid Biopsy Solutions: Funding and Investments
- 12.3.1. Analysis by Year of Funding
- 12.3.1.1. Cumulative Year-wise Trend of Funding Instances
- 12.3.1.2. Cumulative Year-wise Trend of Amount Invested
- 12.3.2. Analysis by Type of Funding
- 12.3.2.1. Analysis by Funding Instances
- 12.3.2.2. Analysis of Amount Invested by Year and Type of Funding
- 12.3.3. Analysis by Year and Type of Funding
- 12.3.4. Analysis by Type of Circulating Biomarker
- 12.3.5. Analysis by Type of Cancer
- 12.3.6. Analysis by Application Area
- 12.3.7. Most Active Players: Analysis by Number of Funding Instances
- 12.3.8. Most Active Players: Analysis by Amount Raised
- 12.3.9. Leading Investors by Number of Funding Instances
- 12.3.10. Analysis by Geography
- 12.3.1. Analysis by Year of Funding
13 BIG PHARMA INITIATIVES
- 13.1. Chapter Overview
- 13.2. Liquid Biopsy: List of Initiatives Undertaken by Big Players
- 13.2.1. Analysis by Year of Initiative
- 13.2.2. Analysis by Type of Initiative
- 13.2.3. Analysis by Year and Type of Initiative
- 13.2.4. Analysis of Big Pharma Players by Number of Initiatives
- 13.2.5. Analysis by Type of Partnership
- 13.2.6. Analysis of Big Pharma Player by Type of Initiative
- 13.2.7. Analysis of Big Pharma Player by Year of Initiative
- 13.2.8. Big Pharma Initiatives Summary
14 KEY ACQUISITION TARGETS
- 14.1. Chapter Overview
- 14.2. Scope and Methodology
- 14.3. Scoring Criteria and Key Assumptions
- 14.4. Potential Acquisition Targets: Liquid Biopsy Solution Providers
- 14.5. Concluding Remarks
15 CASE STUDY: OTHER NON-INVASIVE CANCER DIAGNOSTICS
- 15.1. Chapter Overview
- 15.2. Non-Blood-based Biomarker Detection Tests
- 15.3. Fecal Occult Blood Test (FOBT) and Fecal Immunochemical Tests (FIT)
- 15.4. Pigmented Lesion Assays
- 15.5. Stool DNA (sDNA)-based Tests
- 15.6. Volatile Organic Compound (VOC) Detection Tests
- 15.7. List of Other Non-Invasive Cancer Diagnostics
16 MARKET IMPACT ANALYSIS
- 16.1. Chapter Overview
- 16.2. Market Drivers
- 16.3. Market Restraints
- 16.4. Market Opportunities
- 16.5. Market Challenges
- 16.6. Conclusion
17 GLOBAL LIQUID BIOPSY MARKET
- 17.1. Chapter Overview
- 17.2. Assumptions and Methodology
- 17.3. Global Liquid Biopsy Market, Historical Trends (Since 2021) and Forecasted Estimates (Till 2035)
- 17.3.1. Scenario Analysis
- 17.3.1.1. Conservative Scenario
- 17.3.1.2. Optimistic Scenario
- 17.3.1. Scenario Analysis
- 17.4. Key Market Segmentations
18 LIQUID BIOPSY MARKET, BY TYPE OF TECHNOLOGY
- 18.1. Chapter Overview
- 18.2. Key Assumptions and Methodology
- 18.3. Liquid Biopsy Market: Distribution By Type of Technology
- 18.3.1. Liquid Biopsy Market for Next Generation Sequencing, Historical Trends (Since 2021) and Forecasted Estimates (Till 2035)
- 18.3.2. Liquid Biopsy Market for Polymerase Chain Reaction, Historical Trends (Since 2021) and Forecasted Estimates (Till 2035)
- 18.4. Data Triangulation and Validation
19 LIQUID BIOPSY MARKET, BY TYPE OF SAMPLE
- 19.1. Chapter Overview
- 19.2. Key Assumptions and Methodology
- 19.3. Liquid Biopsy Market: Distribution By Type of Sample
- 19.3.1. Liquid Biopsy Market for Blood, Historical Trends (Since 2021) and Forecasted Estimates (Till 2035)
- 19.3.2. Liquid Biopsy Market for Other Samples, Historical Trends (Since 2021) and Forecasted Estimates (Till 2035)
- 19.4. Data Triangulation and Validation
20 LIQUID BIOPSY MARKET, BY TYPE OF CIRCULATING BIOMARKER
- 20.1. Chapter Overview
- 20.2. Key Assumptions and Methodology
- 20.3. Liquid Biopsy Market: Distribution By Type of Circulating Biomarker
- 20.3.1. Liquid Biopsy Market for Circulating Tumor DNA, Historical Trends (Since 2021) and Forecasted Estimates (Till 2035)
- 20.3.2. Liquid Biopsy Market for Cell Free DNA, Historical Trends (Since 2021) and Forecasted Estimates (Till 2035)
- 20.3.3. Liquid Biopsy Market for Cell Free RNA, Historical Trends (Since 2021) and Forecasted Estimates (Till 2035)
- 20.3.4. Liquid Biopsy Market for Exosomes, Historical Trends (Since 2021) and Forecasted Estimates (Till 2035)
- 20.3.5. Liquid Biopsy Market for Other Circulating Biomarkers, Historical Trends (Since 2021) and Forecasted Estimates (Till 2035)
- 20.4. Data Triangulation and Validation
21 LIQUID BIOPSY MARKET, BY TYPE OF CANCER
- 21.1. Chapter Overview
- 21.2. Key Assumptions and Methodology
- 21.3. Liquid Biopsy Market: Distribution By Type of Cancer
- 21.3.1. Liquid Biopsy Market for Breast Cancer, Historical Trends (Since 2021) and Forecasted Estimates (Till 2035)
- 21.3.2. Liquid Biopsy Market for Colorectal Cancer, Historical Trends (Since 2021) and Forecasted Estimates (Till 2035)
- 21.3.3. Liquid Biopsy Market for Prostate cancer, Historical Trends (Since 2021) and Forecasted Estimates (Till 2035)
- 21.3.4. Liquid Biopsy Market for Lung Cancer, Historical Trends (Since 2021) and Forecasted Estimates (Till 2035)
- 21.3.5. Liquid Biopsy Market for Bladder Cancer, Historical Trends (Since 2021) and Forecasted Estimates (Till 2035)
- 21.3.6. Liquid Biopsy Market for Melanoma, Historical Trends (Since 2021) and Forecasted Estimates (Till 2035)
- 21.3.7. Liquid Biopsy Market for Thyroid Cancer, Historical Trends (Since 2021) and Forecasted Estimates (Till 2035)
- 21.3.8. Liquid Biopsy Market for Gastric Cancer, Historical Trends (Since 2021) and Forecasted Estimates (Till 2035)
- 21.3.9. Liquid Biopsy Market for Head and Neck Cancer, Historical Trends (Since 2021) and Forecasted Estimates (Till 2035)
- 21.3.10. Liquid Biopsy Market for Leukemia, Historical Trends (Since 2021) and Forecasted Estimates (Till 2035)
- 21.3.11. Liquid Biopsy Market for Brain Cancer, Historical Trends (Since 2021) and Forecasted Estimates (Till 2035)
- 21.3.12. Liquid Biopsy Market for Liver Cancer, Historical Trends (Since 2021) and Forecasted Estimates (Till 2035)
- 21.3.13. Liquid Biopsy Market for Cervical Cancer, Historical Trends (Since 2021) and Forecasted Estimates (Till 2035)
- 21.3.14. Liquid Biopsy Market for Ovarian Cancer, Historical Trends (Since 2021) and Forecasted Estimates (Till 2035)
- 21.3.15. Liquid Biopsy Market for Oesophagus Cancer, Historical Trends (Since 2021) and Forecasted Estimates (Till 2035)
- 21.3.16. Liquid Biopsy Market for Pancreatic Cancer, Historical Trends (Since 2021) and Forecasted Estimates (Till 2035)
- 21.3.17. Liquid Biopsy Market for Nasopharyngeal cancer, Historical Trends (Since 2021) and Forecasted Estimates (Till 2035)
- 21.3.18. Liquid Biopsy Market for Sarcoma, Historical Trends (Since 2021) and Forecasted Estimates (Till 2035)
- 21.4. Data Triangulation and Validation
22 LIQUID BIOPSY MARKET, BY APPLICATION AREA
- 22.1. Chapter Overview
- 22.2. Key Assumptions and Methodology
- 22.3. Liquid Biopsy Market: Distribution By Application Area
- 22.3.1. Liquid Biopsy Market for Early Diagnosis, Historical Trends (Since 2021) and Forecasted Estimates (Till 2035)
- 22.3.2. Liquid Biopsy Market for Patient Monitoring, Historical Trends (Since 2021) and Forecasted Estimates (Till 2035)
- 22.3.3. Liquid Biopsy Market for Recurrence Monitoring, Historical Trends (Since 2021) and Forecasted Estimates (Till 2035)
- 22.4. Data Triangulation and Validation
23 LIQUID BIOPSY MARKET, BY END-USER
- 23.1. Chapter Overview
- 23.2. Key Assumptions and Methodology
- 23.3. Liquid Biopsy Market: Distribution By End-user
- 23.3.1. Liquid Biopsy Market for Hospitals / Laboratories, Historical Trends (Since 2021) and Forecasted Estimates (Till 2035)
- 23.3.2. Liquid Biopsy Market for Research Institutes, Historical Trends (Since 2021) and Forecasted Estimates (Till 2035)
- 23.3.3. Liquid Biopsy Market for Other End-users, Historical Trends (Since 2021) and Forecasted Estimates (Till 2035)
- 23.4. Data Triangulation and Validation
24 LIQUID BIOPSY MARKET, BY GEOGRAPHICAL REGIONS
- 24.1. Chapter Overview
- 24.2. Key Assumptions and Methodology
- 24.3. Liquid Biopsy Market: Distribution By Geographical Regions
- 24.3.1. Liquid Biopsy Market for North America, Historical Trends (Since 2021) and Forecasted Estimates (Till 2035)
- 24.3.3.1 Liquid Biopsy Market in the US, Historical Trends (Since 2021) and Forecasted Estimates (Till 2035)
- 24.3.2. Liquid Biopsy Market for Europe, Historical Trends (Since 2021) and Forecasted Estimates (Till 2035)
- 24.3.2.1 Liquid Biopsy Market in the France, Historical Trends (Since 2021) and Forecasted Estimates (Till 2035)
- 24.3.2.2 Liquid Biopsy Market in the UK, Historical Trends (Since 2021) and Forecasted Estimates (Till 2035)
- 24.3.2.3 Liquid Biopsy Market in the Germany, Historical Trends (Since 2021) and Forecasted Estimates (Till 2035)
- 24.3.2.4 Liquid Biopsy Market in the Italy, Historical Trends (Since 2021) and Forecasted Estimates (Till 2035)
- 24.3.2.5 Liquid Biopsy Market in the Spain, Historical Trends (Since 2021) and Forecasted Estimates (Till 2035)
- 24.3.3. Liquid Biopsy Market for Asia-Pacific, Historical Trends (Since 2021) and Forecasted Estimates (Till 2035)
- 24.3.3.1 Liquid Biopsy Market in the China, Historical Trends (Since 2021) and Forecasted Estimates (Till 2035)
- 24.3.3.2 Liquid Biopsy Market in the India, Historical Trends (Since 2021) and Forecasted Estimates (Till 2035)
- 24.3.3.3 Liquid Biopsy Market in the Japan, Historical Trends (Since 2021) and Forecasted Estimates (Till 2035)
- 24.3.3.4 Liquid Biopsy Market in the Australia, Historical Trends (Since 2021) and Forecasted Estimates (Till 2035)
- 24.3.1. Liquid Biopsy Market for North America, Historical Trends (Since 2021) and Forecasted Estimates (Till 2035)
- 24.4. Market Dynamics Assessment
- 24.4.1. Market Movement Analysis
- 24.4.2. Penetration-Growth (P-G) Matrix
- 24.5. Data Triangulation and Validation
25 CONCLUDING REMARKS
- 25.1 Chapter Overview
26 EXECUTIVE INSIGHTS
- 26.1. Chapter Overview
- 26.2. Company A
- 26.2.1. Interview Transcript: Director
- 26.3. Company B
- 26.3.1. Interview Transcript: Innovation Director
- 26.4. Company C
- 26.4.1. Interview Transcript: Founder & Chief Executive Officer
- 26.5. Company D
- 26.5.1. Interview Transcript: President and Chief Technology Officer
- 26.6. Company E
- 26.6.1. Interview Transcript: Strategic Technology Advisor
- 26.7. Company F
- 26.7.1. Interview Transcript: Founder And Medical Director
- 26.8. Company G
- 26.8.1. Interview Transcript: Chief Executive Officer
- 26.9. Company H
- 26.9.1. Interview Transcript: Chief Operating Officer
- 26.10. Company I
- 26.10.1. Interview Transcript: Chief Medical Officer
- 26.11. Company J
- 26.11.1. Interview Transcript: President and Chief Executive Officer
- 26.12. Company K
- 26.12.1. Interview Transcript: Sales and Marketing Manager
- 26.13. Company L
- 26.13.1. Interview Transcript: Marketing Director
- 26.14. Company M
- 26.14.1. Interview Transcript: Founder
- 26.15. Company N
- 26.15.1. Interview Transcript: Chief Executive Officer
- 26.16. Company O
- 26.16.1. Interview Transcript: Chief Scientific Officer
- 26.17. Company P
- 26.17.1. Interview Transcript: Chief Executive Officer and Co-founder
- 26.18. Company Q
- 26.18.1. Interview Transcript: Chief Scientific Officer
27 APPENDIX 1: TABULATED DATA
28 APPENDIX 2: LIST OF COMPANIES AND ORGANIZATIONS
List of Tables
- Table 6.1 Survival on Early Diagnosis of Cancer
- Table 6.2 Cost of Biopsy for Different Cancer Indications (USD)
- Table 6.3 Common Conventional Endoscopic Procedures
- Table 7.1 Examples of Tumor Markers
- Table 8.1 Liquid Biopsy Solutions: Information on Stage of Development and Type of Solution
- Table 8.2 Liquid Biopsy Solutions: Information on Type of Technology and Type of Sample
- Table 8.3 Liquid Biopsy Solutions: Information on Type of Circulating Biomarker, Type of Cancer
- Table 8.4 Liquid Biopsy Solutions: Information on Solution Purpose and Application Area
- Table 8.5 Liquid Biopsy Solutions: Information on Year of Establishment, Company Size and Location of Headquarters
- Table 9.1 Product Competitiveness Scores Allotted to Liquid Biopsy Assay Kits Offered by Providers based in North America
- Table 9.2 Product Competitiveness Scores Allotted to Liquid Biopsy Assay Kits Offered by Providers based in Europe
- Table 9.3 Product Competitiveness Scores Allotted to Liquid Biopsy Assay Kits Offered by Providers based in Asia- Pacific and RoW
- Table 9.4 Product Competitiveness Scores Allotted to Liquid Biopsy Devices Offered by Providers based in North America
- Table 9.5 Product Competitiveness Scores Allotted to Liquid Biopsy Devices Offered by Providers based in Europe
- Table 9.6 Product Competitiveness Scores Allotted to Liquid Biopsy Devices Offered by Providers based in Asia- Pacific and RoW
- Table 9.7 Product Competitiveness Scores Allotted to Liquid Biopsy Software and Other Solutions
- Table 10.1 Liquid Biopsy Solution Providers: List of Companies Profiled
- Table 10.2 Amoy Diagnostics: Company Overview
- Table 10.3 Amoy Diagnostics: Pipeline Overview
- Table 10.4 BioCartis: Company Overview
- Table 10.5 BioCartis: Pipeline Overview
- Table 10.6 DiaCarta: Company Overview
- Table 10.7 Diacarta: Pipeline Overview
- Table 10.8 Exact Sciences: Company Overview
- Table 10.9 Exact Sciences: Pipeline Overview
- Table 10.10 GenCurix: Company Overview
- Table 10.11 GenCurix: Pipeline Overview
- Table 10.12 GeneCast Biotechnology: Company Overview
- Table 10.13 GeneCast Biotechnology: Pipeline Overview
- Table 10.14 Integrated DNA Technologies: Company Overview
- Table 10.15 Integrated DNA Technologies: Pipeline Overview
- Table 10.16 Lucence Diagnostics: Company Overview
- Table 10.17 Lucence Diagnostics: Pipeline Overview
- Table 10.18 MedGenome: Company Overview
- Table 10.19 MedGenome: Pipeline Overview
- Table 10.20 Medicover Genetics: Company Overview
- Table 10.21 Medicover Genetics: Pipeline Overview
- Table 10.22 nRICH Dx: Company Overview
- Table 10.22 nRICH Dx: Pipeline Overview
- Table 10.23 Precipio: Company Overview
- Table 10.24 Precipio: Pipeline Overview
- Table 10.25 Qiagen: Company Overview
- Table 10.26 Qiagen: Pipeline Overview
- Table 10.27 RGCC group: Company Overview
- Table 10.28 RGCC group: Pipeline Overview
- Table 10.29 Screen Cell: Company Overview
- Table 10.30 Screen Cell: Pipeline Overview
- Table 10.31 Singlera Genomics: Company Overview
- Table 10.32 Singlera Genomics: Pipeline Overview
- Table 10.33 Thermo Fisher Scientific: Company Overview
- Table 10.34 Thermo Fisher Scientific: Pipeline Overview
- Table 11.1 Liquid Biopsy Solutions: List of Partnerships and Collaborations
- Table 11.2 Liquid Biopsy: Partnerships and Collaborations: Information on Type of Agreement (Country and Region), Type of Cancer, Type of Circulating Biomarker, 2020-2025
- Table 12.1 Liquid Biopsy: List of Funding and Investments
- Table 13.1 Big Pharma Players: List of Liquid Biopsy Focused Initiatives
- Table 14.1 Liquid Biopsy Market: List of Key Acquisitions
- Table 14.2 Liquid Biopsy Solution Providers: Likely Acquisition Targets
- Table 16.1 Growth Drivers: Market Impact and Time Period
- Table 16.2 Growth Restraints: Market Impact and Time Period
- Table 16.3 Growth Opportunities: Market Impact and Time Period
- Table 16.4 Growth Challenges: Market Impact and Time Period
- Table 27.1 Liquid Biopsy: Distribution by Stage of Development
- Table 27.2 Liquid Biopsy: Analysis by Type of Solution
- Table 27.3 Liquid Biopsy: Analysis by Type of Technology
- Table 27.4 Liquid Biopsy: Analysis by Type of Sample
- Table 27.5 Liquid Biopsy: Analysis by Type of Circulating Biomarker
- Table 27.6 Liquid Biopsy: Analysis by Type of Cancer
- Table 27.7 Liquid Biopsy: Analysis by Solution Purpose
- Table 27.8 Liquid Biopsy: Analysis by Application Area
- Table 27.9 Liquid Biopsy Solution Providers: Distribution by Year of Establishment
- Table 27.10 Liquid Biopsy Solution Providers: Distribution by Company Size
- Table 27.11 Liquid Biopsy Solution Providers: Distribution by Location of Headquarters
- Table 27.12 Liquid Biopsy Solution Providers: Distribution by Most Active Players
- Table 27.13 Product Competitiveness Analysis: Overview of Liquid Biopsy Assay Kits (Peer Group I)
- Table 27.14 Product Competitiveness Analysis: Overview of Liquid Biopsy Devices (Peer Group II)
- Table 27.15 Product Competitiveness Analysis: Overview of Liquid Biopsy Software and Other Solution (Peer Group III)
- Table 27.16 Product Competitiveness Analysis: Liquid Biopsy Assay Kits Offered by Providers based in North America
- Table 27.17 Product Competitiveness Analysis: Liquid Biopsy Assay Kits Offered by Providers based in Europe
- Table 27.18 Product Competitiveness Analysis: Liquid Biopsy Assay Kits Offered by Providers based in Asia- Pacific and RoW
- Table 27.19 Product Competitiveness Analysis: Liquid Biopsy Devices Offered by Providers based in North America
- Table 27.20 Product Competitiveness Analysis: Liquid Biopsy Devices Offered by Providers based in Europe
- Table 27.21 Product Competitiveness Analysis: Liquid Biopsy Devices Offered by Providers based in Asia Pacific and RoW
- Table 27.22 Product Competitiveness Analysis: Liquid Biopsy Software and Other Solutions
- Table 27.23 Partnerships and Collaborations: Distribution by Year of Partnership
- Table 27.24 Partnerships and Collaborations: Distribution by Type of Partnership
- Table 27.25 Partnerships and Collaborations: Distribution by Year and Type of Partnership
- Table 27.26 Partnerships and Collaborations: Distribution by Type of Partner
- Table 27.27 Partnerships and Collaborations: Distribution by Type of Circulating Biomarker
- Table 27.28 Partnerships and Collaborations: Distribution by Type of Cancer
- Table 27.29 Partnerships and Collaborations: Most Active Players: Distribution by Number of Partnerships
- Table 27.30 Partnerships and Collaborations: Local and International Agreements
- Table 27.31 Partnerships and Collaborations: Intercontinental and Intracontinental Agreements
- Table 27.32 Funding and Investment Analysis: Cumulative Year- wise Distribution of Funding Instances, Pre-2020-2025
- Table 27.33 Funding and Investment Analysis: Cumulative Year- wise Distribution by Amount Invested, Pre-2020-2025 (USD Million)
- Table 27.34 Funding and Investment Analysis: Distribution by Type of Funding
- Table 27.35 Funding and Investment Analysis: Distribution of Amount Invested
- Table 27.36 Funding and Investment Analysis: Distribution by Year and Type of Funding, Pre 2020-2025
- Table 27.37 Funding and Investment Analysis: Distribution by Type of Circulating Biomarker
- Table 27.38 Funding and Investment Analysis: Distribution by Type of Cancer
- Table 27.39 Funding and Investment Analysis: Distribution by Application Area
- Table 27.40 Funding and Investment Analysis: Most Active Players: Distribution by Number of Instances
- Table 27.41 Funding and Investment Analysis: Most Active Players: Distribution by Amount Raised (USD Million)
- Table 27.42 Leading Investors by Number of Funding Instances
- Table 27.43 Funding and Investment Analysis: Distribution by Geography (Region)
- Table 27.44 Funding and Investment Analysis: Distribution by Geography (Country) (USD Million)
- Table 27.45 Big Pharma Players: Distribution by Year of Initiative
- Table 27.46 Big Pharma Players: Distribution by Type of Initiative
- Table 27.47 Big Pharma Players: Distribution by Year and Type of Initiative
- Table 27.48 Big Pharma Players: Distribution by Number of Initiatives
- Table 27.49 Big Pharma Players: Distribution by Type of Partnership
- Table 27.50 Big Pharma Initiatives Summary
- Table 27.51 Global Liquid Biopsy Market: Historical Trends (Since 2021) and Forecasted Estimates (Till 2035), Base Scenario (USD Billion)
- Table 27.52 Global Liquid Biopsy Market: Forecasted Estimates, Till 2035, Conservative Scenario (USD Billion)
- Table 27.53 Global Liquid Biopsy Market: Forecasted Estimates, Till 2035, Optimistic Scenario (USD Billion)
- Table 27.54 Liquid Biopsy Market: Distribution by Type of Technology
- Table 27.55 Liquid Biopsy Market for Next-Generation Sequencing, Historical Trends (Since 2021) and Forecasted Estimates (Till 2035) (USD Billion)
- Table 27.56 Liquid Biopsy Market for Polymerase Chain Reaction, Historical Trends (Since 2021) and Forecasted Estimates (Till 2035) (USD Billion)
- Table 27.57 Liquid Biopsy Market: Distribution by Type of Sample
- Table 27.58 Liquid Biopsy Market for Blood, Historical Trends (Since 2021) and Forecasted Estimates (Till 2035) (USD Billion)
- Table 27.59 Liquid Biopsy Market for Other Samples, Historical Trends (Since 2021) and Forecasted Estimates (Till 2035) (USD Billion)
- Table 27.60 Liquid Biopsy Market: Distribution by Type of Circulating Biomarker
- Table 27.61 Liquid Biopsy Market for Circulating Tumor DNA, Historical Trends (Since 2021) and Forecasted Estimates (Till 2035) (USD Billion)
- Table 27.62 Liquid Biopsy Market for Cell Free DNA, Historical Trends (Since 2021) and Forecasted Estimates (Till 2035) (USD Billion)
- Table 27.63 Liquid Biopsy Market for Cell Free RNA, Historical Trends (Since 2021) and Forecasted Estimates (Till 2035) (USD Billion)
- Table 27.64 Liquid Biopsy Market for Exosomes, Historical Trends (Since 2021) and Forecasted Estimates (Till 2035) (USD Billion)
- Table 27.65 Liquid Biopsy Market for Other Circulating Biomarkers, Historical Trends (Since 2021) and Forecasted Estimates (Till 2035) (USD Billion)
- Table 27.66 Liquid Biopsy Market: Distribution by Type of Cancer
- Table 27.67 Liquid Biopsy Market for Breast Cancer, Historical Trends (Since 2021) and Forecasted Estimates (Till 2035) (USD Billion)
- Table 27.68 Liquid Biopsy Market for Colorectal Cancer, Historical Trends (Since 2021) and Forecasted Estimates (Till 2035) (USD Billion)
- Table 27.69 Liquid Biopsy Market for Prostate Cancer, Historical Trends (Since 2021) and Forecasted Estimates (Till 2035) (USD Billion)
- Table 27.70 Liquid Biopsy Market for Lung Cancer, Historical Trends (Since 2021) and Forecasted Estimates (Till 2035) (USD Billion)
- Table 27.71 Liquid Biopsy Market for Bladder Cancer, Historical Trends (Since 2021) and Forecasted Estimates (Till 2035) (USD Billion)
- Table 27.72 Liquid Biopsy Market for Melanoma, Historical Trends (Since 2021) and Forecasted Estimates (Till 2035) (USD Billion)
- Table 27.73 Liquid Biopsy Market for Thyroid Cancer, Historical Trends (Since 2021) and Forecasted Estimates (Till 2035) (USD Billion)
- Table 27.74 Liquid Biopsy Market for Gastric Cancer, Historical Trends (Since 2021) and Forecasted Estimates (Till 2035) (USD Billion)
- Table 27.75 Liquid Biopsy Market for Head and Neck Cancer, Historical Trends (Since 2021) and Forecasted Estimates (Till 2035) (USD Billion)
- Table 27.76 Liquid Biopsy Market for Leukemia, Historical Trends (Since 2021) and Forecasted Estimates (Till 2035) (USD Billion)
- Table 27.77 Liquid Biopsy Market for Brain Cancer, Historical Trends (Since 2021) and Forecasted Estimates (Till 2035) (USD Billion)
- Table 27.78 Liquid Biopsy Market for Liver Cancer, Historical Trends (Since 2021) and Forecasted Estimates (Till 2035) (USD Billion)
- Table 27.79 Liquid Biopsy Market for Cervical Cancer, Historical Trends (Since 2021) and Forecasted Estimates (Till 2035) (USD Billion)
- Table 27.80 Liquid Biopsy Market for Ovarian Cancer, Historical Trends (Since 2021) and Forecasted Estimates (Till 2035) (USD Billion)
- Table 27.81 Liquid Biopsy Market for Oesophagus Cancer, Historical Trends (Since 2021) and Forecasted Estimates (Till 2035) (USD Billion)
- Table 27.82 Liquid Biopsy Market for Pancreatic Cancer, Historical Trends (Since 2021) and Forecasted Estimates (Till 2035) (USD Billion)
- Table 27.83 Liquid Biopsy Market for Nasopharyngeal cancer, Historical Trends (Since 2021) and Forecasted Estimates (Till 2035) (USD Billion)
- Table 27.84 Liquid Biopsy Market for Sarcoma, Historical Trends (Since 2021) and Forecasted Estimates (Till 2035) (USD Billion)
- Table 27.85 Liquid Biopsy Market: Distribution by Application Area
- Table 27.86 Liquid Biopsy Market for Early Diagnosis, Historical Trends (Since 2021) and Forecasted Estimates (Till 2035) (USD Billion)
- Table 27.87 Liquid Biopsy Market for Patient Monitoring, Historical Trends (Since 2021) and Forecasted Estimates (Till 2035) (USD Billion)
- Table 27.88 Liquid Biopsy Market for Recurrence Monitoring, Historical Trends (Since 2021) and Forecasted Estimates (Till 2035) (USD Billion)
- Table 27.89 Liquid Biopsy Market: Distribution by End-user
- Table 27.90 Liquid Biopsy Market for Hospitals / Laboratories, Historical Trends (Since 2021) and Forecasted Estimates (Till 2035) (USD Billion)
- Table 27.91 Liquid Biopsy Market for Research Institutes, Historical Trends (Since 2021) and Forecasted Estimates (Till 2035) (USD Billion)
- Table 27.92 Liquid Biopsy Market for Other End-users, Historical Trends (Since 2021) and Forecasted Estimates (Till 2035) (USD Billion)
- Table 27.93 Liquid Biopsy Market: Distribution by Geographical Regions
- Table 27.94 Liquid Biopsy Market in North America, Historical Trends (Since 2021) and Forecasted Estimates (Till 2035) (USD Billion)
- Table 27.95 Liquid Biopsy Market in the US, Historical Trends (Since 2021) and Forecasted Estimates (Till 2035) (USD Billion)
- Table 27.96 Liquid Biopsy Market in Europe, Historical Trends (Since 2021) and Forecasted Estimates (Till 2035) (USD Billion)
- Table 27.97 Liquid Biopsy Market in France, Historical Trends (Since 2021) and Forecasted Estimates (Till 2035) (USD Billion)
- Table 27.98 Liquid Biopsy Market in the UK, Historical Trends (Since 2021) and Forecasted Estimates (Till 2035) (USD Billion)
- Table 27.99 Liquid Biopsy Market in Germany, Historical Trends (Since 2021) and Forecasted Estimates (Till 2035) (USD Billion)
- Table 27.100 Liquid Biopsy Market in Italy, Historical Trends (Since 2021) and Forecasted Estimates (Till 2035) (USD Billion)
- Table 27.101 Liquid Biopsy Market in Spain, Historical Trends (Since 2021) and Forecasted Estimates (Till 2035) (USD Billion)
- Table 27.102 Liquid Biopsy Market in Asia-Pacific, Historical Trends (Since 2021) and Forecasted Estimates (Till 2035) (USD Billion)
- Table 27.103 Liquid Biopsy Market in China, Historical Trends (Since 2021) and Forecasted Estimates (Till 2035) (USD Billion)
- Table 27.104 Liquid Biopsy Market in India, Historical Trends (Since 2021) and Forecasted Estimates (Till 2035) (USD Billion)
- Table 27.105 Liquid Biopsy Market in Japan, Historical Trends (Since 2021) and Forecasted Estimates (Till 2035) (USD Billion)
- Table 27.106 Liquid Biopsy Market in Australia, Historical Trends (Since 2021) and Forecasted Estimates (Till 2035) (USD Billion)
List of Figures
- Figure 2.1 Research Methodology: Project Methodology
- Figure 2.2 Research Methodology: Forecast Methodology
- Figure 2.3 Research Methodology: Robust Quality Control
- Figure 2.4 Research Methodology: Key Market Segmentations
- Figure 5.1 Executive Summary: Market Landscape of Liquid Biopsy
- Figure 5.2 Executive Summary: Partnerships and Collaborations
- Figure 5.3 Executive Summary: Funding and Investment Analysis
- Figure 5.4 Executive Summary: Market Forecast and Opportunity Analysis
- Figure 6.1 Worldwide Incidence of Cancer in 2025: Distribution by Target Indication
- Figure 6.2 Factors to Determine Before Cancer Screening
- Figure 6.3 Conventional Cancer Diagnosis Methods
- Figure 6.4 Disadvantages of Invasive Techniques
- Figure 6.5 Traditional Biopsy: Process Flow
- Figure 6.6 Non-Invasive Tests: Process Flow
- Figure 6.7 Comparison of Liquid Biopsy and Traditional Tissue Biopsy
- Figure 6.8 Non-Invasive Cancer Diagnostics: Year-wise Distribution of Patents
- Figure 7.1 Non-Invasive Cancer Screening and Diagnostic Techniques
- Figure 7.2 Types of Diagnostic Imaging Procedures
- Figure 7.3 Types of Screening Assays
- Figure 7.4 Types of Advanced Non- Invasive Approaches for Cancer Diagnosis
- Figure 8.1 Liquid Biopsy: Distribution by Stage of Development
- Figure 8.2 Liquid Biopsy: Analysis by Type of Solution
- Figure 8.3 Liquid Biopsy: Analysis by Type of Technology
- Figure 8.4 Liquid Biopsy: Analysis by Type of Sample
- Figure 8.5 Liquid Biopsy: Analysis by Type of Circulating Biomarker
- Figure 8.6 Liquid Biopsy: Analysis by Type of Cancer
- Figure 8.7 Liquid Biopsy: Analysis by Solution Purpose
- Figure 8.8 Liquid Biopsy: Analysis by Application Area
- Figure 8.9 Liquid Biopsy Solution Providers: Distribution by Year of Establishment
- Figure 8.10 Liquid Biopsy Solution Providers: Distribution by Company Size
- Figure 8.11 Liquid Biopsy Solution Providers: Distribution by Location of Headquarters
- Figure 8.12 Liquid Biopsy Solution Providers: Distribution by Most Active Players
- Figure 9.1 Product Competitiveness Analysis: Overview of Liquid Biopsy Assay Kits (Peer Group I)
- Figure 9.2 Product Competitiveness Analysis: Overview of Liquid Biopsy Devices (Peer Group II)
- Figure 9.3 Product Competitiveness Analysis: Overview of Liquid Biopsy Software and Other Solution (Peer Group III)
- Figure 9.4 Product Competitiveness Analysis: Liquid Biopsy Assay Kits Offered by Providers based in North America
- Figure 9.5 Product Competitiveness Analysis: Liquid Biopsy Assay Kits Offered by Providers based in Europe
- Figure 9.6 Product Competitiveness Analysis: Liquid Biopsy Assay Kits Offered by Providers based in Asia- Pacific and RoW
- Figure 9.7 Product Competitiveness Analysis: Liquid Biopsy Devices Offered by Providers based in North America
- Figure 9.8 Product Competitiveness Analysis: Liquid Biopsy Devices Offered by Providers based in Europe
- Figure 9.9 Product Competitiveness Analysis: Liquid Biopsy Devices Offered by Providers based in Asia Pacific and RoW
- Figure 9.10 Product Competitiveness Analysis: Liquid Biopsy Software and Other Solutions
- Figure 11.1 Partnerships and Collaborations: Distribution by Year of Partnership
- Figure 11.2 Partnerships and Collaborations: Distribution by Type of Partnership
- Figure 11.3 Partnerships and Collaborations: Distribution by Year and Type of Partnership
- Figure 11.4 Partnerships and Collaborations: Distribution by Type of Partner
- Figure 11.5 Partnerships and Collaborations: Distribution by Type of Circulating Biomarker
- Figure 11.6 Partnerships and Collaborations: Distribution by Type of Cancer
- Figure 11.7 Partnerships and Collaborations: Most Active Players: Distribution by Number of Partnerships
- Figure 11.8 Partnerships and Collaborations: Local and International Agreements
- Figure 11.9 Partnerships and Collaborations: Intercontinental and Intracontinental Agreements
- Figure 12.1 Funding and Investment Analysis: Cumulative Year- wise Distribution of Funding Instances, Pre-2020-2025
- Figure 12.2 Funding and Investment Analysis: Cumulative Year- wise Distribution by Amount Invested, Pre-2020-2025 (USD Million)
- Figure 12.3 Funding and Investment Analysis: Distribution by Type of Funding
- Figure 12.4 Funding and Investment Analysis: Distribution of Amount Invested by Year and Type of Funding
- Figure 12.5 Funding and Investment Analysis: Distribution by Year and Type of Funding, Pre 2020-2025
- Figure 12.6 Funding and Investment Analysis: Distribution by Type of Circulating Biomarker
- Figure 12.7 Funding and Investment Analysis: Distribution by Type of Cancer
- Figure 12.8 Funding and Investment Analysis: Distribution by Application Area
- Figure 12.9 Funding and Investment Analysis: Most Active Players: Distribution by Number of Instances
- Figure 12.10 Funding and Investment Analysis: Most Active Players: Distribution by Amount Raised (USD Million)
- Figure 12.11 Leading Investors by Number of Funding Instances
- Figure 12.12 Funding and Investment Analysis: Distribution by Geography (Region)
- Figure 12.13 Funding and Investment Analysis: Distribution by Geography (Country) (USD Million)
- Figure 13.1 Big Pharma Players: Distribution by Year of Initiative
- Figure 13.2 Big Pharma Players: Distribution by Type of Initiative
- Figure 13.3 Big Pharma Players: Distribution by Year and Type of Initiative
- Figure 13.4 Big Pharma Players: Distribution by Number of Initiatives
- Figure 13.5 Big Pharma Players: Distribution by Type of Partnership
- Figure 13.6 Big Pharma Players: Distribution by Type of Initiative
- Figure 13.7 Big Pharma Players: Distribution by Year of Initiative
- Figure 13.8 Big Pharma Initiatives Summary
- Figure 17.1 Global Liquid Biopsy Market: Historical Trends (Since 2021) and Forecasted Estimates (Till 2035), Base Scenario (USD Billion)
- Figure 17.2 Global Liquid Biopsy Market: Forecasted Estimates, Till 2035, Conservative Scenario (USD Billion)
- Figure 17.3 Global Liquid Biopsy Market: Forecasted Estimates, Till 2035, Optimistic Scenario (USD Billion)
- Figure 18.1 Liquid Biopsy Market: Distribution by Type of Technology
- Figure 18.2 Liquid Biopsy Market for Next-Generation Sequencing, Historical Trends (Since 2021) and Forecasted Estimates (Till 2035) (USD Billion)
- Figure 18.3 Liquid Biopsy Market for Polymerase Chain Reaction, Historical Trends (Since 2021) and Forecasted Estimates (Till 2035) (USD Billion)
- Figure 19.1 Liquid Biopsy Market: Distribution by Type of Sample
- Figure 19.2 Liquid Biopsy Market for Blood, Historical Trends (Since 2021) and Forecasted Estimates (Till 2035) (USD Billion)
- Figure 19.3 Liquid Biopsy Market for Other Samples, Historical Trends (Since 2021) and Forecasted Estimates (Till 2035) (USD Billion)
- Figure 20.1 Liquid Biopsy Market: Distribution by Type of Circulating Biomarker
- Figure 20.2 Liquid Biopsy Market for Circulating Tumor DNA, Historical Trends (Since 2021) and Forecasted Estimates (Till 2035) (USD Billion)
- Figure 20.3 Liquid Biopsy Market for Cell Free DNA, Historical Trends (Since 2021) and Forecasted Estimates (Till 2035) (USD Billion)
- Figure 20.4 Liquid Biopsy Market for Cell Free RNA, Historical Trends (Since 2021) and Forecasted Estimates (Till 2035) (USD Billion)
- Figure 20.5 Liquid Biopsy Market for Exosomes, Historical Trends (Since 2021) and Forecasted Estimates (Till 2035) (USD Billion)
- Figure 20.6 Liquid Biopsy Market for Other Circulating Biomarkers, Historical Trends (Since 2021) and Forecasted Estimates (Till 2035) (USD Billion)
- Figure 21.1 Liquid Biopsy Market: Distribution by Type of Cancer
- Figure 21.2 Liquid Biopsy Market for Breast Cancer, Historical Trends (Since 2021) and Forecasted Estimates (Till 2035) (USD Billion)
- Figure 21.3 Liquid Biopsy Market for Colorectal Cancer, Historical Trends (Since 2021) and Forecasted Estimates (Till 2035) (USD Billion)
- Figure 21.4 Liquid Biopsy Market for Prostate cancer, Historical Trends (Since 2021) and Forecasted Estimates (Till 2035) (USD Billion)
- Figure 21.5 Liquid Biopsy Market for Lung Cancer, Historical Trends (Since 2021) and Forecasted Estimates (Till 2035) (USD Billion)
- Figure 21.6 Liquid Biopsy Market for Bladder Cancer, Historical Trends (Since 2021) and Forecasted Estimates (Till 2035) (USD Billion)
- Figure 21.7 Liquid Biopsy Market for Melanoma, Historical Trends (Since 2021) and Forecasted Estimates (Till 2035) (USD Billion)
- Figure 21.8 Liquid Biopsy Market for Thyroid Cancer, Historical Trends (Since 2021) and Forecasted Estimates (Till 2035) (USD Billion)
- Figure 21.9 Liquid Biopsy Market for Gastric Cancer, Historical Trends (Since 2021) and Forecasted Estimates (Till 2035) (USD Billion)
- Figure 21.10 Liquid Biopsy Market for Head and Neck Cancer, Historical Trends (Since 2021) and Forecasted Estimates (Till 2035) (USD Billion)
- Figure 21.11 Liquid Biopsy Market for Leukemia, Historical Trends (Since 2021) and Forecasted Estimates (Till 2035) (USD Billion)
- Figure 21.12 Liquid Biopsy Market for Brain Cancer, Historical Trends (Since 2021) and Forecasted Estimates (Till 2035) (USD Billion)
- Figure 21.13 Liquid Biopsy Market for Liver Cancer, Historical Trends (Since 2021) and Forecasted Estimates (Till 2035) (USD Billion)
- Figure 21.14 Liquid Biopsy Market for Cervical Cancer, Historical Trends (Since 2021) and Forecasted Estimates (Till 2035) (USD Billion)
- Figure 21.15 Liquid Biopsy Market for Ovarian Cancer, Historical Trends (Since 2021) and Forecasted Estimates (Till 2035) (USD Billion)
- Figure 21.16 Liquid Biopsy Market for Oesophagus Cancer, Historical Trends (Since 2021) and Forecasted Estimates (Till 2035) (USD Billion)
- Figure 21.17 Liquid Biopsy Market for Pancreatic Cancer, Historical Trends (Since 2021) and Forecasted Estimates (Till 2035) (USD Billion)
- Figure 21.18 Liquid Biopsy Market for Nasopharyngeal cancer, Historical Trends (Since 2021) and Forecasted Estimates (Till 2035) (USD Billion)
- Figure 21.19 Liquid Biopsy Market for Sarcoma, Historical Trends (Since 2021) and Forecasted Estimates (Till 2035) (USD Billion)
- Figure 22.1 Liquid Biopsy Market: Distribution by Application Area
- Figure 22.2 Liquid Biopsy Market for Early Diagnosis, Historical Trends (Since 2021) and Forecasted Estimates (Till 2035) (USD Billion)
- Figure 22.3 Liquid Biopsy Market for Patient Monitoring, Historical Trends (Since 2021) and Forecasted Estimates (Till 2035) (USD Billion)
- Figure 22.4 Liquid Biopsy Market for Recurrence Monitoring, Historical Trends (Since 2021) and Forecasted Estimates (Till 2035) (USD Billion)
- Figure 23.1 Liquid Biopsy Market: Distribution by End-user
- Figure 23.2 Liquid Biopsy Market for Hospitals / Laboratories, Historical Trends (Since 2021) and Forecasted Estimates (Till 2035) (USD Billion)
- Figure 23.3 Liquid Biopsy Market for Research Institutes, Historical Trends (Since 2021) and Forecasted Estimates (Till 2035) (USD Billion)
- Figure 23.4 Liquid Biopsy Market for Other End-users, Historical Trends (Since 2021) and Forecasted Estimates (Till 2035) (USD Billion)
- Figure 24.1 Liquid Biopsy Market: Distribution by Geographical Regions
- Figure 24.2 Liquid Biopsy Market in North America, Historical Trends (Since 2021) and Forecasted Estimates (Till 2035) (USD Billion)
- Figure 24.3 Liquid Biopsy Market in the US, Historical Trends (Since 2021) and Forecasted Estimates (Till 2035) (USD Billion)
- Figure 24.4 Liquid Biopsy Market in Europe, Historical Trends (Since 2021) and Forecasted Estimates (Till 2035) (USD Billion)
- Figure 24.5 Liquid Biopsy Market in France, Historical Trends (Since 2021) and Forecasted Estimates (Till 2035) (USD Billion)
- Figure 24.6 Liquid Biopsy Market in the UK, Historical Trends (Since 2021) and Forecasted Estimates (Till 2035) (USD Billion)
- Figure 24.7 Liquid Biopsy Market in Germany, Historical Trends (Since 2021) and Forecasted Estimates (Till 2035) (USD Billion)
- Figure 24.8 Liquid Biopsy Market in Italy, Historical Trends (Since 2021) and Forecasted Estimates (Till 2035) (USD Billion)
- Figure 24.9 Liquid Biopsy Market in Spain, Historical Trends (Since 2021) and Forecasted Estimates (Till 2035) (USD Billion)
- Figure 24.10 Liquid Biopsy Market in Asia-Pacific, Historical Trends (Since 2021) and Forecasted Estimates (Till 2035) (USD Billion)
- Figure 24.11 Liquid Biopsy Market in China, Historical Trends (Since 2021) and Forecasted Estimates (Till 2035) (USD Billion)
- Figure 24.12 Liquid Biopsy Market in India, Historical Trends (Since 2021) and Forecasted Estimates (Till 2035) (USD Billion)
- Figure 24.13 Liquid Biopsy Market in Japan, Historical Trends (Since 2021) and Forecasted Estimates (Till 2035) (USD Billion)
- Figure 24.14 Liquid Biopsy Market in Australia, Historical Trends (Since 2021) and Forecasted Estimates (Till 2035) (USD Billion)
- Figure 24.15 Market Movement Analysis: Geographical Regions
- Figure 24.16 Penetration-Growth (P-G) Matrix: Geographical Regions
- Figure 25.1 Concluding Remarks: Market Landscape
- Figure 25.2 Concluding Remarks: Partnerships and Collaborations
- Figure 25.3 Concluding Remarks: Funding and Investment Analysis
- Figure 25.4 Concluding Remarks: Big Pharma Initiatives
- Figure 25.5 Concluding Remarks: Market Sizing and Opportunity Analysis (I/II)
- Figure 25.6 Concluding Remarks: Market Sizing and Opportunity Analysis (II/II)

