PUBLISHER: Roots Analysis | PRODUCT CODE: 2106275

PUBLISHER: Roots Analysis | PRODUCT CODE: 2106275
Back of the Eye Disorders Market (2nd Edition) by Scale of Operation, Type of Molecule, Target Indication, Geographical Regions, Key Players, and Sales Forecast of Commercialized Drugs - Trends and Forecast Till 2035
BACK OF THE EYE DISORDERS MARKET: OVERVIEW
As per Roots Analysis, the global back of the eye disorders market is estimated to grow from USD 18.28 billion in the current year to USD 41.56 billion by 2035, at a CAGR of 9.6% during the forecast period, till 2035.
BACK OF THE EYE DISORDERS MARKET: GROWTH AND TRENDS
Therapeutic interventions for posterior segment (back-of-the-eye) disorders, along with advanced drug delivery technologies, constitute a vital segment of modern ophthalmology. These solutions are developed to address vision-threatening retinal conditions, including Age-Related Macular Degeneration (AMD), Diabetic Retinopathy (DR), Diabetic Macular Edema (DME), and Retinal Vein Occlusion. The market is characterized by the integration of advanced biologics, gene therapies, sustained-release formulations, and innovative drug delivery platforms designed to overcome the complex anatomical barriers of the posterior eye segment while enhancing treatment efficacy, durability, and patient outcomes.
Driven by continuous technological and therapeutic advancements, the back of the eye disorders market is witnessing sustained growth. Key innovations include next-generation anti-VEGF therapies, bispecific antibodies, long-acting formulations, port delivery systems, and gene and cell therapies designed to reduce treatment frequency and improve long-term retinal preservation. Despite these advancements, challenges remain, particularly in achieving efficient drug delivery across the blood-retinal barrier and mitigating the clinical and economic burden associated with repeated intravitreal injections.
Looking ahead, the market is expected to benefit significantly from the increasing global prevalence of diabetes, the expanding geriatric population, and growing investments in precision ophthalmology and next-generation ocular drug delivery technologies. These factors are anticipated to support continued innovation and drive robust market expansion over the coming years.
Growth Drivers: Strategic Enablers of Market Expansion
The growth of the back-of-the-eye disorders market is being primarily driven by the rising global prevalence of age-related and diabetes-associated retinal diseases, including age-related macular degeneration (AMD) and diabetic retinopathy (DR). The increasing burden of diabetes, combined with a rapidly aging population, is significantly expanding the patient pool requiring long-term retinal care. According to published research, nearly 200 million individuals worldwide are currently affected by AMD, with the number expected to approach 300 million by 2040, creating sustained demand for effective therapeutic interventions.
Complementing this demand, ongoing innovations in long-acting anti-VEGF therapies, sustained-release implants, and emerging gene therapy approaches are transforming the treatment landscape by reducing injection frequency, improving clinical outcomes, and alleviating patient burden. Furthermore, the accelerated development pipeline and favorable regulatory approvals are supporting broader clinical adoption of these advanced therapies. At the same time, advancements in diagnostic technologies, particularly high-resolution optical coherence tomography (OCT), alongside expanded screening initiatives and disease awareness programs, are enabling earlier diagnosis and intervention.
Collectively, these factors are increasing the number of treatable patients, improving disease management outcomes, and reinforcing the long-term growth trajectory of the back-of-the-eye disorders market.
Market Challenges: Critical Barriers Impeding Progress
Despite significant therapeutic advancements, the back-of-the-eye disorders market continues to face several clinical, technological, and economic challenges that may constrain its growth potential. One of the primary barriers is the complex anatomy of the posterior eye segment, which makes efficient drug delivery particularly difficult. The presence of physiological barriers, including the blood-retinal barrier, limits drug penetration and often necessitates invasive administration methods such as intravitreal injections. These procedures are associated with patient discomfort, treatment fatigue, and risks of complications, including infection and retinal damage. Furthermore, the chronic nature of conditions such as age-related macular degeneration (AMD), diabetic retinopathy (DR), and diabetic macular edema (DME) requires long-term treatment and monitoring, resulting in a substantial healthcare and economic burden for both patients and providers.
In addition, the high cost of advanced biologics, gene therapies, and sustained-release drug delivery platforms poses affordability and reimbursement challenges, particularly in emerging healthcare markets. Variability in patient response to existing therapies, the need for frequent follow-up visits, and limited access to specialized retinal care in underserved regions further hinder optimal disease management. Moreover, the development of novel ophthalmic therapies is associated with lengthy clinical timelines, stringent regulatory requirements, and complex manufacturing processes, increasing development costs and commercialization risks. Addressing these challenges will be critical to improving treatment accessibility, enhancing patient adherence, and unlocking the full growth potential of the back-of-the-eye disorders market.
BACK OF THE EYE DISORDERS MARKET: KEY INSIGHTS
The report delves into the current state of the back of the eye disorders market and identifies potential growth opportunities within the industry. Some key findings from the report include:
1. Given the rising prevalence of back of the eye disorders and the growing need for advanced treatment modalities, several researchers and industry players have shifted their focus on the development of safe and effective therapeutic drug molecules.
2. Over the years, the drug landscape for back of the eye disorders has transformed significantly, featuring a robust pipeline of around 690 drugs that are currently approved or are in various clinical stages of development.
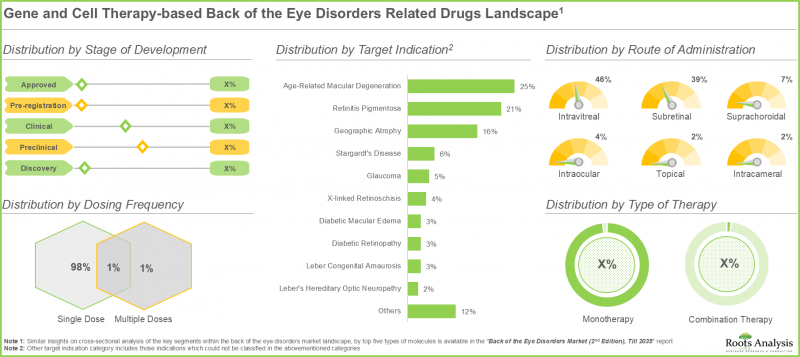
3. Close to 45% of the posterior segment drugs / therapies are in the preclinical stage of development; of these, majority (>30%) of the drugs / therapies are gene and cell therapies.
4. ~50% of gene and cell therapy-based drugs under development for posterior segment diseases are administered through intravitreal route, as it enables better local retinal exposure at lower drug doses.
5. Given the ongoing advancements in novel drug delivery systems and increasing prevalence of age and diabetes associated retinal diseases, the market is anticipated to witness a steady growth in the foreseen future.
6. Majority of the back of the eye disorders market is currently captured by biologics, owing to their ability to target the underlying biological pathways associated with back of the eye disorders.
7. North America is expected to capture a significant share of the overall back of the eye disorders market owing to the rapid innovations for targeted drug delivery systems in the region.
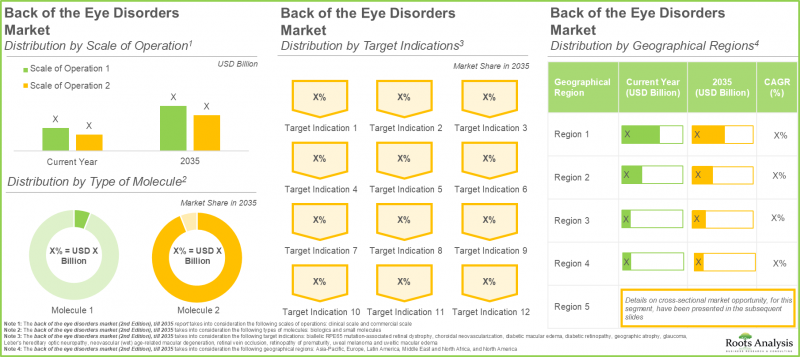
8. Driven by the rapid success of approved back of the eye disorders related drugs developed by prominent players in the US, the market is expected to grow at a steady annualized rate.
9. Given the surge in demand for novel therapeutics to target various chronic posterior eye diseases, and expedited regulatory approvals, the back of the eye disorders market is anticipated to rise steadily in the coming years.
Back of the Eye Disorders Market Segments
The market sizing and opportunity analysis has been segmented across the following parameters:
By Scale of Operation
- Clinical Scale
- Commercial Scale
By Type of Molecule
- Biologics
- Small Molecules
By Target Indication
- Diabetic Macular Edema
- Neovascular (Wet) Age-Related Macular Degeneration
- Diabetic Retinopathy
- Glaucoma
- Geographic Atrophy
- Uveal Melanoma
- Retinal Vein Occlusion
- Uveitic Macular Edema
- Choroidal Neovascularization
- Biallelic RPE65 mutation-associated Retinal Dystrophy
- Retinopathy of Prematurity
- Leber's Hereditary Optic Neuropathy
By Geographical Regions
- North America
- US
- Canada
- Europe
- Germany
- UK
- France
- Italy
- Spain
- Rest of Europe
- Asia-Pacific
- China
- Japan
- India
- South Korea
- Australia
- Rest of Asia-Pacific
- Middle East and North Africa
- Saudi Arabia
- Egypt
- Rest of Middle East and North Africa
- Latin America
- Brazil
- Argentina
- Rest of Latin America
BACK OF THE EYE DISORDERS MARKET: KEY SEGMENTS
Clinical Pipeline Expansion Accelerating Growth in the Back of the Eye Disorders Market
The commercial-stage segment currently accounts for most of the back of the eye disorders market, representing approximately 95% of total market revenue. This dominance is primarily attributed to the widespread adoption of approved therapies that offer well-established efficacy, safety, and clinical outcomes.
However, the clinical-stage pipeline is expected to witness the fastest growth during the forecast period, reflecting significant future market potential. The expansion of this segment is driven by the increasing number of innovative therapeutic candidates progressing through late-stage clinical development, alongside continued research into novel mechanisms of action across multiple retinal disease indications. Several promising Phase III candidates, including KSI-501 (Kodiak Sciences), OVX-001 (Ocuvex Therapeutics), ADX-2191 (Aldeyra Therapeutics), ONS-5010 (Outlook Therapeutics), and OTX-TKI (Ocular Therapeutix), are expected to contribute to future market expansion upon successful regulatory approval.
Diabetic Macular Edema Remains the Largest Therapeutic Segment
Diabetic Macular Edema (DME) represents the leading indication within the back of the eye disorders market, accounting for nearly 40% of the total market share in the current year. The segment's dominance is largely supported by the rising global burden of diabetes, driven by demographic aging, sedentary lifestyles, and changing dietary patterns. Several established therapies, including Eylea(R), Eylea HD(R), Lumitin(R), Lucentis(R), and Vabysmo(R), continue to support strong market demand. Additionally, OCS-01, a preservative-free investigational therapy being developed by Oculis, is expected to strengthen the treatment landscape pending positive Phase III clinical outcomes and subsequent regulatory approval. While DME currently dominates market revenues, the Uveitic Macular Edema segment is projected to register the highest growth rate during the forecast period. This growth is expected to be fueled by the increasing incidence of non-infectious uveitis, greater adoption of long-acting intravitreal implants and targeted biologics, substantial unmet clinical needs, and a progressively favorable reimbursement environment.
Regional Market Dynamics
North America Maintains Market Leadership
North America is expected to remain the largest regional market for back of the eye disorders, accounting for approximately 60% of global market share by 2035. The region's strong position is supported by extensive collaboration between academic institutions and industry stakeholders, advanced drug development and manufacturing capabilities, and a highly active intellectual property landscape. Further, strategic mergers and acquisitions continue to strengthen the regional ecosystem and accelerate innovation. A notable example includes the acquisition of Whitecap Biosciences by an affiliate of Bausch + Lomb. This transaction enhances Bausch + Lomb's ophthalmology pipeline by incorporating innovative investigational therapies targeting glaucoma and geographic atrophy, a late-stage manifestation of dry age-related macular degeneration, thereby reinforcing the company's long-term growth strategy in ophthalmic therapeutics.
Increasing Adoption of Back of the Eye Disorder Therapies Across Asia-Pacific
The Asia-Pacific market is projected to witness robust growth, expanding at a CAGR of 11.9% throughout the forecast period. Growth in the region is supported by increasing healthcare expenditure, improving access to advanced ophthalmic treatments, expanding patient population, and a growing focus on retinal disease management. Several leading pharmaceutical companies headquartered in the region, including Astellas Pharma and Otsuka Pharmaceutical, are actively engaged in the development of innovative therapies targeting back of the eye disorders. These initiatives, combined with ongoing investments in research and development, are expected to significantly enhance the region's contribution to the global market over the coming decade.
Example Players in Back of the Eye Disorders Market
- AbbVie
- Astellas Pharma
- Bausch + Lomb
- Chiesi
- Genentech
- Novartis
- Otsuka Pharmaceutical
- Regeneron Pharmaceuticals
- Roche
- Sun Pharma
Primary Research Overview
The opinions and insights presented in this study were influenced by discussions conducted with multiple stakeholders. The research report features detailed transcripts of interviews held with the following industry stakeholders:
- Former Chief Executive Officer, Small Company, Australia
- Former President and Chief Executive Officer, Mid-sized Company, US
- Former Senior Vice President, Small Company, US
In addition, the back of the eye disorders market report includes transcripts of the following third-party discussions:
- Associate Professor & Senior Consultant, Mid-sized Organization, Italy
- Assistant Professor, Very Large Organization, US
- Postdoctoral Researcher, Very Large Organization, US
BACK OF THE EYE DISORDERS MARKET: RESEARCH COVERAGE
- Market Sizing and Opportunity Analysis: The report features an in-depth analysis of the back of the eye disorders market, focusing on key market segments, including [A] scale of operation, [B] type of molecule, [C] target indication, and [D] geographical regions.
- Market Landscape: A detailed assessment of the overall back of the eye disorders market: drug and developers landscape, featuring information on several relevant parameters, such as [A] stage of development, [B] target indication, [C] route of administration, [D] type of molecule, [E] dosing frequency, [F] mechanism of action, [G] type of therapy, [H] drug designation, [I] year of establishment, [J] company size (based on employee count), [K] location of headquarters, and [L] most active developers.
- Product Competitiveness Analysis: A detailed competitiveness analysis of the drug developers based on several relevant parameters, such as company strength (in terms of years of experience and company size), portfolio strength (based on stage of development of drugs developed, number of drugs developed, type of molecule developed, and route of administration of drug developed) and portfolio diversity (number of target indications).
- Company Profiles: In-depth profiles of key drug developers in the back of the eye disorders market, focusing on [A] company overviews, [B] financial information, [C] drug portfolio, [D] recent developments, and [E] an informed future outlook.
- Market Impact Analysis: The report analyzes various factors such as drivers, restraints, opportunities, and challenges affecting market growth.
KEY QUESTIONS ANSWERED IN THIS REPORT
- Which are the leading companies in the back of the eye disorders market?
- Which region dominates the back of the eye disorders market?
- What are the key trends observed in the back of the eye disorders market?
- What factors are likely to influence the evolution of this market?
- What are the primary challenges faced by back of the eye disorder drug developers?
- What is the current and future market size?
- What is the CAGR of this market?
- How is the current and future market opportunity likely to be distributed across key market segments?
REASONS TO BUY THIS REPORT
- The report provides a comprehensive market analysis, offering detailed revenue projections of the overall market and its specific sub-segments. This information is valuable to both established market leaders and emerging entrants.
- The report offers stakeholders a comprehensive overview of the market, including key drivers, barriers, opportunities, and challenges. This information empowers stakeholders to stay abreast of market trends and make data-driven decisions to capitalize on growth prospects.
- The report can aid businesses in identifying future opportunities in any sector. It also helps in understanding if those opportunities are worth pursuing.
- The report helps in identifying customer demand by understanding the needs, preferences, and behavior of the target audience in order to tailor products or services effectively.
- The report equips new entrants with requisite information regarding a particular market to help them build successful business strategies.
- The report allows for more effective communication with the audience and in building strong business relations.
ADDITIONAL BENEFITS
- Complementary Excel Data Packs for all Analytical Modules in the Report
- 15% Free Content Customization
- Detailed Report Walkthrough Session with Research Team
- Free Updated report if the report is 6-12 months old or older
TABLE OF CONTENTS
1. BACKGROUND
- 1.1. Context
- 1.2. Project Objectives
2. RESEARCH METHODOLOGY
- 2.1. Chapter Overview
- 2.2. Research Assumptions
- 2.2.1. Market Landscape and Market Trends
- 2.2.2. Market Forecast and Opportunity Analysis
- 2.2.3. Comparative Analysis
- 2.3. Database Building
- 2.3.1. Data Collection
- 2.3.2. Data Validation
- 2.3.3. Data Analysis
- 2.4. Project Methodology
- 2.4.1. Secondary Research
- 2.4.1.1. Annual Reports
- 2.4.1.2. Academic Research Papers
- 2.4.1.3. Company Websites
- 2.4.1.4. Investor Presentations
- 2.4.1.5. Regulatory Filings
- 2.4.1.6. White Papers
- 2.4.1.7. Industry Publications
- 2.4.1.8. Conferences and Seminars
- 2.4.1.9. Government Portals
- 2.4.1.10. Media and Press Releases
- 2.4.1.11. Newsletters
- 2.4.1.12. Industry Databases
- 2.4.1.13. Roots Proprietary Databases
- 2.4.1.14. Paid Databases and Sources
- 2.4.1.15. Social Media Portals
- 2.4.1.16. Other Secondary Sources
- 2.4.2. Primary Research
- 2.4.2.1. Types of Primary Research
- 2.4.2.1.1. Qualitative Research
- 2.4.2.1.2. Quantitative Research
- 2.4.2.1.3. Hybrid Approach
- 2.4.2.2. Advantages of Primary Research
- 2.4.2.3. Techniques for Primary Research
- 2.4.2.3.1. Interviews
- 2.4.2.3.2. Surveys
- 2.4.2.3.3. Focus Groups
- 2.4.2.3.4. Observational Research
- 2.4.2.3.5. Social Media Interactions
- 2.4.2.4. Key Opinion Leaders Considered in Primary Research
- 2.4.2.4.1. Company Executives (CXOs)
- 2.4.2.4.2. Board of Directors
- 2.4.2.4.3. Company Presidents and Vice Presidents
- 2.4.2.4.4. Research and Development Heads
- 2.4.2.4.5. Technical Experts
- 2.4.2.4.6. Subject Matter Experts
- 2.4.2.4.7. Scientists
- 2.4.2.4.8. Doctors and Other Healthcare Providers
- 2.4.2.5. Ethics and Integrity
- 2.4.2.5.1. Research Ethics
- 2.4.2.5.2. Data Integrity
- 2.4.2.1. Types of Primary Research
- 2.4.3. Analytical Tools and Databases
- 2.4.1. Secondary Research
- 2.5. Robust Quality Control
3. MARKET DYNAMICS
- 3.1. Chapter Overview
- 3.2. Forecast Methodology
- 3.2.1. Top-down Approach
- 3.2.2. Bottom-up Approach
- 3.2.3. Hybrid Approach
- 3.3. Market Assessment Framework
- 3.3.1. Total Addressable Market (TAM)
- 3.3.2. Serviceable Addressable Market (SAM)
- 3.3.3. Serviceable Obtainable Market (SOM)
- 3.3.4. Currently Acquired Market (CAM)
- 3.4. Forecasting Tools and Techniques
- 3.4.1. Qualitative Forecasting
- 3.4.2. Correlation
- 3.4.3. Regression
- 3.4.4. Extrapolation
- 3.4.5. Convergence
- 3.4.6. Sensitivity Analysis
- 3.4.7. Scenario Planning
- 3.4.8. Data Visualization
- 3.4.9. Time Series Analysis
- 3.4.10. Forecast Error Analysis
- 3.5. Key Considerations
- 3.5.1. Demographics
- 3.5.2. Government Regulations
- 3.5.3. Reimbursement Scenarios
- 3.5.4. Market Access
- 3.5.5. Supply Chain
- 3.5.6. Industry Consolidation
- 3.5.7. Pandemic / Unforeseen Disruptions Impact
- 3.6. Limitations
4. MACRO-ECONOMIC INDICATORS
- 4.1. Chapter Overview
- 4.2. Market Dynamics
- 4.2.1. Time Period
- 4.2.1.1. Historical Trends
- 4.2.1.2. Current and Forecasted Estimates
- 4.2.2. Currency Coverage
- 4.2.2.1. Major Currencies Affecting the Market
- 4.2.2.2. Factors Affecting Currency Fluctuations
- 4.2.2.3. Impact of Currency Fluctuations on the Industry
- 4.2.3. Foreign Currency Exchange Rate
- 4.2.3.1. Impact of Foreign Exchange Rate Volatility on the Market
- 4.2.3.2. Strategies for Mitigating Foreign Exchange Risk
- 4.2.4. Recession
- 4.2.4.1. Assessment of Current Economic Conditions and Potential Impact on the Market
- 4.2.4.2. Historical Analysis of Past Recessions and Lessons Learnt
- 4.2.5. Inflation
- 4.2.5.1. Measurement and Analysis of Inflationary Pressures in the Economy
- 4.2.5.2. Potential Impact of Inflation on the Market Evolution
- 4.2.6. Interest Rates
- 4.2.6.1. Interest Rates and Their Impact on the Market
- 4.2.6.2. Strategies for Managing Interest Rate Risk
- 4.2.7. Commodity Flow Analysis
- 4.2.7.1. Type of Commodity
- 4.2.7.2. Origins and Destinations
- 4.2.7.3. Values and Weights
- 4.2.7.4. Modes of Transportation
- 4.2.8. Global Trade Dynamics
- 4.2.8.1. Import Scenario
- 4.2.8.2. Export Scenario
- 4.2.8.3. Trade Policies
- 4.2.8.4. Strategies for Mitigating the Risks Associated with Trade Barriers
- 4.2.8.5. Impact of Trade Barriers on the Market
- 4.2.9. War Impact Analysis
- 4.2.9.1. Russian-Ukraine War
- 4.2.9.2. Israel-Hamas War
- 4.2.10. COVID Impact / Related Factors
- 4.2.10.1. Global Economic Impact
- 4.2.10.2. Industry-specific Impact
- 4.2.10.3. Government Response and Stimulus Measures
- 4.2.10.4. Future Outlook and Adaptation Strategies
- 4.2.11. Other Indicators
- 4.2.11.1. Fiscal Policy
- 4.2.11.2. Consumer Spending
- 4.2.11.3. Gross Domestic Product (GDP)
- 4.2.11.4. Employment
- 4.2.11.5. Taxes
- 4.2.11.6. Stock Market Performance
- 4.2.11.7. Cross-Border Dynamics
- 4.2.1. Time Period
- 4.3. Conclusion
5. EXECUTIVE SUMMARY
- 5.1. Executive Summary: Market Landscape
- 5.2. Executive Summary: Market Forecast and Opportunity Analysis
6. INTRODUCTION
- 6.1. Overview of Back of the Eye Disorders
- 6.2. Back of the Eye Structure
- 6.3. Challenges Associated with Back of the Eye Drug Delivery
- 6.4. Back of the Eye Drug Delivery Routes
- 6.5. Prominent Back of the Eye Disorders
- 6.6. Factors Contributing to Back of the Eye Disorders
- 6.7. Signs and Symptoms of Back of the Eye Disorders
- 6.8. Treatment Approaches for Back of the Eye Disorders
- 6.9. Recent Trends in the Back of the Eye Disorders Domain
7. BACK OF THE EYE DISORDERS MARKET: DRUGS AND DEVELOPERS LANDSCAPE
- 7.1. Methodology and Key Parameters
- 7.2. Back of the Eye Disorders Market: Drugs Landscape
- 7.2.1. Analysis by Stage of Development
- 7.2.2. Analysis by Type of Molecule
- 7.2.3. Analysis by Mechanism of Action
- 7.2.4. Analysis by Dosing Frequency
- 7.2.5. Analysis by Route of Administration
- 7.2.6. Analysis by Target Indication
- 7.2.7. Analysis by Type of Therapy
- 7.2.8. Analysis by Drug Designation
- 7.3. Gene and Cell Therapy-based Back of the Eye Disorders Related Drugs Landscape
- 7.3.1. Analysis by Stage of Development
- 7.3.2. Analysis by Dosing Frequency
- 7.3.3. Analysis by Target Indication
- 7.3.4. Analysis by Route of Administration
- 7.3.5. Analysis by Type of Therapy
- 7.4. Small Molecule-based Back of the Eye Disorders Related Drugs Landscape
- 7.4.1. Analysis by Stage of Development
- 7.4.2. Analysis by Dosing Frequency
- 7.4.3. Analysis by Target Indication
- 7.4.4. Analysis by Route of Administration
- 7.4.5. Analysis by Type of Therapy
- 7.5. Antibody-based Back of the Eye Disorders Related Drugs Landscape
- 7.5.1. Analysis by Stage of Development
- 7.5.2. Analysis by Dosing Frequency
- 7.5.3. Analysis by Target Indication
- 7.5.4. Analysis by Route of Administration
- 7.5.5. Analysis by Type of Therapy
- 7.6. Protein-based Back of the Eye Disorders Related Drugs Landscape
- 7.6.1. Analysis by Stage of Development
- 7.6.2. Analysis by Dosing Frequency
- 7.6.3. Analysis by Target Indication
- 7.6.4. Analysis by Route of Administration
- 7.6.5. Analysis by Type of Therapy
- 7.7. Peptide-based Back of the Eye Disorders Related Drugs Landscape
- 7.7.1. Analysis by Stage of Development
- 7.7.2. Analysis by Dosing Frequency
- 7.7.3. Analysis by Target Indication
- 7.7.4. Analysis by Route of Administration
- 7.7.5. Analysis by Type of Therapy
- 7.8. Back of the Eye Disorders Market: Developers Landscape
- 7.8.1. Analysis by Year of Establishment
- 7.8.2. Analysis by Company Size
- 7.8.3. Analysis by Location of Headquarters
- 7.8.4. Analysis by Company Size and Location of Headquarters
- 7.8.5. Most Active Players: Analysis by Number of Drugs
8. BACK OF THE EYE DISORDERS MARKET: COMPANY COMPETITIVENESS ANALYSIS
- 8.1. Methodology and Key Parameters
- 8.2. Scoring Criteria
- 8.3. Overview of Peer Groups
- 8.3.1. Company Competitiveness Analysis: Developers based in North America (Peer Group I)
- 8.3.2. Company Competitiveness Analysis: Developers based in Europe (Peer Group II)
- 8.3.3. Company Competitiveness Analysis: Developers based in Asia-Pacific and Rest of the World (Peer Group III)
9. COMPANY PROFILES: BACK OF THE EYE DISORDERS DRUG DEVELOPERS
- 9.1. Chapter Overview
- 9.2. AbbVie*
- 9.2.1. Company Overview
- 9.2.2. Management Team
- 9.2.3. Back of the Eye Drugs Portfolio
- 9.2.4. Key Initiatives
- Similar details are presented for other companies mentioned below (based on information in the public domain)
- 9.3. Astellas Pharma
- 9.4. Bausch + Lomb
- 9.5. Chiesi
- 9.6. Genentech
- 9.7. Novartis
- 9.8. Otsuka Pharmaceutical
- 9.9. Regeneron Pharmaceuticals
- 9.10. Roche
- 9.11. Sun Pharma
10. MARKET IMPACT ANALYSIS
- 10.1. Chapter Overview
- 10.2. Market Drivers
- 10.3. Market Restraints
- 10.4. Market Opportunities
- 10.5. Market Challenges
11. GLOBAL BACK OF THE EYE DISORDERS MARKET
- 11.1. Key Assumptions and Methodology
- 11.2. Global Back of The Eye Disorders Market, Historical Trends (Since 2022) and Forecasted Estimates (Till 2035)
- 11.2.1. Scenario Analysis
- 11.2.1.1. Conservative Scenario
- 11.2.1.2. Optimistic Scenario
- 11.2.1. Scenario Analysis
- 11.3. Key Market Segmentations
12. BACK OF THE EYE DISORDERS MARKET, BY SCALE OF OPERATION
- 12.1. Key Assumptions and Methodology
- 12.2. Back of The Eye Disorders Market: Distribution by Scale of Operation
- 12.2.1. Back of The Eye Disorders Market at Clinical Scale, Forecasted Estimates (Till 2035)
- 12.2.2. Back of The Eye Disorders Market at Commercial Scale, Historical Trends (Since 2022) and Forecasted Estimates (Till 2035)
13. BACK OF THE EYE DISORDERS MARKET, BY TYPE OF MOLECULE
- 13.1. Key Assumptions and Methodology
- 13.2. Back of The Eye Disorders Market: Distribution by Type of Molecule
- 13.2.1. Back of The Eye Disorders Market for Biologics, Historical Trends (Since 2022) and Forecasted Estimates (Till 2035)
- 13.2.2. Back of The Eye Disorders Market for Small Molecules, Historical Trends (Since 2022) and Forecasted Estimates (Till 2035)
14. BACK OF THE EYE DISORDERS MARKET, BY TARGET INDICATION
- 14.1. Key Assumptions and Methodology
- 14.2. Back of The Eye Disorders Market: Distribution by Target Indication
- 14.2.1. Back of The Eye Disorders Market for Diabetic Macular Edema, Historical Trends (Since 2022) and Forecasted Estimates (Till 2035)
- 14.2.2. Back of The Eye Disorders Market for Neovascular (Wet) Age-Related Macular Degeneration, Historical Trends (Since 2022) and Forecasted Estimates (Till 2035)
- 14.2.3. Back of The Eye Disorders Market for Diabetic Retinopathy, Historical Trends (Since 2022) and Forecasted Estimates (Till 2035)
- 14.2.4. Back of The Eye Disorders Market for Glaucoma, Historical Trends (Since 2022) and Forecasted Estimates (Till 2035)
- 14.2.5. Back of The Eye Disorders Market for Geographic Atrophy, Historical Trends (Since 2023) and Forecasted Estimates (Till 2035)
- 14.2.6. Back of The Eye Disorders Market for Uveal Melanoma, Historical Trends (Since 2022) and Forecasted Estimates (Till 2035)
- 14.2.7. Back of The Eye Disorders Market for Retinal Vein Occlusion, Historical Trends (Since 2022) and Forecasted Estimates (Till 2035)
- 14.2.8. Back of The Eye Disorders Market for Uveitic Macular Edema, Historical Trends (Since 2022) and Forecasted Estimates (Till 2035)
- 14.2.9. Back of The Eye Disorders Market for Choroidal Neovascularization, Historical Trends (Since 2022) and Forecasted Estimates (Till 2035)
- 14.2.10. Back of The Eye Disorders Market for Biallelic RPE65 mutation-associated Retinal Dystrophy, Historical Trends (Since 2022) and Forecasted Estimates (Till 2035)
- 14.2.11. Back of The Eye Disorders Market for Retinopathy of Prematurity, Historical Trends (Since 2022) and Forecasted Estimates (Till 2035)
- 14.2.12. Back of The Eye Disorders Market for Leber's Hereditary Optic Neuropathy, Historical Trends (Since 2022) and Forecasted Estimates (Till 2035)
15. BACK OF THE EYE DISORDERS MARKET, BY GEOGRAPHICAL REGIONS
- 15.1. Key Assumptions and Methodology
- 15.2. Back of The Eye Disorders Market: Distribution by Geographical Regions
- 15.2.1. Back of The Eye Disorders Market in North America, Historical Trends (Since 2022) and Forecasted Estimates (Till 2035)
- 15.2.1.1. Back of The Eye Disorders Market in the US, Historical Trends (Since 2022) and Forecasted Estimates (Till 2035)
- 15.2.1.2. Back of The Eye Disorders Market in Canada, Historical Trends (Since 2022) and Forecasted Estimates (Till 2035)
- 15.2.2. Back of The Eye Disorders Market in Europe, Historical Trends (Since 2022) and Forecasted Estimates (Till 2035)
- 15.2.2.1. Back of The Eye Disorders Market in Germany, Historical Trends (Since 2022) and Forecasted Estimates (Till 2035)
- 15.2.2.2. Back of The Eye Disorders Market in the UK, Historical Trends (Since 2022) and Forecasted Estimates (Till 2035)
- 15.2.2.3. Back of The Eye Disorders Market in France, Historical Trends (Since 2022) and Forecasted Estimates (Till 2035)
- 15.2.2.4. Back of The Eye Disorders Market in Italy, Historical Trends (Since 2022) and Forecasted Estimates (Till 2035)
- 15.2.2.5. Back of The Eye Disorders Market in Spain, Historical Trends (Since 2022) and Forecasted Estimates (Till 2035)
- 15.2.2.6. Back of The Eye Disorders Market in Rest of Europe, Historical Trends (Since 2022) and Forecasted Estimates (Till 2035)
- 15.2.3. Back of The Eye Disorders Market in Asia-Pacific, Historical Trends (Since 2022) and Forecasted Estimates (Till 2035)
- 15.2.3.1. Back of The Eye Disorders Market in China, Historical Trends (Since 2022) and Forecasted Estimates (Till 2035)
- 15.2.3.2. Back of The Eye Disorders Market in Japan, Historical Trends (Since 2022) and Forecasted Estimates (Till 2035)
- 15.2.3.3. Back of The Eye Disorders Market in India, Historical Trends (Since 2022) and Forecasted Estimates (Till 2035)
- 15.2.3.4. Back of The Eye Disorders Market in South Korea, Historical Trends (Since 2022) and Forecasted Estimates (Till 2035)
- 15.2.3.5. Back of The Eye Disorders Market in Australia, Historical Trends (Since 2022) and Forecasted Estimates (Till 2035)
- 15.2.3.6. Back of The Eye Disorders Market in Rest of Asia-Pacific, Historical Trends (Since 2022) and Forecasted Estimates (Till 2035)
- 15.2.4. Back of The Eye Disorders Market in Middle East and North Africa, Historical Trends (Since 2022) and Forecasted Estimates (Till 2035)
- 15.2.4.1. Back of The Eye Disorders Market in Saudi Arabia, Historical Trends (Since 2022) and Forecasted Estimates (Till 2035)
- 15.2.4.2. Back of The Eye Disorders Market in Egypt, Historical Trends (Since 2022) and Forecasted Estimates (Till 2035)
- 15.2.4.3. Back of The Eye Disorders Market in Rest of Middle East and North Africa, Historical Trends (Since 2022) and Forecasted Estimates (Till 2035)
- 15.2.5. Back of The Eye Disorders Market in Latin America, Historical Trends (Since 2022) and Forecasted Estimates (Till 2035)
- 15.2.5.1. Back of The Eye Disorders Market in Brazil, Historical Trends (Since 2022) and Forecasted Estimates (Till 2035)
- 15.2.5.2. Back of The Eye Disorders Market in Argentina, Historical Trends (Since 2022) and Forecasted Estimates (Till 2035)
- 15.2.5.3. Back of The Eye Disorders Market in Rest of Latin America, Historical Trends (Since 2022) and Forecasted Estimates (Till 2035)
- 15.2.1. Back of The Eye Disorders Market in North America, Historical Trends (Since 2022) and Forecasted Estimates (Till 2035)
16. BACK OF THE EYE DISORDERS MARKET: NORTH AMERICA
- 16.1. Back of The Eye Disorders Market in North America: Distribution by Scale of Operation
- 16.1.1. Back of The Eye Disorders Market in North America at Clinical Scale, Forecasted Estimates (till 2035)
- 16.1.2. Back of The Eye Disorders Market in North America at Commercial Scale, Historical Trends (since 2022) and Forecasted Estimates (till 2035)
- 16.2. Back of The Eye Disorders Market in North America: Distribution by Type of Molecule
- 16.2.1. Back of The Eye Disorders Market in North America for Biologics, Historical Trends (since 2022) and Forecasted Estimates (till 2035)
- 16.2.2. Back of The Eye Disorders Market in North America for Small Molecules, Historical Trends (since 2022) and Forecasted Estimates (till 2035)
- 16.3. Back of The Eye Disorders Market in North America: Distribution by Target Indication
- 16.3.1. Back of The Eye Disorders Market in North America for Diabetic Macular Edema, Historical Trends (Since 2022) and Forecasted Estimates (Till 2035)
- 16.3.2. Back of The Eye Disorders Market in North America for Neovascular (Wet) Age-Related Macular Degeneration, Historical Trends (Since 2022) and Forecasted Estimates (Till 2035)
- 16.3.3. Back of The Eye Disorders Market in North America for Diabetic Retinopathy, Historical Trends (Since 2022) and Forecasted Estimates (Till 2035)
- 16.3.4. Back of The Eye Disorders Market in North America for Glaucoma, Historical Trends (Since 2022) and Forecasted Estimates (Till 2035)
- 16.3.5. Back of The Eye Disorders Market in North America for Geographic Atrophy, Historical Trends (Since 2022) and Forecasted Estimates (Till 2035)
- 16.3.6. Back of The Eye Disorders Market in North America for Uveal Melanoma, Historical Trends (Since 2022) and Forecasted Estimates (Till 2035)
- 16.3.7. Back of The Eye Disorders Market in North America for Retinal Vein Occlusion, Historical Trends (Since 2022) and Forecasted Estimates (Till 2035)
- 16.3.8. Back of The Eye Disorders Market in North America for Uveitic Macular Edema, Historical Trends (Since 2022) and Forecasted Estimates (Till 2035)
- 16.3.9. Back of The Eye Disorders Market in North America for Choroidal Neovascularization, Historical Trends (Since 2022) and Forecasted Estimates (Till 2035)
- 16.3.10. Back of The Eye Disorders Market in North America for Biallelic RPE65 mutation-associated Retinal Dystrophy, Historical Trends (Since 2022) and Forecasted Estimates (Till 2035)
- 16.3.11. Back of The Eye Disorders Market in North America for Retinopathy of Prematurity, Historical Trends (Since 2022) and Forecasted Estimates (Till 2035)
- 16.3.12. Back of The Eye Disorders Market in North America for Leber's Hereditary Optic Neuropathy, Historical Trends (Since 2022) and Forecasted Estimates (Till 2035)
17. BACK OF THE EYE DISORDERS MARKET: EUROPE
- 17.1. Back of The Eye Disorders Market in Europe: Distribution by Scale of Operation
- 17.1.1. Back of The Eye Disorders Market in Europe at Clinical Scale, Forecasted Estimates (till 2035)
- 17.1.2. Back of The Eye Disorders Market in Europe at Commercial Scale, Historical Trends (since 2017) and Forecasted Estimates (till 2035)
- 17.2. Back of The Eye Disorders Market in Europe: Distribution by Type of Molecule
- 17.2.1. Back of The Eye Disorders Market in Europe for Biologics, Historical Trends (since 2017) and Forecasted Estimates (till 2035)
- 17.2.2. Back of The Eye Disorders Market in Europe for Small Molecules, Historical Trends (since 2017) and Forecasted Estimates (till 2035)
- 17.3. Back of The Eye Disorders Market in Europe: Distribution by Target Indication
- 17.3.1. Back of The Eye Disorders Market in Europe for Diabetic Macular Edema, Historical Trends (Since 2017) and Forecasted Estimates (Till 2035)
- 17.3.2. Back of The Eye Disorders Market in Europe for Neovascular (Wet) Age-Related Macular Degeneration, Historical Trends (Since 2017) and Forecasted Estimates (Till 2035)
- 17.3.3. Back of The Eye Disorders Market in Europe for Diabetic Retinopathy, Historical Trends (Since 2017) and Forecasted Estimates (Till 2035)
- 17.3.4. Back of The Eye Disorders Market in Europe for Glaucoma, Historical Trends (Since 2017) and Forecasted Estimates (Till 2035)
- 17.3.5. Back of The Eye Disorders Market in Europe for Geographic Atrophy, Historical Trends (Since 2017) and Forecasted Estimates (Till 2035)
- 17.3.6. Back of The Eye Disorders Market in Europe for Uveal Melanoma, Historical Trends (Since 2017) and Forecasted Estimates (Till 2035)
- 17.3.7. Back of The Eye Disorders Market in Europe for Retinal Vein Occlusion, Historical Trends (Since 2017) and Forecasted Estimates (Till 2035)
- 17.3.8. Back of The Eye Disorders Market in Europe for Uveitic Macular Edema, Historical Trends (Since 2017) and Forecasted Estimates (Till 2035)
- 17.3.9. Back of The Eye Disorders Market in Europe for Choroidal Neovascularization, Historical Trends (Since 2017) and Forecasted Estimates (Till 2035)
- 17.3.10. Back of The Eye Disorders Market in Europe for Biallelic RPE65 mutation-associated Retinal Dystrophy, Historical Trends (Since 2017) and Forecasted Estimates (Till 2035)
- 17.3.11. Back of The Eye Disorders Market in Europe for Retinopathy of Prematurity, Historical Trends (Since 2017) and Forecasted Estimates (Till 2035)
- 17.3.12. Back of The Eye Disorders Market in Europe for Leber's Hereditary Optic Neuropathy, Historical Trends (Since 2017) and Forecasted Estimates (Till 2035)
18. BACK OF THE EYE DISORDERS MARKET: ASIA-PACIFIC
- 18.1. Back of The Eye Disorders Market in Asia-Pacific: Distribution by Scale of Operation
- 18.1.1. Back of The Eye Disorders Market in Asia-Pacific at Clinical Scale, Forecasted Estimates (till 2035)
- 18.1.2. Back of The Eye Disorders Market in Asia-Pacific at Commercial Scale, Historical Trends (since 2022) and Forecasted Estimates (till 2035)
- 18.2. Back of The Eye Disorders Market in Asia-Pacific: Distribution by Type of Molecule
- 18.2.1. Back of The Eye Disorders Market in Asia-Pacific for Biologics, Historical Trends (since 2022) and Forecasted Estimates (till 2035)
- 18.2.2. Back of The Eye Disorders Market in Asia-Pacific for Small Molecules, Historical Trends (since 2022) and Forecasted Estimates (till 2035)
- 18.3. Back of The Eye Disorders Market in Asia-Pacific: Distribution by Target Indication
- 18.3.1. Back of The Eye Disorders Market in Asia-Pacific for Diabetic Macular Edema, Historical Trends (Since 2022) and Forecasted Estimates (Till 2035)
- 18.3.2. Back of The Eye Disorders Market in Asia-Pacific for Neovascular (Wet) Age-Related Macular Degeneration, Historical Trends (Since 2022) and Forecasted Estimates (Till 2035)
- 18.3.3. Back of The Eye Disorders Market in Asia-Pacific for Diabetic Retinopathy, Historical Trends (Since 2022) and Forecasted Estimates (Till 2035)
- 18.3.4. Back of The Eye Disorders Market in Asia-Pacific for Glaucoma, Historical Trends (Since 2022) and Forecasted Estimates (Till 2035)
- 18.3.5. Back of The Eye Disorders Market in Asia-Pacific for Geographic Atrophy, Historical Trends (Since 2022) and Forecasted Estimates (Till 2035)
- 18.3.6. Back of The Eye Disorders Market in Asia-Pacific for Uveal Melanoma, Historical Trends (Since 2022) and Forecasted Estimates (Till 2035)
- 18.3.7. Back of The Eye Disorders Market in Asia-Pacific for Retinal Vein Occlusion, Historical Trends (Since 2022) and Forecasted Estimates (Till 2035)
- 18.3.8. Back of The Eye Disorders Market in Asia-Pacific for Uveitic Macular Edema, Historical Trends (Since 2022) and Forecasted Estimates (Till 2035)
- 18.3.9. Back of The Eye Disorders Market in Asia-Pacific for Choroidal Neovascularization, Historical Trends (Since 2022) and Forecasted Estimates (Till 2035)
- 18.3.10. Back of The Eye Disorders Market in Asia-Pacific for Biallelic RPE65 mutation-associated Retinal Dystrophy, Historical Trends (Since 2022) and Forecasted Estimates (Till 2035)
- 18.3.11. Back of The Eye Disorders Market in Asia-Pacific for Retinopathy of Prematurity, Historical Trends (Since 2022) and Forecasted Estimates (Till 2035)
- 18.3.12. Back of The Eye Disorders Market in Asia-Pacific for Leber's Hereditary Optic Neuropathy, Historical Trends (Since 2022) and Forecasted Estimates (Till 2035)
19. BACK OF THE EYE DISORDERS MARKET: MIDDLE EAST AND NORTH AFRICA
- 19.1. Back of The Eye Disorders Market in Middle East and North Africa: Distribution by Scale of Operation
- 19.1.1. Back of The Eye Disorders Market in Middle East and North Africa at Clinical Scale, Forecasted Estimates (till 2035)
- 19.1.2. Back of The Eye Disorders Market in Middle East and North Africa at Commercial Scale, Historical Trends (since 2022) and Forecasted Estimates (till 2035)
- 19.2. Back of The Eye Disorders Market in Middle East and North Africa: Distribution by Type of Molecule
- 19.2.1. Back of The Eye Disorders Market in Middle East and North Africa for Biologics, Historical Trends (since 2022) and Forecasted Estimates (till 2035)
- 19.2.2. Back of The Eye Disorders Market in Middle East and North Africa for Small Molecules, Historical Trends (since 2022) and Forecasted Estimates (till 2035)
- 19.3. Back of The Eye Disorders Market in Middle East and North Africa: Distribution by Target Indication
- 19.3.1. Back of The Eye Disorders Market in Middle East and North Africa for Diabetic Macular Edema, Historical Trends (Since 2022) and Forecasted Estimates (Till 2035)
- 19.3.2. Back of The Eye Disorders Market in Middle East and North Africa for Neovascular (Wet) Age-Related Macular Degeneration, Historical Trends (Since 2022) and Forecasted Estimates (Till 2035)
- 19.3.3. Back of The Eye Disorders Market in Middle East and North Africa for Diabetic Retinopathy, Historical Trends (Since 2022) and Forecasted Estimates (Till 2035)
- 19.3.4. Back of The Eye Disorders Market in Middle East and North Africa for Glaucoma, Historical Trends (Since 2022) and Forecasted Estimates (Till 2035)
- 19.3.5. Back of The Eye Disorders Market in Middle East and North Africa for Geographic Atrophy, Historical Trends (Since 2022) and Forecasted Estimates (Till 2035)
- 19.3.6. Back of The Eye Disorders Market in Middle East and North Africa for Uveal Melanoma, Historical Trends (Since 2022) and Forecasted Estimates (Till 2035)
- 19.3.7. Back of The Eye Disorders Market in Middle East and North Africa for Retinal Vein Occlusion, Historical Trends (Since 2022) and Forecasted Estimates (Till 2035)
- 19.3.8. Back of The Eye Disorders Market in Middle East and North Africa for Uveitic Macular Edema, Historical Trends (Since 2022) and Forecasted Estimates (Till 2035)
- 19.3.9. Back of The Eye Disorders Market in Middle East and North Africa for Choroidal Neovascularization, Historical Trends (Since 2022) and Forecasted Estimates (Till 2035)
- 19.3.10. Back of The Eye Disorders Market in Middle East and North Africa for Biallelic RPE65 mutation-associated Retinal Dystrophy, Historical Trends (Since 2022) and Forecasted Estimates (Till 2035)
- 19.3.11. Back of The Eye Disorders Market in Middle East and North Africa for Retinopathy of Prematurity, Historical Trends (Since 2022) and Forecasted Estimates (Till 2035)
- 19.3.12. Back of The Eye Disorders Market in Middle East and North Africa for Leber's Hereditary Optic Neuropathy, Historical Trends (Since 2022) and Forecasted Estimates (Till 2035)
20. BACK OF THE EYE DISORDERS MARKET: LATIN AMERICA
- 20.1. Back of The Eye Disorders Market in Latin America: Distribution by Scale of Operation
- 20.1.1. Back of The Eye Disorders Market in Latin America at Clinical Scale, Forecasted Estimates (till 2035)
- 20.1.2. Back of The Eye Disorders Market in Latin America at Commercial Scale, Historical Trends (since 2022) and Forecasted Estimates (till 2035)
- 20.2. Back of The Eye Disorders Market in Latin America: Distribution by Type of Molecule
- 20.2.1. Back of The Eye Disorders Market in Latin America for Biologics, Historical Trends (since 2022) and Forecasted Estimates (till 2035)
- 20.2.2. Back of The Eye Disorders Market in Latin America for Small Molecules, Historical Trends (since 2022) and Forecasted Estimates (till 2035)
- 20.3. Back of The Eye Disorders Market in Latin America: Distribution by Target Indication
- 20.3.1. Back of The Eye Disorders Market in Latin America for Diabetic Macular Edema, Historical Trends (Since 2022) and Forecasted Estimates (Till 2035)
- 20.3.2. Back of The Eye Disorders Market in Latin America for Neovascular (Wet) Age-Related Macular Degeneration, Historical Trends (Since 2022) and Forecasted Estimates (Till 2035)
- 20.3.3. Back of The Eye Disorders Market in Latin America for Diabetic Retinopathy, Historical Trends (Since 2022) and Forecasted Estimates (Till 2035)
- 20.3.4. Back of The Eye Disorders Market in Latin America for Glaucoma, Historical Trends (Since 2022) and Forecasted Estimates (Till 2035)
- 20.3.5. Back of The Eye Disorders Market in Latin America for Geographic Atrophy, Historical Trends (Since 2022) and Forecasted Estimates (Till 2035)
- 20.3.6. Back of The Eye Disorders Market in Latin America for Uveal Melanoma, Historical Trends (Since 2022) and Forecasted Estimates (Till 2035)
- 20.3.7. Back of The Eye Disorders Market in Latin America for Retinal Vein Occlusion, Historical Trends (Since 2022) and Forecasted Estimates (Till 2035)
- 20.3.8. Back of The Eye Disorders Market in Latin America for Uveitic Macular Edema, Historical Trends (Since 2022) and Forecasted Estimates (Till 2035)
- 20.3.9. Back of The Eye Disorders Market in Latin America for Choroidal Neovascularization, Historical Trends (Since 2022) and Forecasted Estimates (Till 2035)
- 20.3.10. Back of The Eye Disorders Market in Latin America for Biallelic RPE65 mutation-associated Retinal Dystrophy, Historical Trends (Since 2022) and Forecasted Estimates (Till 2035)
- 20.3.11. Back of The Eye Disorders Market in Latin America for Retinopathy of Prematurity, Historical Trends (Since 2022) and Forecasted Estimates (Till 2035)
- 20.3.12. Back of The Eye Disorders Market in Latin America for Leber's Hereditary Optic Neuropathy, Historical Trends (Since 2022) and Forecasted Estimates (Till 2035)
- *Detailed information on Chapters 16 to 20 is available in the Excel Data Packs shared along with the report**
21. BACK OF THE EYE DISORDERS MARKET, BY KEY PLAYERS
22. BACK OF THE EYE DISORDERS MARKET, SALES FORECAST OF COMMERCIALIZED DRUGS
- 22.1. Back of the Eye Disorders Market: Commercialized Drug Sales Forecast
- 22.1.1. ALPHAGAN(R) P / COMBIGAN(R) Franchise
- 22.1.2. AZARGA(R)
- 22.1.3. Beovu(R) (brolucizumab) / RTH258
- 22.1.4. Duotrav(TM)
- 22.1.5. Eylea HD(R) (aflibercept)
- 22.1.6. Eylea(R) (aflibercept)
- 22.1.7. IZERVAY(TM)
- 22.1.8. KIMMTRAK(R) (tebentafusp-tebn)
- 22.1.9. Latanoprost / DE-130A / (Catioprost) / Catiolanze(R)
- 22.1.10. Lucentis(R) / Ranibizumab
- 22.1.11. Lumigan/Ganfort
- 22.1.12. Lumitin(R) (Conbercept Ophthalmic Solution) / KH902
- 22.1.13. LUXTURNA(R) (voretigene neparvovec-rzyl)
- 22.1.14. NCX 470 / OT-301 / K-911
- 22.1.15. Omidenepag / Isopropyl / OMLONTI(R) / Eybelis / DE-117
- 22.1.16. ONS-5010 / LYTENAVA(TM)
- 22.1.17. Raxone(R) / Idebenone
- 22.1.18. Rhopressa(R) + ROCKLATAN(TM)
- 22.1.19. Sepetaprost / DE-126 / SETANEO(R) Ophthalmic Solution
- 22.1.20. Simbrinza(R)
- 22.1.21. SYFOVRE(R) (pegcetacoplan injection)
- 22.1.22. Tafluprost / Timolol Maleate / TAPCOM Combination Ophthalmic Solution
- 22.1.23. Travatan Z(R) / Travoprost
- 22.1.24. Vabysmo (faricimab-sova, RG7716)
- 22.1.25. VYZULTA(R)
- 22.1.26. XIPERE(R) / ARCATUS(R) / ARVN001
23. CONCLUDING REMARKS
24. EXECUTIVE INSIGHTS
- 24.1. Chapter Overview
- 24.2. Company A
- 24.2.1. Interview Transcript: Former Chief Executive Officer
- 24.3. Company B
- 24.3.1. Interview Transcript: Former Senior Vice President
- 24.4. Company C
- 24.4.1. Interview Transcript: Former President and Chief Executive Officer
- 24.5. Company D
- 24.5.1. Interview Transcript: Postdoctoral Researcher
- 24.6. Company E
- 24.6.1. Interview Transcript: Assistant Professor
- 24.7. Company F
- 24.7.1. Interview Transcript: Associate Professor & Senior Consultant
25. APPENDIX 1: TABULATED DATA
26. APPENDIX 2: LIST OF COMPANIES AND ORGANIZATIONS
List of Tables
- Table 7.1 Back of the Eye Disorders Market: List of Drugs
- Table 7.2 Back of the Eye Disorders Market: List of Drug Developers
- Table 11.1 Back of the Eye Disorders Market: List of Forecasted Drugs
- Table 25.1 Back of the Eye Disorders Market: Drugs Landscape: Distribution by Stage of Development
- Table 25.2 Back of the Eye Disorders Market: Drugs Landscape: Distribution by Type of Molecule
- Table 25.3 Back of the Eye Disorders Market: Drugs Landscape: Distribution by Mechanism of Action
- Table 25.4 Back of the Eye Disorders Market: Drugs Landscape: Distribution by Dosing Frequency
- Table 25.5 Back of the Eye Disorders Market: Drugs Landscape: Distribution by Route of Administration
- Table 25.6 Back of the Eye Disorders Market: Drugs Landscape: Distribution by Target Indication
- Table 25.7 Back of the Eye Disorders Market: Drugs Landscape: Distribution by Type of Therapy
- Table 25.8 Back of the Eye Disorders Market: Drugs Landscape: Distribution by Drug Designation
- Table 25.9 Gene and Cell Therapy-based Back of the Eye Disorders Related Drugs Landscape: Distribution by Stage of Development
- Table 25.10 Gene and Cell Therapy-based Back of the Eye Disorders Related Drugs Landscape: Distribution by Dosing Frequency
- Table 25.11 Gene and Cell Therapy-based Back of the Eye Disorders Related Drugs Landscape: Distribution by Target Indication
- Table 25.12 Gene and Cell Therapy-based Back of the Eye Disorders Related Drugs Landscape: Distribution by Route of Administration
- Table 25.13 Gene and Cell Therapy-based Back of the Eye Disorders Related Drugs Landscape: Distribution by Type of Therapy
- Table 25.14 Small Molecule-based Back of the Eye Disorders Related Drugs Landscape: Distribution by Stage of Development
- Table 25.15 Small Molecule-based Back of the Eye Disorders Related Drugs Landscape: Distribution by Dosing Frequency
- Table 25.16 Small Molecule-based Back of the Eye Disorders Related Drugs Landscape: Distribution by Target Indication
- Table 25.17 Small Molecule-based Back of the Eye Disorders Related Drugs Landscape: Distribution by Route of Administration
- Table 25.18 Small Molecule-based Back of the Eye Disorders Related Drugs Landscape: Distribution by Type of Therapy
- Table 25.19 Antibody-based Back of the Eye Disorders Related Drugs Landscape: Distribution by Stage of Development
- Table 25.20 Antibody-based Back of the Eye Disorders Related Drugs Landscape: Distribution by Dosing Frequency
- Table 25.21 Antibody-based Back of the Eye Disorders Related Drugs Landscape: Distribution by Target Indication
- Table 25.22 Antibody-based Back of the Eye Disorders Related Drugs Landscape: Distribution by Route of Administration
- Table 25.23 Antibody-based Back of the Eye Disorders Related Drugs Landscape: Distribution by Type of Therapy
- Table 25.24 Protein-based Back of the Eye Disorders Related Drugs Landscape: Distribution by Stage of Development
- Table 25.25 Protein-based Back of the Eye Disorders Related Drugs Landscape: Distribution by Dosing Frequency
- Table 25.26 Protein-based Back of the Eye Disorders Related Drugs Landscape: Distribution by Target Indication
- Table 25.27 Protein-based Back of the Eye Disorders Related Drugs Landscape: Distribution by Route of Administration
- Table 25.28 Protein-based Back of the Eye Disorders Related Drugs Landscape: Distribution by Type of Therapy
- Table 25.29 Peptide-based Back of the Eye Disorders Related Drugs Landscape: Distribution by Stage of Development
- Table 25.30 Peptide-based Back of the Eye Disorders Related Drugs Landscape: Distribution by Dosing Frequency
- Table 25.31 Peptide-based Back of the Eye Disorders Related Drugs Landscape: Distribution by Target Indication
- Table 25.32 Peptide-based Back of the Eye Disorders Related Drugs Landscape: Distribution by Route of Administration
- Table 25.33 Peptide-based Back of the Eye Disorders Related Drugs Landscape: Distribution by Type of Therapy
- Table 25.34 Back of the Eye Disorders (Developers Landscape): Distribution by Year of Establishment
- Table 25.35 Back of the Eye Disorders (Developers Landscape): Distribution by Company Size
- Table 25.36 Back of the Eye Disorders (Developers Landscape): Distribution by Location of Headquarters
- Table 25.37 Back of the Eye Disorders (Developers Landscape): Distribution by Company Size and Location of Headquarters
- Table 25.38 Most Active Players: Distribution by Number of Drugs
- Table 25.39 Back of the Eye Disorders Market, Historical Trends (Since 2022) and Forecasted Estimates (Till 2035) (USD Billion)
- Table 25.40 Back of the Eye Disorders Market, Forecasted Estimates (Till 2035): Conservative Scenario (USD Billion)
- Table 25.41 Back of the Eye Disorders Market, Forecasted Estimates (Till 2035): Optimistic Scenario (USD Billion)
- Table 25.42 Back of The Eye Disorders Market: Distribution by Scale of Operation
- Table 25.43 Back of The Eye Disorders Market at Clinical Scale, Forecasted Estimates (Till 2035): Conservative, Base and Optimistic Scenario (USD Billion)
- Table 25.44 Back of The Eye Disorders Market at Commercial Scale, Historical Trends (Since 2022) and Forecasted Estimates (Till 2035): Conservative, Base and Optimistic Scenario (USD Billion)
- Table 25.45 Back of The Eye Disorders Market: Distribution by Type of Molecule
- Table 25.46 Back of The Eye Disorders Market for Biologics, Historical Trends (Since 2022) and Forecasted Estimates (Till 2035): Conservative, Base and Optimistic Scenario (USD Billion)
- Table 25.47 Back of The Eye Disorders Market for Small Molecules, Historical Trends (Since 2022) and Forecasted Estimates (Till 2035): Conservative, Base and Optimistic Scenario (USD Billion)
- Table 25.48 Back of The Eye Disorders Market: Distribution by Target Indication
- Table 25.49 Back of The Eye Disorders Market for Diabetic Macular Edema, Historical Trends (Since 2022) and Forecasted Estimates (Till 2035): Conservative, Base and Optimistic Scenario (USD Billion)
- Table 25.50 Back of The Eye Disorders Market for Neovascular (Wet) Age-Related Macular Degeneration, Historical Trends (Since 2022) and Forecasted Estimates (Till 2035): Conservative, Base and Optimistic Scenario (USD Billion)
- Table 25.51 Back of The Eye Disorders Market for Diabetic Retinopathy, Historical Trends (Since 2022) and Forecasted Estimates (Till 2035): Conservative, Base and Optimistic Scenario (USD Billion)
- Table 25.52 Back of The Eye Disorders Market for Glaucoma, Historical Trends (Since 2022) and Forecasted Estimates (Till 2035): Conservative, Base and Optimistic Scenario (USD Billion)
- Table 25.53 Back of The Eye Disorders Market for Geographic Atrophy, Historical Trends (Since 2022) and Forecasted Estimates (Till 2035): Conservative, Base and Optimistic Scenario (USDBillion)
- Table 25.54 Back of The Eye Disorders Market for Uveal Melanoma, Historical Trends (Since 2022) and Forecasted Estimates (Till 2035): Conservative, Base and Optimistic Scenario (USD Billion)
- Table 25.55 Back of The Eye Disorders Market for Retinal Vein Occlusion, Historical Trends (Since 2022) and Forecasted Estimates (Till 2035): Conservative, Base and Optimistic Scenario (USD Billion)
- Table 25.56 Back of The Eye Disorders Market for Uveitic Macular Edema, Historical Trends (Since 2022) and Forecasted Estimates (Till 2035): Conservative, Base and Optimistic Scenario (USD Billion)
- Table 25.57 Back of The Eye Disorders Market for Choroidal Neovascularization, Historical Trends (Since 2022) and Forecasted Estimates (Till 2035): Conservative, Base and Optimistic Scenario (USD Billion)
- Table 25.58 Back of The Eye Disorders Market for Biallelic RPE65 mutation-associated Retinal Dystrophy, Historical Trends (Since 2022) and Forecasted Estimates (Till 2035): Conservative, Base and Optimistic Scenario (USD Billion)
- Table 25.59 Back of The Eye Disorders Market for Retinopathy of Prematurity, Historical Trends (Since 2022) and Forecasted Estimates (Till 2035): Conservative, Base and Optimistic Scenario (USD Billion)
- Table 25.60 Back of The Eye Disorders Market for Leber's Hereditary Optic Neuropathy, Historical Trends (Since 2022) and Forecasted Estimates (Till 2035): Conservative, Base and Optimistic Scenario (USD Billion)
- Table 25.61 Back of the Eye Disorders Market: Distribution by Geographical Regions
- Table 25.62 Back of the Eye Disorders Market in North America: Historical Trends (Since 2022) and Forecasted Estimates (Till 2035): Conservative, Base and Optimistic Scenario (USD Billion)
- Table 25.63 Back of the Eye Disorders Market in the US: Historical Trends (Since 2022) and Forecasted Estimates (Till 2035): Conservative, Base and Optimistic Scenario (USD Billion)
- Table 25.64 Back of the Eye Disorders Market in Canada: Historical Trends (Since 2022) and Forecasted Estimates (Till 2035): Conservative, Base and Optimistic Scenario (USD Billion))
- Table 25.65 Back of the Eye Disorders Market in Europe: Historical Trends (Since 2022) and Forecasted Estimates (Till 2035): Conservative, Base and Optimistic Scenario (USD Billion)
- Table 25.66 Back of the Eye Disorders Market in Germany: Historical Trends (Since 2022) and Forecasted Estimates (Till 2035): Conservative, Base and Optimistic Scenario (USD Billion)
- Table 25.67 Back of the Eye Disorders Market in the UK: Historical Trends (Since 2022) and Forecasted Estimates (Till 2035): Conservative, Base and Optimistic Scenario (USD Billion)
- Table 25.68 Back of the Eye Disorders Market in France: Historical Trends (Since 2022) and Forecasted Estimates (Till 2035): Conservative, Base and Optimistic Scenario (USD Billion)
- Table 25.69 Back of the Eye Disorders Market in Italy: Historical Trends (Since 2022) and Forecasted Estimates (Till 2035): Conservative, Base and Optimistic Scenario (USD Billion)
- Table 25.70 Back of the Eye Disorders Market in Spain: Historical Trends (Since 2022) and Forecasted Estimates (Till 2035): Conservative, Base and Optimistic Scenario (USD Billion)
- Table 25.71 Back of the Eye Disorders Market in Rest of Europe: Historical Trends (Since 2022) and Forecasted Estimates (Till 2035): Conservative, Base and Optimistic Scenario (USD Billion)
- Table 25.72 Back of The Eye Disorders Market in Asia-Pacific, Historical Trends (Since 2022) and Forecasted Estimates (Till 2035): Conservative, Base and Optimistic Scenario (USD Billion)
- Table 25.73 Back of The Eye Disorders Market in China, Historical Trends (Since 2022) and Forecasted Estimates (Till 2035): Conservative, Base and Optimistic Scenario (USD Billion)
- Table 25.74 Back of The Eye Disorders Market in Japan, Historical Trends (Since 2022) and Forecasted Estimates (Till 2035): Conservative, Base and Optimistic Scenario (USD Billion)
- Table 25.75 Back of The Eye Disorders Market in India, Historical Trends (Since 2022) and Forecasted Estimates (Till 2035): Conservative, Base and Optimistic Scenario (USD Billion)
- Table 25.76 Back of The Eye Disorders Market in South Korea, Historical Trends (Since 2022) and Forecasted Estimates (Till 2035): Conservative, Base and Optimistic Scenario (USD Billion)
- Table 25.77 Back of The Eye Disorders Market in Australia, Historical Trends (Since 2022) and Forecasted Estimates (Till 2035): Conservative, Base and Optimistic Scenario (USD Billion)
- Table 25.78 Back of The Eye Disorders Market in Rest of Asia-Pacific, Historical Trends (Since 2022) and Forecasted Estimates (Till 2035): Conservative, Base and Optimistic Scenario (USD Billion)
- Table 25.79 Back of The Eye Disorders Market in Middle East and North Africa, Historical Trends (Since 2022) and Forecasted Estimates (Till 2035): Conservative, Base and Optimistic Scenario (USD Billion)
- Table 25.80 Back of The Eye Disorders Market in Saudi Arabia, Historical Trends (Since 2022) and Forecasted Estimates (Till 2035): Conservative, Base and Optimistic Scenario (USD Billion)
- Table 25.81 Back of The Eye Disorders Market in Egypt, Historical Trends (Since 2022) and Forecasted Estimates (Till 2035): Conservative, Base and Optimistic Scenario (USD Billion)
- Table 25.82 Back of The Eye Disorders Market in Rest of Middle East and North Africa, Historical Trends (Since 2022) and Forecasted Estimates (Till 2035): Conservative, Base and Optimistic Scenario (USD Billion)
- Table 25.83 Back of The Eye Disorders Market in Latin America, Historical Trends (Since 2022) and Forecasted Estimates (Till 2035): Conservative, Base and Optimistic Scenario (USD Billion)
- Table 25.84 Back of The Eye Disorders Market in Brazil, Historical Trends (Since 2022) and Forecasted Estimates (Till 2035): Conservative, Base and Optimistic Scenario (USD Billion)
- Table 25.85 Back of The Eye Disorders Market in Argentina, Historical Trends (Since 2022) and Forecasted Estimates (Till 2035): Conservative, Base and Optimistic Scenario (USD Billion)
- Table 25.86 Back of The Eye Disorders Market in Rest of Latin America, Historical Trends (Since 2022) and Forecasted Estimates (Till 2035): Conservative, Base and Optimistic Scenario (USD Billion)
- Table 25.87 Back of the Eye Disorders Market: Distribution by Distribution by Key Players, 2026 (based on revenues generated)
- Table 25.88 Back of the Eye Disorders Market: Distribution by Distribution by Key Players, 2035 (based on forecasted revenues)
- Table 25.89 Back of the Eye Disorders Market for ALPHAGAN(R) P / COMBIGAN(R) Franchise, Historical Trends (Since 2022) and Forecasted Estimates (Till 2035): Conservative, Base and Optimistic Scenario (USD Million)
- Table 25.90 Back of the Eye Disorders Market for AZARGA(R), Historical Trends (Since 2022) and Forecasted Estimates (Till 2035): Conservative, Base and Optimistic Scenario (USD Million)
- Table 25.91 Back of the Eye Disorders Market for Beovu(R) (brolucizumab) / RTH258, Historical Trends (Since 2022) and Forecasted Estimates (Till 2035): Conservative, Base and Optimistic Scenario (USD Million)
- Table 25.92 Back of the Eye Disorders Market for Duotrav(TM), Historical Trends (Since 2022) and Forecasted Estimates (Till 2035): Conservative, Base and Optimistic Scenario (USD Million)
- Table 25.93 Back of the Eye Disorders Market for Eylea HD(R) (aflibercept), Historical Trends (Since 2023) and Forecasted Estimates (Till 2035): Conservative, Base and Optimistic Scenario (USD Million)
- Table 25.94 Back of the Eye Disorders Market for Eylea(R) (aflibercept), Historical Trends (Since 2022) and Forecasted Estimates (Till 2035): Conservative, Base and Optimistic Scenario (USD Million)
- Table 25.95 Back of the Eye Disorders Market for IZERVAY(TM), Historical Trends (Since 2023) and Forecasted Estimates (Till 2035): Conservative, Base and Optimistic Scenario (USD Million)
- Table 25.96 Back of the Eye Disorders Market for KIMMTRAK(R) (tebentafusp-tebn), Historical Trends (Since 2022) and Forecasted Estimates (Till 2035): Conservative, Base and Optimistic Scenario (USD Million)
- Table 25.97 Back of the Eye Disorders Market for Latanoprost / DE-130A / (Catioprost) / Catiolanze(R), Historical Trends (Since 2024) and Forecasted Estimates (Till 2035): Conservative, Base and Optimistic Scenario (USD Million)
- Table 25.98 Back of the Eye Disorders Market for Lucentis(R) / Ranibizumab, Historical Trends (Since 2022) and Forecasted Estimates (Till 2035): Conservative, Base and Optimistic Scenario (USD Million)
- Table 25.99 Back of the Eye Disorders Market for Lumigan/Ganfort, Historical Trends (Since 2022) and Forecasted Estimates (Till 2035): Conservative, Base and Optimistic Scenario (USD Million)
- Table 25.100 Back of the Eye Disorders Market for Lumitin(R) (Conbercept Ophthalmic Solution) / KH902, Historical Trends (Since 2022) and Forecasted Estimates (Till 2035): Conservative, Base and Optimistic Scenario (USD Million)
- Table 25.101 Back of the Eye Disorders Market for LUXTURNA(R) (voretigene neparvovec-rzyl), Historical Trends (Since 2022) and Forecasted Estimates (Till 2035): Conservative, Base and Optimistic Scenario (USD Million)
- Table 25.102 Back of the Eye Disorders Market for NCX 470 / OT-301 / K-911, Forecasted Estimates (Till 2035): Conservative, Base and Optimistic Scenario (USD Million)
- Table 25.103 Back of the Eye Disorders Market for Omidenepag / Isopropyl / OMLONTI(R) / Eybelis / DE-117, Historical Trends (Since 2022) and Forecasted Estimates (Till 2035): Conservative, Base and Optimistic Scenario (USD Million)
- Table 25.104 Back of the Eye Disorders Market for ONS-5010 / LYTENAVA(TM), Historical Trends (Since 2025) and Forecasted Estimates (Till 2035): Conservative, Base and Optimistic Scenario (USD Million)
- Table 25.105 Back of the Eye Disorders Market for Raxone(R) / Idebenone, Historical Trends (Since 2022) and Forecasted Estimates (Till 2035): Conservative, Base and Optimistic Scenario (USD Million)
- Table 25.106 Back of the Eye Disorders Market for Rhopressa(R) + ROCKLATAN(TM), Historical Trends (Since 2022) and Forecasted Estimates (Till 2035): Conservative, Base and Optimistic Scenario (USD Million)
- Table 25.107 Back of the Eye Disorders Market for Sepetaprost / DE-126 / SETANEO(R) Ophthalmic Solution, Historical Trends (Since 2025) and Forecasted Estimates (Till 2035): Conservative, Base and Optimistic Scenario (USD Million)
- Table 25.108 Back of the Eye Disorders Market for Simbrinza(R), Historical Trends (Since 2022) and Forecasted Estimates (Till 2035): Conservative, Base and Optimistic Scenario (USD Million)
- Table 25.109 Back of the Eye Disorders Market for SYFOVRE(R) (pegcetacoplan injection), Historical Trends (Since 2023) and Forecasted Estimates (Till 2035): Conservative, Base and Optimistic Scenario (USD Million)
- Table 25.110 Back of the Eye Disorders Market for Tafluprost / Timolol Maleate / TAPCOM Combination Ophthalmic Solution, Historical Trends (Since 2022) and Forecasted Estimates (Till 2035): Conservative, Base and Optimistic Scenario (USD Million)
- Table 25.111 Back of the Eye Disorders Market for Travatan Z(R) / Travoprost, Historical Trends (Since 2022) and Forecasted Estimates (Till 2035): Conservative, Base and Optimistic Scenario (USD Million)
- Table 25.112 Back of the Eye Disorders Market for Vabysmo (faricimab-sova, RG7716), Historical Trends (Since 2022) and Forecasted Estimates (Till 2035): Conservative, Base and Optimistic Scenario (USD Million)
- Table 25.113 Back of the Eye Disorders Market for VYZULTA(R), Historical Trends (Since 2023) and Forecasted Estimates (Till 2035): Conservative, Base and Optimistic Scenario (USD Million)
- Table 25.114 Back of the Eye Disorders Market for XIPERE(R) / ARCATUS(R) / ARVN001, Historical Trends (Since 2022) and Forecasted Estimates (Till 2035): Conservative, Base and Optimistic Scenario (USD Million)
List of Figures
- Figure 2.1 Research Methodology: Project Methodology
- Figure 2.2 Research Methodology: Data Sources for Secondary Research
- Figure 2.3 Research Methodology: Robust Quality Control
- Figure 3.1 Market Dynamics: Forecast Methodology
- Figure 3.2 Market Dynamics: Market Assessment Framework
- Figure 4.1 Lessons Learnt from Past Recessions
- Figure 5.1 Executive Summary: Market Landscape
- Figure 5.2 Executive Summary: Market Sizing and Opportunity Analysis
- Figure 6.1 Prominent Back of the Eye Disorders
- Figure 6.2 Factors Contributing to Back of the Eye Disorders
- Figure 6.3 Signs and Symptoms of Back of the Eye Disorders
- Figure 7.1 Back of the Eye Disorders Market: Drugs Landscape: Distribution by Stage of Development
- Figure 7.2 Back of the Eye Disorders Market: Drugs Landscape: Distribution by Type of Molecule
- Figure 7.3 Back of the Eye Disorders Market: Drugs Landscape: Distribution by Mechanism of Action
- Figure 7.4 Back of the Eye Disorders Market: Drugs Landscape: Distribution by Dosing Frequency
- Figure 7.5 Back of the Eye Disorders Market: Drugs Landscape: Distribution by Route of Administration
- Figure 7.6 Back of the Eye Disorders Market: Drugs Landscape: Distribution by Target Indication
- Figure 7.7 Back of the Eye Disorders Market: Drugs Landscape: Distribution by Type of Therapy
- Figure 7.8 Back of the Eye Disorders Market: Drugs Landscape: Distribution by Drug Designation
- Figure 7.9 Gene and Cell Therapy-based Back of the Eye Disorders Related Drugs Landscape: Distribution by Stage of Development
- Figure 7.10 Gene and Cell Therapy-based Back of the Eye Disorders Related Drugs Landscape: Distribution by Dosing Frequency
- Figure 7.11 Gene and Cell Therapy-based Back of the Eye Disorders Related Drugs Landscape: Distribution by Target Indication
- Figure 7.12 Gene and Cell Therapy-based Back of the Eye Disorders Related Drugs Landscape: Distribution by Route of Administration
- Figure 7.13 Gene and Cell Therapy-based Back of the Eye Disorders Related Drugs Landscape: Distribution by Type of Therapy
- Figure 7.14 Small Molecule-based Back of the Eye Disorders Related Drugs Landscape: Distribution by Stage of Development
- Figure 7.15 Small Molecule-based Back of the Eye Disorders Related Drugs Landscape: Distribution by Dosing Frequency
- Figure 7.16 Small Molecule-based Back of the Eye Disorders Related Drugs Landscape: Distribution by Target Indication
- Figure 7.17 Small Molecule-based Back of the Eye Disorders Related Drugs Landscape: Distribution by Route of Administration
- Figure 7.18 Small Molecule-based Back of the Eye Disorders Related Drugs Landscape: Distribution by Type of Therapy
- Figure 7.19 Antibody-based Back of the Eye Disorders Related Drugs Landscape: Distribution by Stage of Development
- Figure 7.20 Antibody-based Back of the Eye Disorders Related Drugs Landscape: Distribution by Dosing Frequency
- Figure 7.21 Antibody-based Back of the Eye Disorders Related Drugs Landscape: Distribution by Target Indication
- Figure 7.22 Antibody-based Back of the Eye Disorders Related Drugs Landscape: Distribution by Route of Administration
- Figure 7.23 Antibody-based Back of the Eye Disorders Related Drugs Landscape: Distribution by Type of Therapy
- Figure 7.24 Protein-based Back of the Eye Disorders Related Drugs Landscape: Distribution by Stage of Development
- Figure 7.25 Protein-based Back of the Eye Disorders Related Drugs Landscape: Distribution by Dosing Frequency
- Figure 7.26 Protein-based Back of the Eye Disorders Related Drugs Landscape: Distribution by Target Indication
- Figure 7.27 Protein-based Back of the Eye Disorders Related Drugs Landscape: Distribution by Route of Administration
- Figure 7.28 Protein-based Back of the Eye Disorders Related Drugs Landscape: Distribution by Type of Therapy
- Figure 7.29 Peptide-based Back of the Eye Disorders Related Drugs Landscape: Distribution by Stage of Development
- Figure 7.30 Peptide-based Back of the Eye Disorders Related Drugs Landscape: Distribution by Dosing Frequency
- Figure 7.31 Peptide-based Back of the Eye Disorders Related Drugs Landscape: Distribution by Target Indication
- Figure 7.32 Peptide-based Back of the Eye Disorders Related Drugs Landscape: Distribution by Route of Administration
- Figure 7.33 Peptide-based Back of the Eye Disorders Related Drugs Landscape: Distribution by Type of Therapy
- Figure 7.34 Back of the Eye Disorders (Developers Landscape): Distribution by Year of Establishment
- Figure 7.35 Back of the Eye Disorders (Developers Landscape): Distribution by Company Size
- Figure 7.36 Back of the Eye Disorders (Developers Landscape): Distribution by Location of Headquarters
- Figure 7.37 Back of the Eye Disorders (Developers Landscape): Distribution by Company Size and Location of Headquarters
- Figure 7.38 Most Active Players: Distribution by Number of Drugs
- Figure 8.1 Back of the Eye Disorders Drug Developers based in North America: Distribution by Company Size
- Figure 8.2 Back of the Eye Disorders Drug Developers based in North America: Distribution by Stage of Development
- Figure 8.3 Back of the Eye Disorders Drug Developers based in North America: Distribution by Type of Molecule
- Figure 8.4 Competitive Analysis of Developers based in North America
- Figure 8.5 Back of the Eye Disorders Drug Developers based in Europe: Distribution by Company Size
- Figure 8.6 Back of the Eye Disorders Drug Developers based in Europe: Distribution by Type of Molecule
- Figure 8.7 Competitive Analysis of Developers based in Europe
- Figure 8.8 Back of the Eye Disorders Drug Developers based in Asia-Pacific and Rest of the World: Distribution by Company Size
- Figure 8.9 Back of the Eye Disorders Drug Developers based in Asia-Pacific and Rest of the World: Distribution by Stage of Development
- Figure 8.10 Back of the Eye Disorders Drug Developers based in Asia-Pacific and Rest of the World: Distribution by Type of Molecule
- Figure 8.11 Competitive Analysis of Developers based in Asia-Pacific and Rest of the World
- Figure 10.1 Drivers v/s Restraints
- Figure 10.2 Opportunities v/s Challenges
- Figure 11.1 Back of the Eye Disorders Market, Historical Trends (Since 2022) and Forecasted Estimates (Till 2035) (USD Billion)
- Figure 11.2 Back of the Eye Disorders Market, Forecasted Estimates (Till 2035): Conservative Scenario (USD Billion)
- Figure 11.3 Back of the Eye Disorders Market, Forecasted Estimates (Till 2035): Optimistic Scenario (USD Billion)
- Figure 12.1 Back of The Eye Disorders Market: Distribution by Scale of Operation
- Figure 12.2 Back of The Eye Disorders Market at Clinical Scale, Forecasted Estimates (Till 2035) (USD Billion)
- Figure 12.3 Back of The Eye Disorders Market at Commercial Scale, Historical Trends (Since 2022) and Forecasted Estimates (Till 2035) (USD Billion)
- Figure 13.1 Back of The Eye Disorders Market: Distribution by Type of Molecule
- Figure 13.2 Back of The Eye Disorders Market for Biologics, Historical Trends (Since 2022) and Forecasted Estimates (Till 2035) (USD Billion)
- Figure 13.3 Back of The Eye Disorders Market for Small Molecules, Historical Trends (Since 2022) and Forecasted Estimates (Till 2035) (USD Billion)
- Figure 14.1 Back of The Eye Disorders Market: Distribution by Target Indication
- Figure 14.2 Back of The Eye Disorders Market for Diabetic Macular Edema, Historical Trends (Since 2022) and Forecasted Estimates (Till 2035) (USD Billion)
- Figure 14.3 Back of The Eye Disorders Market for Neovascular (Wet) Age-Related Macular Degeneration, Historical Trends (Since 2022) and Forecasted Estimates (Till 2035) (USD Billion)
- Figure 14.4 Back of The Eye Disorders Market for Diabetic Retinopathy, Historical Trends (Since 2022) and Forecasted Estimates (Till 2035) (USD Billion)
- Figure 14.5 Back of The Eye Disorders Market for Glaucoma, Historical Trends (Since 2022) and Forecasted Estimates (Till 2035) (USD Billion)
- Figure 14.6 Back of The Eye Disorders Market for Geographic Atrophy, Historical Trends (Since 2022) and Forecasted Estimates (Till 2035) (USDBillion)
- Figure 14.7 Back of The Eye Disorders Market for Uveal Melanoma, Historical Trends (Since 2022) and Forecasted Estimates (Till 2035) (USD Billion)
- Figure 14.8 Back of The Eye Disorders Market for Retinal Vein Occlusion, Historical Trends (Since 2022) and Forecasted Estimates (Till 2035) (USD Billion)
- Figure 14.9 Back of The Eye Disorders Market for Uveitic Macular Edema, Historical Trends (Since 2022) and Forecasted Estimates (Till 2035) (USD Billion)
- Figure 14.10 Back of The Eye Disorders Market for Choroidal Neovascularization, Historical Trends (Since 2022) and Forecasted Estimates (Till 2035) (USD Billion)
- Figure 14.11 Back of The Eye Disorders Market for Biallelic RPE65 mutation-associated Retinal Dystrophy, Historical Trends (Since 2022) and Forecasted Estimates (Till 2035) (USD Billion)
- Figure 14.12 Back of The Eye Disorders Market for Retinopathy of Prematurity, Historical Trends (Since 2022) and Forecasted Estimates (Till 2035) (USD Billion)
- Figure 14.13 Back of The Eye Disorders Market for Leber's Hereditary Optic Neuropathy, Historical Trends (Since 2022) and Forecasted Estimates (Till 2035) (USD Billion)
- Figure 15.1 Back of the Eye Disorders Market: Distribution by Geographical Regions
- Figure 15.2 Back of the Eye Disorders Market in North America: Historical Trends (Since 2022) and Forecasted Estimates (Till 2035) (USD Billion)
- Figure 15.3 Back of the Eye Disorders Market in the US: Historical Trends (Since 2022) and Forecasted Estimates (Till 2035) (USD Billion)
- Figure 15.4 Back of the Eye Disorders Market in Canada: Historical Trends (Since 2022) and Forecasted Estimates (Till 2035) (USD Billion))
- Figure 15.5 Back of the Eye Disorders Market in Europe: Historical Trends (Since 2022) and Forecasted Estimates (Till 2035) (USD Billion)
- Figure 15.6 Back of the Eye Disorders Market in Germany: Historical Trends (Since 2022) and Forecasted Estimates (Till 2035) (USD Billion)
- Figure 15.7 Back of the Eye Disorders Market in the UK: Historical Trends (Since 2022) and Forecasted Estimates (Till 2035) (USD Billion)
- Figure 15.8 Back of the Eye Disorders Market in France: Historical Trends (Since 2022) and Forecasted Estimates (Till 2035) (USD Billion)
- Figure 15.9 Back of the Eye Disorders Market in Italy: Historical Trends (Since 2022) and Forecasted Estimates (Till 2035) (USD Billion)
- Figure 15.10 Back of the Eye Disorders Market in Spain: Historical Trends (Since 2022) and Forecasted Estimates (Till 2035) (USD Billion)
- Figure 15.11 Back of the Eye Disorders Market in Rest of Europe: Historical Trends (Since 2022) and Forecasted Estimates (Till 2035) (USD Billion)
- Figure 15.12 Back of The Eye Disorders Market in Asia-Pacific, Historical Trends (Since 2022) and Forecasted Estimates (Till 2035) (USD Billion)
- Figure 15.13 Back of The Eye Disorders Market in China, Historical Trends (Since 2022) and Forecasted Estimates (Till 2035) (USD Billion)
- Figure 15.14 Back of The Eye Disorders Market in Japan, Historical Trends (Since 2022) and Forecasted Estimates (Till 2035) (USD Billion)
- Figure 15.15 Back of The Eye Disorders Market in India, Historical Trends (Since 2022) and Forecasted Estimates (Till 2035) (USD Billion)
- Figure 15.16 Back of The Eye Disorders Market in South Korea, Historical Trends (Since 2022) and Forecasted Estimates (Till 2035) (USD Billion)
- Figure 15.17 Back of The Eye Disorders Market in Australia, Historical Trends (Since 2022) and Forecasted Estimates (Till 2035) (USD Billion)
- Figure 15.18 Back of The Eye Disorders Market in Rest of Asia-Pacific, Historical Trends (Since 2022) and Forecasted Estimates (Till 2035) (USD Billion)
- Figure 15.19 Back of The Eye Disorders Market in Middle East and North Africa, Historical Trends (Since 2022) and Forecasted Estimates (Till 2035) (USD Billion)
- Figure 15.20 Back of The Eye Disorders Market in Saudi Arabia, Historical Trends (Since 2022) and Forecasted Estimates (Till 2035) (USD Billion)
- Figure 15.21 Back of The Eye Disorders Market in Egypt, Historical Trends (Since 2022) and Forecasted Estimates (Till 2035) (USD Billion)
- Figure 15.22 Back of The Eye Disorders Market in Rest of Middle East and North Africa, Historical Trends (Since 2022) and Forecasted Estimates (Till 2035) (USD Billion)
- Figure 15.23 Back of The Eye Disorders Market in Latin America, Historical Trends (Since 2022) and Forecasted Estimates (Till 2035) (USD Billion)
- Figure 15.24 Back of The Eye Disorders Market in Brazil, Historical Trends (Since 2022) and Forecasted Estimates (Till 2035) (USD Billion)
- Figure 15.25 Back of The Eye Disorders Market in Argentina, Historical Trends (Since 2022) and Forecasted Estimates (Till 2035) (USD Billion)
- Figure 15.26 Back of The Eye Disorders Market in Rest of Latin America, Historical Trends (Since 2022) and Forecasted Estimates (Till 2035) (USD Billion)
- Figure 21.1 Back of the Eye Disorders Market: Distribution by Distribution by Key Players, (based on revenues generated)
- Figure 21.2 Back of the Eye Disorders Market: Distribution by Distribution by Key Players, 2035 (based on forecasted revenues)
- Figure 22.1 Back of the Eye Disorders Market for ALPHAGAN(R) P / COMBIGAN(R) Franchise, Historical Trends (Since 2022) and Forecasted Estimates (Till 2035) (USD Million)
- Figure 22.2 Back of the Eye Disorders Market for AZARGA(R), Historical Trends (Since 2022) and Forecasted Estimates (Till 2035) (USD Million)
- Figure 22.3 Back of the Eye Disorders Market for Beovu(R) (brolucizumab) / RTH258, Historical Trends (Since 2022) and Forecasted Estimates (Till 2035) (USD Million)
- Figure 22.4 Back of the Eye Disorders Market for Duotrav(TM), Historical Trends (Since 2022) and Forecasted Estimates (Till 2035) (USD Million)
- Figure 22.5 Back of the Eye Disorders Market for Eylea HD(R) (aflibercept), Historical Trends (Since 2023) and Forecasted Estimates (Till 2035) (USD Million)
- Figure 22.6 Back of the Eye Disorders Market for Eylea(R) (aflibercept), Historical Trends (Since 2022) and Forecasted Estimates (Till 2035) (USD Million)
- Figure 22.7 Back of the Eye Disorders Market for IZERVAY(TM), Historical Trends (Since 2023) and Forecasted Estimates (Till 2035) (USD Million)
- Figure 22.8 Back of the Eye Disorders Market for KIMMTRAK(R) (tebentafusp-tebn), Historical Trends (Since 2022) and Forecasted Estimates (Till 2035) (USD Million)
- Figure 22.9 Back of the Eye Disorders Market for Latanoprost / DE-130A / (Catioprost) / Catiolanze(R), Historical Trends (Since 2024) and Forecasted Estimates (Till 2035) (USD Million)
- Figure 22.10 Back of the Eye Disorders Market for Lucentis(R) / Ranibizumab, Historical Trends (Since 2022) and Forecasted Estimates (Till 2035) (USD Million)
- Figure 22.11 Back of the Eye Disorders Market for Lumigan/Ganfort, Historical Trends (Since 2022) and Forecasted Estimates (Till 2035) (USD Million)
- Figure 22.12 Back of the Eye Disorders Market for Lumitin(R) (Conbercept Ophthalmic Solution) / KH902, Historical Trends (Since 2022) and Forecasted Estimates (Till 2035) (USD Million)
- Figure 22.13 Back of the Eye Disorders Market for LUXTURNA(R) (voretigene neparvovec-rzyl), Historical Trends (Since 2022) and Forecasted Estimates (Till 2035) (USD Million)
- Figure 22.14 Back of the Eye Disorders Market for NCX 470 / OT-301 / K-911, Forecasted Estimates (Till 2035) (USD Million)
- Figure 22.15 Back of the Eye Disorders Market for Omidenepag / Isopropyl / OMLONTI(R) / Eybelis / DE-117, Historical Trends (Since 2022) and Forecasted Estimates (Till 2035) (USD Million)
- Figure 22.16 Back of the Eye Disorders Market for ONS-5010 / LYTENAVA(TM), Historical Trends (Since 2025) and Forecasted Estimates (Till 2035) (USD Million)
- Figure 22.17 Back of the Eye Disorders Market for Raxone(R) / Idebenone, Historical Trends (Since 2022) and Forecasted Estimates (Till 2035) (USD Million)
- Figure 22.18 Back of the Eye Disorders Market for Rhopressa(R) + ROCKLATAN(TM), Historical Trends (Since 2022) and Forecasted Estimates (Till 2035) (USD Million)
- Figure 22.19 Back of the Eye Disorders Market for Sepetaprost / DE-126 / SETANEO(R) Ophthalmic Solution, Historical Trends (Since 2025) and Forecasted Estimates (Till 2035) (USD Million)
- Figure 22.20 Back of the Eye Disorders Market for Simbrinza(R), Historical Trends (Since 2022) and Forecasted Estimates (Till 2035) (USD Million)
- Figure 22.21 Back of the Eye Disorders Market for SYFOVRE(R) (pegcetacoplan injection), Historical Trends (Since 2023) and Forecasted Estimates (Till 2035) (USD Million)
- Figure 22.22 Back of the Eye Disorders Market for Tafluprost / Timolol Maleate / TAPCOM Combination Ophthalmic Solution, Historical Trends (Since 2022) and Forecasted Estimates (Till 2035) (USD Million)
- Figure 22.23 Back of the Eye Disorders Market for Travatan Z(R) / Travoprost, Historical Trends (Since 2022) and Forecasted Estimates (Till 2035) (USD Million)
- Figure 22.24 Back of the Eye Disorders Market for Vabysmo (faricimab-sova, RG7716), Historical Trends (Since 2022) and Forecasted Estimates (Till 2035) (USD Million)
- Figure 22.25 Back of the Eye Disorders Market for VYZULTA(R), Historical Trends (Since 2023) and Forecasted Estimates (Till 2035) (USD Million)
- Figure 22.26 Back of the Eye Disorders Market for XIPERE(R) / ARCATUS(R) / ARVN001, Historical Trends (Since 2022) and Forecasted Estimates (Till 2035) (USD Million)

