PUBLISHER: Roots Analysis | PRODUCT CODE: 2107340

PUBLISHER: Roots Analysis | PRODUCT CODE: 2107340
Fc Fusion Therapeutics Market by Target Indication, Type of Fusion Molecule, Route of Administration, and Key Geographical Regions - Trends and Global Forecast Till 2035
FC FUSION THERAPEUTICS MARKET: OVERVIEW
As per Roots Analysis, the global Fc fusion therapeutics market is estimated to grow from USD 20.6 billion in the current year to USD 53.51 billion by 2035, at an impressive CAGR of 10%, during the forecast period, till 2035.
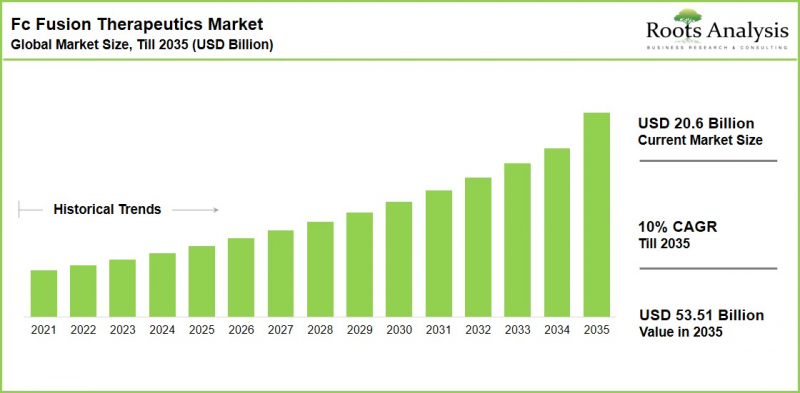
Fc Fusion Therapeutics Market: Growth and Trends
The Fc domain extends the circulating half-life of a therapeutic payload by binding to the neonatal Fc receptor (FcRn), which shields the molecule from lysosomal degradation and recycles it back into circulation. This half-life advantage reduces dosing frequency relative to non-fused biologics, a benefit that continues to drive adoption across chronic and rare-disease treatment regimens. Recent approvals, including Arcalyst(R) (recurrent pericarditis), Reblozyl(R) (beta-thalassemia) and Eylea(R) (neovascular AMD), illustrate how the modality has expanded well beyond its original autoimmune-disease roots.
Therapeutic drug developers are increasingly engineering next-generation fusion constructs including SIRPa-Fc, FLT3L-Fc and bispecific Fc fusion formats to improve tumor targeting and immune modulation in oncology. Meanwhile, established players continue to defend blockbuster franchises against emerging biosimilar competition. Contract development and manufacturing organizations, specialty distributors and cold-chain logistics providers are becoming more central to this ecosystem as sponsors look to scale clinical and commercial supply without building in-house infrastructure.
Growth Drivers: Factors Fueling Expansion of the Global Fc Fusion Therapeutics Market
Growth is being propelled by an expanding late-stage pipeline of Fc fusion candidates, rising prevalence of chronic conditions, such as haematological disorders and continued innovation in fusion-molecule engineering aimed at improving solubility, stability and target specificity. The commercial success of Enbrel, Eylea, and Reblozyl has strengthened confidence in the modality's regulatory and reimbursement pathway, while increasing licensing and co-development deals by major pharmaceutical companies are driving investment in the space.
Market Challenges: Critical Barriers Hindering Progress
Despite favorable fundamentals, the market faces restraints, such as immunogenicity risk associated with the Fc domain and technical complexity of engineering fusion constructs with consistent pharmacokinetic behavior. Further, the looming biosimilar / biobetter competition for first-generation assets such as Enbrel is creating significant challenges for the market players. Cold-chain and handling requirements for these temperature-sensitive biologics also raise the operational bar for distribution and channel partners seeking to enter the space.
Fc Fusion Therapeutics Market: Key Insights
The report examines the current state of the Fc fusion therapeutics market and identifies actionable entry points for distribution partners, specialty pharmacies and logistics providers. Key findings include:
- Over 110 Fc fusion therapeutic candidates are currently marketed or under active clinical development.
- More than 1,500 clinical trials have been conducted globally to evaluate candidate safety and efficacy.
- Clinical trials across global regions have enrolled over two million patients in total.
- Mid-to-late-stage pipeline candidates are predominantly concentrated in oncological indications.
- Fc protein-engineered antibody constructs represent the majority of active oncology pipeline candidates.
- Research funding is primarily driven by non-SBIR / STTR funding avenues, signaling major institutional and corporate investments.
- Intellectual property generation continues to grow steadily across both commercial drug developers and academic research institutions.
Fc Fusion Therapeutics Market
The market sizing and opportunity analysis has been segmented across the following parameters:
By Target Indication
- Rheumatoid Arthritis
- Neovascular (Wet) Age-related Macular Degeneration
- Hemophilia A
- Breast Cancer
- Non-Small Cell Lung Cancer
- Neutropenia
- Graft Versus Host Disease
- Neuromyelitis Optica Spectrum Disorders
- Systemic Lupus Erythematosus
- Other Indications
By Type of Fusion Molecule
- Antibody-based Fc Fusion
- Cytokine-based Fc Fusion
- Growth Factor-based Fc Fusion
- Receptor ECD-based Fc Fusion
- Other Fusion Types
By Route of Administration
- Subcutaneous
- Intravenous
- Intravitreal
By Geographical Regions
- North America
- US
- Canada
- Europe
- Germany
- UK
- France
- Italy
- Spain
- Rest of Europe
- Asia-Pacific
- China
- Japan
- South Korea
- Australia
- Rest of the World
Fc Fusion Therapeutics Market: Key Segments
Rheumatoid Arthritis Leads the Target Indication
Based on proprietary market analysis, rheumatoid arthritis holds the largest share of the market. This highest share is due to the long-standing commercial performance of Enbrel and its widespread use in the long-term treatment of chronic diseases.
On the other hand, oncology indications, led by non-small cell lung cancer and breast cancer, are expected to register a comparatively higher CAGR during the forecast period. This highest growth is due to the advancement of next-generation Fc fusion candidates for the treatment of oncology disorders into late-stage clinical trials.
North America Holds the Highest Share
According to our projections, North America holds the largest share of the global Fc fusion therapeutics market. This dominance is underpinned by the presence of well-established companies, strong reimbursement infrastructure and the highest per-capita treatment rates for anchor indications such as rheumatoid arthritis and wet AMD.
On the other hand, Asia-Pacific is expected to register the fastest CAGR during the forecast period. This unprecedented growth is propelled by an expanding domestic pipeline of oncology-focused Fc fusion candidates and increasing NMPA approval activity.
Example Players in Fc Fusion Therapeutics Market
- AbbVie
- Amgen
- AstraZeneca
- Bristol Myers Squibb
- Eli Lilly
- Johnson & Johnson
- Merck
- Novartis
- Pfizer
- Roche
Fc FUSION THERAPEUTICS MARKET: RESEARCH COVERAGE
- Market Sizing and Opportunity Analysis: An in-depth analysis of the market focusing on key segments, including target indication, type of fusion molecule, route of administration, and key geographical regions.
- Marketed and Pipeline Landscape: A detailed assessment of approved and clinical/preclinical Fc fusion candidates, including phase of development, fusion-molecule type, target indication, route of administration, and developer information.
- Company Profiles: In-depth profiles of prominent players engaged in Fc fusion therapeutics development, covering company overview, product portfolio, recent developments, and future outlook.
- Clinical Trial Analysis: An in-depth analysis of completed, ongoing and planned clinical studies, based on trial phase, study design, type of intervention, leading sponsors, and regional distribution of trials.
- Grant Analysis: A review of research grants awarded to institutes engaged in Fc fusion therapeutics-related projects, covering year of award, amount awarded, administering institute, and purpose of funding.
- Publication Analysis: A review of peer-reviewed scientific literature related to Fc fusion therapeutics, covering year of publication, emerging focus areas, leading authors, and key journals.
- Patent Analysis: A detailed analysis of patents filed / granted related to Fc fusion therapeutics, including patent jurisdiction, patent age, emerging focus areas, and leading players, along with a benchmarking and valuation analysis.
- Partnerships and Collaborations: An analysis of partnerships inked by stakeholders in the Fc fusion therapeutics domain, based on year, type of partnership, and most active players.
- Market Forecast and Opportunity Analysis: Historical trends and forecasted estimates across all key segments and geographies, developed using a top-down and bottom-up triangulated methodology.
- Case Study (Fc Protein Engineered and Glycoengineered Antibodies): A focused assessment of marketed and pipeline Fc-engineered and glycoengineered antibodies, covering phase of development, target indication, therapeutic area, type of Fc engineering, and route of administration.
Key Questions Answered in this Report
- Which are the leading companies in the Fc fusion therapeutics market?
- What is the current and future size of the Fc fusion therapeutics market?
- What is the CAGR of this market through 2035?
- Which target indication and fusion-molecule type dominate the market, and which are growing fastest?
- Which region leads the market, and which region is expected to grow fastest?
- What are the key trends and challenges shaping this market?
- What opportunities exist for distributors, specialty pharmacies and logistics partners entering this space?
- How is current and future market opportunity distributed across key segments?
Reasons to Buy this Report
This report is designed to give distributors, channel partners and investors a decisive analytical edge in a maturing, innovation-driven biologics category. Its core differentiators include:
- Top-Down and Bottom-Up Triangulated Forecasting: Market estimates are built using a hybrid methodology that cross-validates top-down macro assessments against bottom-up, molecule-level pipeline and demand data, minimizing forecast bias.
- Distribution and Channel-Partner Lens: Unlike conventional pipeline-only reports, this study explicitly maps the cold-chain, specialty-pharmacy and value-added service opportunities available to distribution partners entering the Fc fusion biologics supply chain.
- Comprehensive, Multi-Parameter Coverage: The report spans market sizing, pipeline and patent landscape, clinical trial and grant activity, funding and partnership analysis, and regulatory considerations across key global markets.
- Primary Research-Backed Insights: Findings are validated through direct engagement with drug developers, contract manufacturers and commercial leaders, ensuring insights reflect real operating conditions rather than desk research alone.
- Actionable Segmentation: Four-parameter segmentation (target indication, fusion-molecule type, route of administration, geography) enables precise opportunity sizing for any go-to-market or investment thesis.
Additional Benefits
- Complementary PPT Insights Pack
- Complementary Excel Data Packs for all Analytical Modules in the Report
- 15% Free Content Customization
- Detailed Report Walkthrough Session with Research Team
- Free Updated report if the report is 6-12 months old or older
TABLE OF CONTENTS
1. PREFACE
- 1.1. Scope of the Report
- 1.2. Research Methodology
- 1.3. Key Questions Answered
- 1.4. Chapter Outlines
2. EXECUTIVE SUMMARY
3. INTRODUCTION
- 3.1. Overview of Fc Fusion Therapeutics
- 3.2. Components of Fc Fusion Therapeutics
- 3.3. Mechanism of Action
- 3.4. Types of Fc Fusion Therapeutics
- 3.4.1. Antibody-based Fc Fusion Therapeutics
- 3.4.2. Cytokine-based Fc Fusion Therapeutics
- 3.4.3. Enzyme-based Fc Fusion Therapeutics
- 3.4.4. Peptide-based Fc Fusion Therapeutics
- 3.4.5. Receptor ECD-based Fc Fusion Therapeutics
- 3.5. Applications of Fc Fusion Therapeutics
- 3.6. Advantages of Fc Fusion Therapeutics over Other Biological Moieties
- 3.7. Future Perspectives
4. PIPELINE REVIEW: MARKETED AND CLINICAL DRUGS
- 4.1. Analysis Methodology and Key Parameters
- 4.2. Fc Fusion Therapeutics: Drug Pipeline
- 4.3. Fc Fusion Therapeutics: Pipeline Analysis
- 4.3.1. Analysis by Phase of Development
- 4.3.2. Analysis by Type of Fusion Molecule
- 4.3.3. Analysis by Target Gene
- 4.3.4. Analysis by Therapeutic Area(s)
- 4.3.5. Analysis by Target Disease Indication(s)
- 4.3.6. Analysis by Type of Therapy
- 4.3.7. Analysis by Route of Administration
- 4.3.8. Analysis by Dosing Frequency
- 4.4. Fc Fusion Therapeutics: List of Drug Developers
- 4.4.1. Analysis by Year of Establishment
- 4.4.2. Analysis by Company Size
- 4.4.3. Analysis by Location of Headquarters
- 4.4.4. Leading Developers
- 4.4.5. Grid Analysis: Distribution by Phase of Development, Company Size and Location of Headquarters
5. COMPANY PROFILES
- 5.1. Chapter Overview
- 5.2. Alphamab Oncology
- 5.2.1. Company Overview
- 5.2.2. Financial Information
- 5.2.3. Product Portfolio
- 5.2.4. Recent Developments and Future Outlook
- 5.3. Amgen
- 5.3.1. Company Overview
- 5.3.2. Financial Information
- 5.3.3. Product Portfolio
- 5.3.4. Recent Developments and Future Outlook
- 5.4. Acceleron Pharmaceuticals
- 5.4.1. Company Overview
- 5.4.2. Financial Information
- 5.4.3. Product Portfolio
- 5.4.4. Recent Developments and Future Outlook
- 5.5. Bristol Myers Squibb
- 5.5.1. Company Overview
- 5.5.2. Financial Information
- 5.5.3. Product Portfolio
- 5.5.4. Recent Developments and Future Outlook
- 5.6. Sanofi
- 5.6.1. Company Overview
- 5.6.2. Financial Information
- 5.6.3. Product Portfolio
- 5.6.4. Recent Developments and Future Outlook
6. CLINICAL TRIAL ANALYSIS
- 6.1. Analysis Methodology and Key Parameters
- 6.2. Fc Fusion Therapeutics: List of Clinical Trials
- 6.3.1. Analysis by Trial Registration Year
- 6.3.2. Analysis by Trial Phase
- 6.3.3. Analysis by Study Design
- 6.3.4. Analysis by Type of Masking
- 6.3.5. Analysis by Type of Intervention Model
- 6.3.6. World Cloud: Emerging Focus Areas
- 6.3.7. Analysis by Trial Registration Year and Geography
- 6.3.8. Analysis by Type of Sponsor
- 6.3.9. Leading Industry Players: Analysis by Number of Trials Registered
- 6.3.10. Leading Non-Industry Players: Analysis by Number of Trials Registered
- 6.3.11. Popular Indications: Analysis by Number of Registered Trials
- 6.3.12. Popular Interventions: Analysis by Number of Registered Trials
- 6.3.13. Geographical Analysis by Number of Registered Trials
- 6.3.14. Geographical Analysis by Number of Patients Enrolled
7. ACADEMIC GRANT ANALYSIS
- 7.1. Analysis Methodology and Key Parameters
- 7.2. Fc Fusion Therapeutics: Analysis of Academic Grants
- 7.2.1. Analysis by Year of Grant Award
- 7.2.2. Analysis by Amount Awarded
- 7.2.3. Analysis by Administering Institute Center
- 7.2.4. Analysis by Support Period
- 7.2.5. Analysis by Type of Grant Application
- 7.2.6. Analysis by Purpose of Grant Award
- 7.2.7. Analysis by Activity Code
- 7.2.8. Word Cloud Analysis: Emerging Focus Areas
- 7.2.9. Popular NIH Departments: Analysis by Number of Grants
- 7.2.10. Prominent Program Officers: Analysis by Number of Grants
- 7.2.11. Popular Recipient Organizations: Analysis by Number of Grants
8. PUBLICATION ANALYSIS
- 8.1. Analysis Methodology and Key Parameters
- 8.2. Fc Fusion Therapeutics: Recent Publications
- 8.3. Analysis by Year of Publication
- 8.4. Word Cloud Analysis: Emerging Focus Areas
- 8.5. Analysis by Target Therapeutic Area
- 8.6. Leading Authors: Analysis by Number of Publications
- 8.7. Key Journals: Analysis by Number of Publications
9. PATENT ANALYSIS
- 9.1. Analysis Methodology and Key Parameters
- 9.2. Fc Fusion Therapeutics: Patent Analysis
- 9.2.1. Analysis by Publication Year
- 9.2.2. Analysis by Type of Patent
- 9.2.3. Analysis by Geographical Location
- 9.2.4. Analysis by Patent Age
- 9.2.5. Analysis by CPC Symbols
- 9.2.6. Word Cloud Analysis: Emerging Focus Areas
- 9.2.7. Leading Patent Assignees: Analysis by Number of Patents
- 9.2.8. Leading Industry Players: Analysis by Number of Patents
- 9.2.9. Leading Non-Industry Players: Analysis by Number of Patents
- 9.2.10. Fc Fusion Therapeutics: Patent Benchmarking Analysis
- 9.2.10. Fc Fusion Therapeutics: Patent Valuation Analysis
10. PARTNERSHIPS AND COLLABORATIONS
- 10.1. Analysis Methodology and Key Parameters
- 10.2. Partnership Models
- 10.3. Fc Fusion Therapeutics: List of Partnerships and Collaborations
- 10.3.1. Analysis by Year of Partnership
- 10.3.2. Analysis by Type of Partnership
- 10.3.3. Analysis by Type of Partnership and Type of Fusion molecule
- 10.3.4. Analysis by Year of Partnership and Type of Partner
- 10.3.5. Analysis by Type of Partnership and Type of Partner
- 10.3.6. Most Active Players: Analysis by Number of Partnerships
- 10.3.7. Regional Analysis
- 10.3.7.1. Intercontinental and Intracontinental Agreements
11. MARKET SIZING AND OPPORTUNITY ANALYSIS
- 11.1. Forecast Methodology and Key Assumptions
- 11.2. Global Fc Fusion Therapeutics Market, 2021-2031
- 11.3. Global Fc Fusion Therapeutics Market, 2021-2031: Distribution by Target Indication
- 11.4. Global Fc Fusion Therapeutics Market, 2021-2031: Distribution by Type of Fusion Molecule
- 11.5. Global Fc Fusion Therapeutics Market, 2021-2031: Distribution by Type of Therapy
- 11.6. Global Fc Fusion Therapeutics Market, 2021-2031: Distribution by Route of Administration
- 11.7. Global Fc Fusion Therapeutics Market, 2021-2031: Distribution by Geography
- 11.8. Fc Fusion Therapeutics: Individual Product Sales Forecasts
- 11.8.1. ABP 938 (Amgen)
- 11.8.2. Alprolix(R) (Sanofi)
- 11.8.3. AnBaiNuo(R) (Hisun Pharmaceuticals)
- 11.8.4. Arcalyst(R) (Kiniska Pharmaceuticals)
- 11.8.5. BIVV001 (Sanofi)
- 11.8.6. CD24Fc (Merck)
- 11.8.7. Eloctate(R) (Biogen)
- 11.8.8. Eylea(TM) (Regeneron Pharmaceuticals)
- 11.8.9. FRSW107 (Zhengzhou Gensciences)
- 11.8.10. KN035 (Alphamab Oncology)
- 11.8.11. KN046 (Alphamab Oncology)
- 11.8.12. Lumitin(R) (Chengdu Kanghong Biotech)
- 11.8.13. Reblozyl(R) (Bristol-Myers Squibb)
- 11.8.14. RyzneutaTM (Evive Biotech)
- 11.8.15. Strensiq(R) (AstraZeneca)
- 11.8.16. Telitacicept (RemeGen)
12. CASE STUDY: FC PROTEIN ENGINEERED AND GLYCOENGINEERED ANTIBODIES
- 12.1. Fc Protein Engineered and Glycoengineered Antibodies: Drug Pipeline
- 12.1.1. Analysis by Phase of Development
- 12.1.2. Analysis by Target Disease Indication
- 12.1.3. Analysis by Therapeutic Area
- 12.1.4. Analysis by Type of Fc Engineering
- 12.1.5. Analysis by Impact of Fc Engineering
- 12.1.6. Analysis by Route of Administration
- 12.1.7. Analysis by Type of Therapy
- 12.2. Fc Protein Engineered and Glycoengineered Antibodies: List of Developers
- 12.2.1 Analysis by Year of Establishment
- 12.2.2 Analysis by Company Size
- 12.2.3 Analysis by Location of Headquarters
13. CONCLUSION
14. APPENDIX 1: TABULATED DATA
15. APPENDIX 2: LIST OF COMPANIES AND ORGANIZATIONS
List of Tables
- Table 4.1 Fc Fusion Therapeutics: Drug Pipeline
- Table 4.2 Fc Fusion Therapeutics: List of Drug Developers
- Table 5.1 Fc Fusion Therapeutics: List of Companies Profiled
- Table 5.2 Drug Profile: KN015
- Table 5.3 Drug Profile: KN046
- Table 5.4 Drug Profile: KN035
- Table 5.5 Drug Profile: KN058
- Table 5.6 Drug Profile: KN055
- Table 5.7 Drug Profile: KN019
- Table 5.8 Alphamab Oncology: Recent Developments and Future Outlook
- Table 5.9 Drug Profile: AMG 386
- Table 5.10 Drug Profile: AMG 592
- Table 5.11 Drug Profile: ABP 938
- Table 5.12 Drug Profile: Enbrel(R)
- Table 5.13 Drug Profile: Nplate(R)
- Table 5.14 Amgen: Recent Developments and Future Outlook
- Table 5.15 Drug Profile: ACE-1334
- Table 5.16 Drug Profile: ACE-011
- Table 5.17 Acceleron Pharmaceuticals: Recent Developments and Future Outlook
- Table 5.18 Drug Profile: AVID200
- Table 5.19 Drug Profile: Orencia(R)
- Table 5.20 Drug Profile: Nulojix(R)
- Table 5.21 Drug Profile: REBLOZYL(R)
- Table 5.22 Bristol-Myers Squibb: Recent Developments and Future Outlook
- Table 5.23 Drug Profile: Alprolix(R)
- Table 5.24 Drug Profile: BIVV001
- Table 5.25 Drug Profile: Zaltrap(R)
- Table 5.26 Sanofi: Recent Developments and Future Outlook
- Table 6.1 Fc Fusion Therapeutics: List of Clinical Trials
- Table 10.1 Fc Fusion Therapeutics: List of Partnerships and Collaborations
- Table 12.1 Fc Protein Engineered and Glycoengineered Antibodies: Drug Pipeline
- Table 12.2 Fc Protein Engineered and Glycoengineered Antibodies: List of Drug Developers
- Table 14.1 Fc Fusion Therapeutics: Distribution by Phase of Development
- Table 14.2 Fc Fusion Therapeutics: Distribution by Type of Fusion Molecule
- Table 14.3 Fc Fusion Therapeutics: Distribution by Target Gene
- Table 14.4 Fc Fusion Therapeutics: Distribution by Therapeutic Area(s)
- Table 14.5 Fc Fusion Therapeutics: Distribution by Target Disease Indication(s)
- Table 14.6 Fc Fusion Therapeutics: Distribution by Type of Therapy
- Table 14.7 Fc Fusion Therapeutics: Distribution by Route of Administration
- Table 14.8 Fc Fusion Therapeutics: Distribution by Dosing Frequency
- Table 14.9 Fc Fusion Therapeutics: Distribution by Year of Establishment
- Table 14.10 Fc Fusion Therapeutics: Distribution by Company Size
- Table 14.11 Fc Fusion Therapeutics: Distribution by Location of Headquarters
- Table 14.12 Fc Fusion Therapeutics: Distribution by Leading Developers
- Table 14.13 Amgen: Annual Revenues, 2016-H1 2021 (USD Billion)
- Table 14.14 Acceleron Pharmaceuticals: Annual Revenues, 2016-H1 2021 (USD Billion)
- Table 14.15 Bristol Myers Squibb: Annual Revenues, 2016-H1 2021 (USD Billion)
- Table 14.16 Sanofi: Annual Revenues, 2016-H1 2021 (USD Billion)
- Table 14.17 Clinical Trial Analysis: Distribution by Trial Registration Year
- Table 14.18 Clinical Trial Analysis: Distribution by Trial Phase
- Table 14.19 Clinical Trial Analysis: Distribution by Study Design
- Table 14.20 Clinical Trial Analysis: Distribution by Type of Masking
- Table 14.21 Clinical Trial Analysis: Distribution by Type of Intervention Model
- Table 14.22 Clinical Trial Analysis: Distribution by Trial Registration Year and Geography
- Table 14.23 Clinical Trial Analysis: Distribution by Type of Sponsor
- Table 14.24 Leading Industry Players: Distribution by Number of Trials Registered
- Table 14.25 Leading Non-Industry Players: Distribution by Number of Trials Registered
- Table 14.26 Popular Indications: Analysis by Number of Registered Trials
- Table 14.27 Popular Interventions: Analysis by Number of Registered Trials
- Table 14.28 Popular Indications: Distribution by Number of Registered Trials
- Table 14.29 Popular Interventions: Distribution by Number of Registered Trials
- Table 14.30 Clinical Trial Analysis: Geographical Distribution by Number of Registered Trials
- Table 14.31 Clinical Trial Analysis: Geographical Distribution by Number of Patients Enrolled
- Table 14.32 Grant Analysis: Cumulative Trend by Year of Grant Award, 2010-2021
- Table 14.33 Grant Analysis: Cumulative Distribution by Amount Awarded (USD Million), 2010-2021
- Table 14.34 Grant Analysis: Distribution by Administering Institute Center
- Table 14.35 Grant Analysis: Distribution by Support Period
- Table 14.36 Grant Analysis: Distribution by Type of Grant Application
- Table 14.37 Grant Analysis: Distribution by Purpose of Grant Award
- Table 14.38 Grant Analysis: Distribution by Activity Code
- Table 14.39 Popular NIH Departments: Distribution by Number of Grants
- Table 14.40 Prominent Program Officers: Distribution by Number of Grants
- Table 14.41 Popular Recipient Organizations: Distribution by Number of Grants
- Table 14.42 Publication Analysis: Cumulative Year-wise Trend, 2010-2021
- Table 14.43 Publication Analysis: Distribution by Target Therapeutic Area
- Table 14.44 Leading Authors: Distribution by Number of Publications
- Table 14.45 Key Journals: Distribution by Number of Publications
- Table 14.46 Patent Analysis: Distribution by Publication Year
- Table 14.47 Patent Analysis: Distribution by Type of Patent
- Table 14.48 Patent Analysis: Distribution by Geographical Location
- Table 14.49 Patent Analysis: Distribution by Patent Age
- Table 14.50 Patent Analysis: Distribution by CPC Symbols
- Table 14.51 Leading Patent Assignees: Distribution by Number of Patents
- Table 14.52 Leading Industry Players: Distribution by Number of Patents
- Table 14.53 Patent Analysis: Distribution by Patent Benchmarking
- Table 14.54 Patent Analysis: Distribution by Patent Valuation
- Table 14.55 Partnerships and Collaborations: Cumulative Year-wise Trend, 2015-2021
- Table 14.56 Partnerships and Collaborations: Distribution by Type of Partnership
- Table 14.57 Partnerships and Collaborations: Distribution by Type of Partnership and Type of Fusion Molecule
- Table 14.58 Partnerships and Collaborations: Distribution by Year of Partnership and Type of Partner
- Table 14.59 Partnerships and Collaborations: Distribution by Type of Partnership and Type of Partner
- Table 14.60 Most Active Players: Distribution by Number of Partnerships
- Table 14.61 Partnerships and Collaborations: Regional Distribution
- Table 14.62 Global Fc Fusion Therapeutics Market, 2021-2035 (USD Million)
- Table 14.63 Global Fc Fusion Therapeutics Market, 2021-2035: Distribution by Target Indication (USD Million)
- Table 14.64 Global Fc Fusion Therapeutics Market, 2021-2035: Distribution by Type of Therapy (USD Million)
- Table 14.65 Global Fc Fusion Therapeutics Market, 2021-2035: Distribution by Route of Administration (USD Million
- Table 14.66 Global Fc Fusion Therapeutics Market, 2021-2035: Distribution by Geography (USD Million)
- Table 14.67 ABP 938: Sales Forecast, 2024-2035 (USD Million)
- Table 14.68 Alprolix(R): Sales Forecast, 2021-2035 (USD Million)
- Table 14.69 AnBaiNuo(R): Sales Forecast, 2021-2035 (USD Million)
- Table 14.70 Arcalyst(R): Sales Forecast, 2021-2035 (USD Million)
- Table 14.71 BIVV001: Sales Forecast, 2025-2035 (USD Million)
- Table 14.72 CD24Fc: Sales Forecast, 2022-2035 (USD Million)
- Table 14.73 Eloctate(R): Sales Forecast, 2021-2035 (USD Million)
- Table 14.74 Eylea(TM): Sales Forecast, 2021-2035 (USD Million)
- Table 14.75 FRSW107: Sales Forecast, 2024-2035 (USD Million)
- Table 14.76 KN035: Sales Forecast, 2024-2035 (USD Million)
- Table 14.77 KN046: Sales Forecast, 2025-2035 (USD Million)
- Table 14.78 Lumitin(R): Sales Forecast, 2021-2035 (USD Million)
- Table 14.79 Reblozyl(R): Sales Forecast, 2021-2035 (USD Million)
- Table 14.80 RyzneutaTM: Sales Forecast, 2022-2035 (USD Million)
- Table 14.81 Strensiq(R): Sales Forecast, 2021-2035 (USD Million)
- Table 14.82 Telitacicept: Sales Forecast, 2024-2035 (USD Million)
- Table 14.83 Fc Protein Engineered and Glycoengineered Antibodies: Analysis by Phase of Development
- Table 14.84 Fc Protein Engineered and Glycoengineered Antibodies: Analysis by Target Disease Indication
- Table 14.85 Fc Protein Engineered and Glycoengineered Antibodies: Analysis by Therapeutic Area
- Table 14.86 Fc Protein Engineered and Glycoengineered Antibodies: Analysis by Type of Fc Engineering
- Table 14.87 Fc Protein Engineered and Glycoengineered Antibodies: Analysis by Impact of Fc Engineering
- Table 14.88 Fc Protein Engineered and Glycoengineered Antibodies: Analysis by Route of Administration
- Table 14.89 Fc Protein Engineered and Glycoengineered Antibodies: Analysis by Type of Therapy
- Table 14.90 Fc Protein Engineered and Glycoengineered Antibodies Developers: Analysis by Year of Establishment
- Table 14.91 Fc Protein Engineered and Glycoengineered Antibodies Developers Analysis by Company Size
- Table 14.92 Fc Protein Engineered and Glycoengineered Antibodies Developers Analysis by Location of Headquarters
List of Figures
- Figure 2.1 Executive Summary: Overall Market Landscape
- Figure 2.2 Executive Summary: Clinical Trial Analysis
- Figure 2.3 Executive Summary: Academic Grant Analysis
- Figure 2.4 Executive Summary: Publication Analysis
- Figure 2.5 Executive Summary: Patent Analysis
- Figure 2.6 Executive Summary: Partnerships and Collaborations
- Figure 2.7 Executive Summary: Market Forecast
- Figure 3.1 Components of Fc Fusion Therapeutics
- Figure 3.2 Mechanism of Action
- Figure 4.1 Fc Fusion Therapeutics: Distribution by Phase of Development
- Figure 4.2 Fc Fusion Therapeutics: Distribution by Type of Fusion Molecule
- Figure 4.3 Fc Fusion Therapeutics: Distribution by Target Gene
- Figure 4.4 Fc Fusion Therapeutics: Distribution by Therapeutic Area(s)
- Figure 4.5 Fc Fusion Therapeutics: Distribution by Target Disease Indication(s)
- Figure 4.6 Fc Fusion Therapeutics: Distribution by Type of Therapy
- Figure 4.7 Fc Fusion Therapeutics: Distribution by Route of Administration
- Figure 4.8 Fc Fusion Therapeutics: Distribution by Dosing Frequency
- Figure 4.9 Fc Fusion Therapeutics Developers: Distribution by Year of Establishment
- Figure 4.10 Fc Fusion Therapeutics Developers: Distribution by Company Size
- Figure 4.11 Fc Fusion Therapeutics Developers: Distribution by Location of Headquarters
- Figure 4.12 Leading Developers: Distribution by Number of Fc Fusion Therapeutics
- Figure 4.13 Grid Analysis: Distribution by Phase of Development, Company Size and Location of Headquarters
- Figure 5.1 Amgen: Annual Revenues, 2016-H1 2021 (USD Billion)
- Figure 5.2 Acceleron Pharmaceuticals: Annual Revenues, 2016-H1 2021 (USD Billion)
- Figure 5.3 Bristol Myers Squibb: Annual Revenues, 2016-H1 2021 (USD Billion)
- Figure 5.4 Sanofi: Annual Revenues, 2016-H1 2021 (USD Billion)
- Figure 6.1 Clinical Trial Analysis: Distribution by Trial Registration Year
- Figure 6.2 Clinical Trial Analysis: Distribution by Trial Phase
- Figure 6.3 Clinical Trial Analysis: Distribution by Study Design
- Figure 6.4 Clinical Trial Analysis: Distribution by Type of Masking
- Figure 6.5 Clinical Trial Analysis: Distribution by Type of Intervention Model
- Figure 6.6 World Cloud Analysis: Emerging Focus Areas
- Figure 6.7 Clinical Trial Analysis: Distribution by Trial Registration Year and Geography
- Figure 6.8 Clinical Trial Analysis: Distribution by Type of Sponsor
- Figure 6.9 Leading Industry Players: Distribution by Number of Trials Registered
- Figure 6.10 Leading Non-Industry Players: Distribution by Number of Trials Registered
- Figure 6.11 Popular Indications: Distribution by Number of Registered Trials
- Figure 6.12 Popular Interventions: Distribution by Number of Registered Trials
- Figure 6.13 Popular Indications: Distribution by Number of Registered Trials
- Figure 6.14 Popular Interventions: Distribution by Number of Registered Trials
- Figure 6.15 Clinical Trial Analysis: Geographical Distribution by Number of Registered Trials
- Figure 6.16 Clinical Trial Analysis: Geographical Distribution by Number of Patients Enrolled
- Figure 7.1 Grant Analysis: Cumulative Trend by Year of Grant Award, 2010-2021
- Figure 7.2 Grant Analysis: Cumulative Distribution by Amount Awarded (USD Million), 2010-2021
- Figure 7.3 Grant Analysis: Distribution by Administering Institute Center
- Figure 7.4 Grant Analysis: Distribution by Support Period
- Figure 7.5 Grant Analysis: Distribution by Type of Grant Application
- Figure 7.6 Grant Analysis: Distribution by Purpose of Grant Award
- Figure 7.7 Grant Analysis: Distribution by Activity Code
- Figure 7.8 Word Cloud Analysis: Emerging Focus Areas
- Figure 7.9 Popular NIH Departments: Distribution by Number of Grants
- Figure 7.10 Prominent Program Officers: Distribution by Number of Grants
- Figure 7.11 Popular Recipient Organizations: Distribution by Number of Grants
- Figure 8.1 Publication Analysis: Cumulative Year-wise Trend, 2010-2021
- Figure 8.2 Word Cloud Analysis: Emerging Focus Areas
- Figure 8.3 Publication Analysis: Distribution by Target Therapeutic Area
- Figure 8.4 Leading Authors: Distribution by Number of Publications
- Figure 8.5 Key Journals: Distribution by Number of Publications
- Figure 9.1 Patent Analysis: Distribution by Publication Year
- Figure 9.2 Patent Analysis: Distribution by Type of Patent
- Figure 9.3 Patent Analysis: Distribution by Geographical Location
- Figure 9.4 Patent Analysis: Distribution by Patent Age
- Figure 9.5 Patent Analysis: Distribution by CPC Symbols
- Figure 9.6 Word Cloud Analysis: Emerging Focus Areas
- Figure 9.7 Leading Patent Assignees: Distribution by Number of Patents
- Figure 9.8 Leading Industry Players: Distribution by Number of Patents
- Figure 9.9 Leading Non-Industry Players: Distribution by Number of Patents
- Figure 9.10 Patent Analysis: Distribution by Patent Benchmarking
- Figure 9.11 Patent Analysis: Distribution by Patent Valuation
- Figure 10.1 Partnerships and Collaborations: Cumulative Year-wise Trend, 2015-2021
- Figure 10.2 Partnerships and Collaborations: Distribution by Type of Partnership
- Figure 10.3 Partnerships and Collaborations: Distribution by Type of Partnership and Type of Fusion Molecule
- Figure 10.4 Partnerships and Collaborations: Distribution by Year of Partnership and Type of Partner
- Figure 10.5 Partnerships and Collaborations: Distribution by Type of Partnership and Type of Partner
- Figure 10.6 Most Active Players: Distribution by Number of Partnerships
- Figure 10.7 Partnerships and Collaborations: Regional Distribution
- Figure 10.7.1 Partnerships and Collaborations: Intercontinental and Intracontinental Agreements
- Figure 11.1 Global Fc Fusion Therapeutics Market, 2021-2035 (USD Million)
- Figure 11.2 Global Fc Fusion Therapeutics Market, 2021-2035: Distribution by Target Indication (USD Million)
- Figure 11.3 Global Fc Fusion Therapeutics Market, 2021-2035: Distribution by Type of Fusion Molecule (USD Million)
- Figure 11.4 Global Fc Fusion Therapeutics Market, 2021-2035: Distribution by Type of Therapy (USD Million)
- Figure 11.5 Global Fc Fusion Therapeutics Market, 2021-2035: Distribution by Route of Administration (USD Million)
- Figure 11.6 Global Fc Fusion Therapeutics Market, 2021-2035: Distribution by Geography (USD Million)
- Figure 11.7 ABP 938: Sales Forecast, 2024-2035 (USD Million)
- Figure 11.8 Alprolix(R): Sales Forecast, 2021-2035 (USD Million)
- Figure 11.9 AnBaiNuo(R): Sales Forecast, 2021-2035 (USD Million)
- Figure 11.10 Arcalyst(R): Sales Forecast, 2021-2035 (USD Million)
- Figure 11.11 BIVV001: Sales Forecast, 2025-2035 (USD Million)
- Figure 11.12 CD24Fc: Sales Forecast, 2022-2035 (USD Million)
- Figure 11.13 Eloctate(R): Sales Forecast, 2021-2035 (USD Million)
- Figure 11.14 Eylea(TM): Sales Forecast, 2021-2035 (USD Million)
- Figure 11.15 FRSW107: Sales Forecast, 2024-2035 (USD Million)
- Figure 11.16 KN035: Sales Forecast, 2024-2035 (USD Million)
- Figure 11.17 KN046: Sales Forecast, 2025-2035 (USD Million)
- Figure 11.18 Lumitin(R): Sales Forecast, 2021-2035 (USD Million)
- Figure 11.19 Reblozyl(R): Sales Forecast, 2021-2035 (USD Million)
- Figure 11.20 RyzneutaTM: Sales Forecast, 2022-2035 (USD Million)
- Figure 11.21 Strensiq(R): Sales Forecast, 2021-2035 (USD Million)
- Figure 11.22 Telitacicept: Sales Forecast, 2024-2035 (USD Million)
- Figure 12.1 Fc Protein Engineered and Glycoengineered Antibodies: Analysis by Phase of Development
- Figure 12.2 Fc Protein Engineered and Glycoengineered Antibodies: Analysis by Target Disease Indication
- Figure 12.3 Fc Protein Engineered and Glycoengineered Antibodies: Analysis by Therapeutic Area
- Figure 12.4 Fc Protein Engineered and Glycoengineered Antibodies: Analysis by Type of Fc Engineering
- Figure 12.5 Fc Protein Engineered and Glycoengineered Antibodies: Analysis by Impact of Fc Engineering
- Figure 12.6 Fc Protein Engineered and Glycoengineered Antibodies: Analysis by Route of Administration
- Figure 12.7 Fc Protein Engineered and Glycoengineered Antibodies: Analysis by Type of Therapy
- Figure 12.8 Fc Protein Engineered and Glycoengineered Antibodies Developers: Analysis by Year of Establishment
- Figure 12.9 Fc Protein Engineered and Glycoengineered Antibodies Developers Analysis by Company Size
- Figure 12.10 Fc Protein Engineered and Glycoengineered Antibodies Developers Analysis by Location of Headquarters
- Figure 13.1 Concluding Remarks: Overall market Landscape
- Figure 13.2 Concluding Remarks: Clinical Trial Analysis
- Figure 13.3 Concluding Remarks: Academic Grants Analysis
- Figure 13.4 Concluding Remarks: Publication Analysis
- Figure 13.5 Concluding Remarks: Patent Analysis
- Figure 13.6 Concluding Remarks: Partnerships and Collaborations
- Figure 13.7 Concluding Remarks: Market Forecast

