PUBLISHER: Roots Analysis | PRODUCT CODE: 2161676

PUBLISHER: Roots Analysis | PRODUCT CODE: 2161676
AI in Clinical Trials Market (3rd Edition) - Trends and Forecast Till 2035
AI IN CLINICAL TRIALS MARKET: OVERVIEW
The global AI in clinical trials market is estimated to grow from USD 3.96 billion in the current year to USD 11.61 billion by 2035, registering a CAGR of 12.7% during the forecast period.
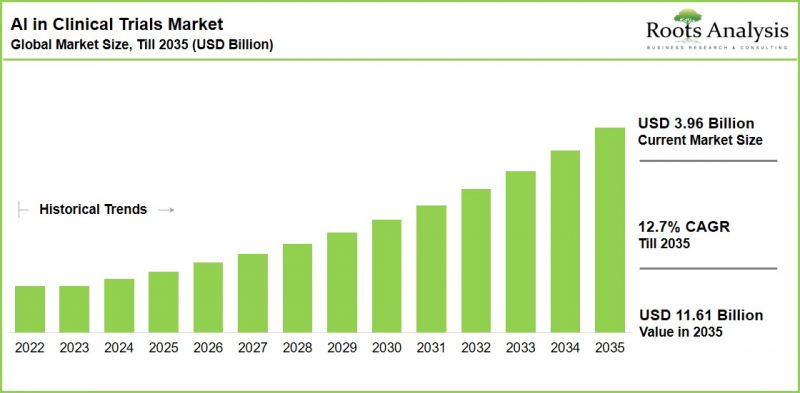
AI in Clinical Trials Market: Growth and Trends
Clinical trials account for a substantial share of the time and financial resources required to bring a new therapy to market, yet the transition rate from trial initiation to regulatory approval has remained at approximately 10% for decades. Key challenges include suboptimal study design, recruitment delays, inadequate patient stratification, and high participant dropout rates. Artificial intelligence (AI) is emerging as a potential means of addressing these inefficiencies by analyzing large, diverse datasets to optimize trial protocols, identify suitable clinical trial sites, improve patient selection, and enhance the efficiency of treatment evaluation throughout the drug development process.
Regulatory posture is shifting in tandem with adoption. Agencies including the FDA and EMA are actively building frameworks to accommodate AI-driven trial methodologies rather than treating AI as an ancillary tool, which is steadily converting institutional caution into structured, risk-based acceptance. As this regulatory scaffolding matures, AI is moving from a pilot capability confined to a handful of well-resourced sponsors toward a default expectation across trial operations, creating durable demand for the platforms, integration services, and data infrastructure that make AI-enabled trials possible.
Another key trend transforming the buyer landscape is the growing adoption of cloud-based, interoperable technology platforms for clinical trials. Mobile applications, wearable devices, and telehealth solutions are enabling continuous, real-time patient data collection throughout clinical studies. Supporting these capabilities requires scalable, cloud-native AI infrastructure that can integrate, process, and standardize data from geographically dispersed trial sites. This transition is also influencing how clinical trial software and services are bundled, deployed, and commercialized across the value chain.
Growth Drivers: Factors Fueling Market Expansion
AI-enabled remote participation and telehealth follow-up reduce travel, time, and cost burdens for trial participants, supporting better retention. Mobile apps, wearables, and telemedicine enable continuous patient monitoring. These tools help sponsors identify trends, adjust protocols, and streamline recruitment and data management. Clearer guidance from the FDA and the EU's evolving AI Act is also supporting AI adoption by providing more defined validation and documentation pathways.
Market Challenges: Critical Barriers Hindering Progress
AI models can produce inaccurate or incomplete outputs, making human validation essential for ensuring reliable therapeutic decisions and patient safety. Fragmented healthcare data and the lack of standardized data formats require extensive data processing, which can limit AI performance and reduce the reliability of clinical trials.
Regulatory Guidelines Shaping AI Adoption in Clinical Trials
- USFDA: Draft guidance on using AI to support regulatory decision-making sets out a seven-step, risk-based credibility assessment for AI models. Higher-risk applications, particularly those touching patient safety or trial efficacy, require rigorous validation, documented model training, and lifecycle monitoring through mechanisms such as Algorithm Change Protocols, with sponsors expected to demonstrate reliability for each specific context of use.
- EMA and EU Frameworks: The EMA's Big Data Strategy supports AI-enabled automation, insight generation, and decision support while managing associated risk. The EU AI Act separately classifies clinical-trial AI as high-risk, requiring transparency in decision logic, medical-device compliance, ethical data handling, and regulatory approval prior to deployment.
Recent Developments Signaling Momentum
Some of the recent initiatives signaling market momentum are listed below:
- PhaseV launched a centralized platform designed to automate the full span of clinical trial activities, from protocol drafting through final report submission.
- NetraMark released new findings from its proprietary AI platform identifying clinically meaningful responder subgroups within a landmark anti-amyloid Alzheimer's disease trial.
- Accenture acquired Faculty to expand its capability to help healthcare clients modernize core business processes using secure, outcome-driven AI solutions.
- Thermo Fisher Scientific and OpenAI entered into an agreement to embed advanced AI capabilities across Thermo Fisher's clinical trials business, aiming to accelerate drug development and simplify research processes.
AI in Clinical Trials Market Segments
The market sizing and opportunity analysis has been segmented across the following parameters:
By Trial Phase
- Phase I
- Phase II
- Phase III
By Type of Offering
- Software
- Services
By Deployment Mode
- Cloud-Based
- On-Premises
By Therapeutic Area
- Oncological Disorders
- Infectious Diseases
- CNS Disorders
- Metabolic Disorders
- Immunological Disorders
- Cardiovascular Disorders
- Other Disorders
By Technology Exposure
- Machine Learning
- Molecular Modeling and Simulation
- Deep Learning
- Omics Integration
- Generative Model
- Other Technologies
By End-User
- Biotechnology and Pharmaceutical Companies
- Academic Research Institutes
- Other End-Users
By Geographical Regions
- North America: US, Canada
- Europe: UK, Germany, France, Spain, Italy, Rest of Europe
- Asia-Pacific: China, Japan, South Korea, Australia, India
- Middle East and North Africa: Saudi Arabia, UAE, Egypt
- Latin America: Brazil, Mexico, Argentina
AI in Clinical Trials Market: Key Segment Insights
Phase II Trials Lead the Trial Phase Segment
Phase II trials currently hold the largest market share. This reflects their role as the critical proof-of-concept stage, where sponsors evaluate optimal dosing and efficacy across larger patient populations. Historically, these trials achieve success rates of only 30-40%.
Phase III trials, which can generate up to an estimated 3.6 million data points per study, are expected to grow at a faster rate. Growth will be driven by rising demand for real-time analysis, risk monitoring, and adaptive trial designs as data complexity increases.
Services Lead the Type of Offering Segment
The services segment currently holds the larger market share, driven by sponsor demand for outsourced expertise in implementing AI across trial operations. Software is projected to grow at a faster rate through 2035 as scalable, cloud-based platforms mature and support broader, longer-term integration across clinical trial processes.
Cloud-Based Deployment Dominates the Market
Cloud-based solutions currently account for the largest market share and are expected to remain dominant in the future. This dominance stems from their scalability, cost efficiency, and ability to enable collaboration among geographically distributed trial stakeholders. These advantages align closely with the growing adoption of decentralized trial models.
Oncological Disorders Lead the Therapeutic Area Segment
Oncological disorders are projected to represent nearly half of therapeutic-area demand by 2035. This expansion is driven by the scale and complexity of oncology trial data, which creates a compelling use case for AI-powered analytics, patient stratification, and clinical decision support.
Machine Learning Leads Technology Exposure, Generative Models Set to Grow Fastest
Machine learning currently holds the largest share among technology types, driven by its versatility in managing complex clinical datasets and delivering predictive modeling and real-time insights. Generative models, which create realistic synthetic patient data, are expected to achieve the fastest growth as sponsors increasingly use them to accelerate trial simulation and design.
Biotechnology and Pharmaceutical Companies Lead the End-user Segment
Biotechnology and pharmaceutical companies hold the largest end-user share and are expected to keep growing fastest. This dominance is supported by substantial R&D budgets, access to extensive proprietary datasets, and a strategic focus on compressing drug-development timelines through AI integration.
Asia-Pacific Dominates the Market and Leads Growth
Asia-Pacific is projected to grow at the fastest rate of any region through 2035. This dual position as both the largest and fastest-growing regional market is driven by rapid digital infrastructure expansion, rising clinical trial activity, and increasing pharmaceutical investment across China, India, Japan, and South Korea.
Example Players in AI in Clinical Trials Market
- Clarivate
- ConcertAI
- IQVIA
- LabCorp
- Medidata
- Microsoft
- PathAI
- ServiceNow
- Signant Health
- TransPerfect Life Sciences
Expert Interview and Industry Insights
Discussions with multiple stakeholders in this domain influenced the opinions and insights presented in this study. The market report includes transcripts of the interviews conducted with the following individuals:
- Co-founder, Chief Executive Officer and Chief Technology Officer, Small Company, Switzerland
- Founder and Chief Executive Officer, Mid-Sized Company, US
- Founder and Chief Executive Officer, Small Company, US
- Co-founder and Executive Director, Mid-Sized Company, US
- Chief Technology Officer, Chief Commercial Officer, Chief Delivery Officer, Mid-Sized Company, Head of Marketing, Mid-Sized Company, US
In addition, the market report includes transcripts of the following third-party discussions:
- Chief Science Officer, Large Company, US; Co-Founder and Chief Executive Officer, Mid-Sized Company, US; Chief Executive Officer, Mid-Sized Company, US; Associate Professor and Blue Cross California Distinguished Professor, Large Organization, US
- EVP, Chief Information, Technology, and Product Officer, Large Company, US
- Co-Founder and Chief Executive Officer, Mid-Sized Company, US
- Chief Technology Officer, Mid-Sized Company, US
- Director of the Office of Medical Policy (CDER), Large Organization, US
- Professor of Medicine, Large Organization, US; Program Manager, Large Organization, US; Director, Bioethics Lead, Large Company, US; Associate Dean, Human Research Protections and Director of the Human Research Protections Program, Large Organization, US; Executive IRB Chair and VP of IBC Affairs, Large Company, US
- Hematologist, AI Specialist, and Research Group Leader, Large Organization, Germany
- Cardiologist and Associate Director of the Accelerator for Clinical Transformation Research Group, Large Organization, US
- Heart Failure Cardiologist and Researcher, Large Organization, US
- Senior Community Development Manager, Mid-Sized Company, Netherlands
AI IN CLINICAL TRIALS MARKET: RESEARCH COVERAGE
- Market Sizing and Opportunity Analysis: An in-depth analysis of the market focusing on key segments, including trial phase, type of offering, deployment mode, therapeutic area, technology exposure, end-user, and geographical regions.
- Market Landscape: A detailed assessment of active AI-in-clinical-trials solution providers, featuring information on year of establishment, company size, location of headquarters, and type of offering.
- Company Profiles: In-depth profiles of prominent players engaged in AI-enabled clinical trial solutions, covering year of establishment, headquarters location, company size, product and service portfolio, and key recent initiatives.
- Regulatory Landscape Analysis: An overview of evolving regulatory guidance from bodies such as the FDA and EMA governing the use of AI in clinical trial design, conduct, and data analysis.
- Partnerships and Collaborations: An analysis of partnerships and collaborations inked by AI-in-clinical-trials companies, based on parameters such as year of partnership, type of partnership (platform integration versus distribution / reseller agreements), and most active players.
- Investment and Funding Analysis: An assessment of funding rounds, acquisitions, and strategic investments shaping the competitive landscape of the market.
- Market Impact Analysis: A detailed analysis of the key factors influencing the AI in clinical trials market, including drivers, restraints, emerging opportunities, and challenges affecting market growth, adoption, and competitive dynamics.
KEY QUESTIONS ANSWERED IN THIS REPORT
- Which are the leading companies in the AI in clinical trials market?
- Which region dominates the market, and which is growing the fastest?
- What are the key trends observed in this market?
- What factors are likely to influence the evolution of this market?
- What are the primary challenges faced by AI-in-clinical-trials companies and their delivery partners?
- What is the current and future market size?
- What is the CAGR of this market through 2035?
- How is current and future market opportunity distributed across key segments?
- What opportunities exist for distributors, resellers, and systems-integration partners entering this space?
REASONS TO BUY THIS REPORT
- Market Opportunity Analysis: Market estimates are built using a hybrid methodology that cross-validates top-down macro assessments against bottom-up, company-level product and sales data, minimizing forecast bias.
- Comprehensive Coverage: Spanning market sizing, competitive benchmarking, regulatory mapping, partnerships and collaborations, investment and funding analysis, and technology-exposure trends across key geographies.
- Primary Research-Backed Insights: Findings are validated through direct interviews with company executives, clinicians, bioethics leads, and regulatory officials, ensuring insights reflect real clinical and commercial conditions rather than desk research alone.
- Actionable Segmentation: Seven-parameter segmentation (trial phase, type of offering, deployment mode, therapeutic area, technology exposure, end-user, geography) enables precise opportunity sizing for any go-to-market or investment thesis.
ADDITIONAL BENEFITS
- Complementary PPT Insights Pack
- Complementary Excel Data Packs for all Analytical Modules in the Report
- 15% Free Content Customization
- Detailed Report Walkthrough Session with Research Team
- Free Updated Report if the Report is 6-12 Months Old or Older
TABLE OF CONTENTS
1. PREFACE
- 1.1. Introduction
- 1.2. Report Coverage
- 1.3. Market Segmentation
- 1.4. Key Market Insights
- 1.5. Market Share Insights
- 1.6. Key Questions Answered
2. RESEARCH METHODOLOGY
- 2.1. Chapter Overview
- 2.2. Research Assumptions
- 2.2.1. Market Landscape and Market Trends
- 2.2.2. Market Forecast and Opportunity Analysis
- 2.2.3. Comparative Analysis
- 2.3. Database Building
- 2.3.1. Data Collection
- 2.3.2. Data Validation
- 2.3.3. Data Analysis
- 2.4. Project Methodology
- 2.4.1. Secondary Research
- 2.4.1.1. Annual Reports
- 2.4.1.2. Academic Research Papers
- 2.4.1.3. Company Websites
- 2.4.1.4. Investor Presentations
- 2.4.1.5. Regulatory Filings
- 2.4.1.6. White Papers
- 2.4.1.7. Industry Publications
- 2.4.1.8. Conferences and Seminars
- 2.4.1.9. Government Portals
- 2.4.1.10. Media and Press Releases
- 2.4.1.11. Newsletters
- 2.4.1.12. Industry Databases
- 2.4.1.13. Roots Proprietary Databases
- 2.4.1.14. Paid Databases and Sources
- 2.4.1.15. Social Media Portals
- 2.4.1.16. Other Secondary Sources
- 2.4.2. Primary Research
- 2.4.2.1. Types of Primary Research
- 2.4.2.1.1. Qualitative Research
- 2.4.2.1.2. Quantitative Research
- 2.4.2.1.3. Hybrid Approach
- 2.4.2.2. Advantages of Primary Research
- 2.4.2.3. Techniques for Primary Research
- 2.4.2.3.1. Interviews
- 2.4.2.3.2. Surveys
- 2.4.2.3.3. Focus Groups
- 2.4.2.3.4. Observational Research
- 2.4.2.3.5. Social Media Interactions
- 2.4.2.4. Key Opinion Leaders Considered in Primary Research
- 2.4.2.4.1. Company Executives (CXOs)
- 2.4.2.4.2. Board of Directors
- 2.4.2.4.3. Company Presidents and Vice Presidents
- 2.4.2.4.4. Research and Development Heads
- 2.4.2.4.5. Technical Experts
- 2.4.2.4.6. Subject Matter Experts
- 2.4.2.4.7. Scientists
- 2.4.2.4.8. Doctors and Other Healthcare Providers
- 2.4.2.5. Ethics and Integrity
- 2.4.2.5.1. Research Ethics
- 2.4.2.5.2. Data Integrity
- 2.4.2.1. Types of Primary Research
- 2.4.3 Analytical Tools and Databases
- 2.4.1. Secondary Research
- 2.5. Robust Quality Control
3. MARKET DYNAMICS
- 3.1. Chapter Overview
- 3.2. Forecast Methodology
- 3.2.1. Top-down Approach
- 3.2.2. Bottom-up Approach
- 3.2.3. Hybrid Approach
- 3.3. Market Assessment Framework
- 3.3.1 Total Addressable Market (TAM)
- 3.3.2. Serviceable Addressable Market (SAM)
- 3.3.3. Serviceable Obtainable Market (SOM)
- 3.3.4. Currently Acquired Market (CAM)
- 3.4. Forecasting Tools and Techniques
- 3.4.1. Qualitative Forecasting
- 3.4.2. Correlation
- 3.4.3. Regression
- 3.4.4. Extrapolation
- 3.4.5. Convergence
- 3.4.6. Sensitivity Analysis
- 3.4.7. Scenario Planning
- 3.4.8. Data Visualization
- 3.4.9. Time Series Analysis
- 3.4.10. Forecast Error Analysis
- 3.5. Key Considerations
- 3.5.1. Demographics
- 3.5.2. Government Regulations
- 3.5.3. Reimbursement Scenarios
- 3.5.4. Market Access
- 3.5.5. Supply Chain
- 3.5.6. Industry Consolidation
- 3.5.7. Pandemic / Unforeseen Disruptions Impact
- 3.6. Limitations
4. MACRO-ECONOMIC INDICATORS
- 4.1. Chapter Overview
- 4.2. Market Dynamics
- 4.2.1. Time Period
- 4.2.1.1. Historical Trends
- 4.2.1.2. Current and Forecasted Estimates
- 4.2.2. Currency Coverage
- 4.2.2.1. Major Currencies Affecting the Market
- 4.2.2.2. Factors Affecting Currency Fluctuations on the Industry
- 4.2.2.3. Impact of Currency Fluctuations on the Industry
- 4.2.3. Foreign Currency Exchange Rate
- 4.2.3.1. Impact of Foreign Exchange Rate Volatility on the Market
- 4.2.3.2. Strategies for Mitigating Foreign Exchange Risk
- 4.2.4. Recession
- 4.2.4.1. Assessment of Current Economic Conditions and Potential Impact on the Market
- 4.2.4.2. Historical Analysis of Past Recessions and Lessons Learnt
- 4.2.5. Inflation
- 4.2.5.1. Measurement and Analysis of Inflationary Pressures in the Economy
- 4.2.5.2. Potential Impact of Inflation on the Market Evolution
- 4.2.6. Interest Rates
- 4.2.6.1. Interest Rates and Their Impact on the Market
- 4.2.6.2. Strategies for Managing Interest Rate Risk
- 4.2.7. Commodity Flow Analysis
- 4.2.7.1. Type of Commodity
- 4.2.7.2. Origins and Destinations
- 4.2.7.3. Values and Weights
- 4.2.7.4. Modes of Transportation
- 4.2.8. Global Trade Dynamics
- 4.2.8.1. Import Scenario
- 4.2.8.2. Export Scenario
- 4.2.8.3. Trade Policies
- 4.2.8.4. Strategies for Mitigating the Risks Associated with Trade Barriers
- 4.2.8.5. Impact of Trade Barriers on the Market
- 4.2.9. War Impact Analysis
- 4.2.9.1. Russian-Ukraine War
- 4.2.9.2. Israel-Hamas War
- 4.2.10. COVID Impact / Related Factors
- 4.2.10.1. Global Economic Impact
- 4.2.10.2. Industry-specific Impact
- 4.2.10.3. Government Response and Stimulus Measures
- 4.2.10.4. Future Outlook and Adaptation Strategies
- 4.2.11. Other Indicators
- 4.2.11.1. Fiscal Policy
- 4.2.11.2. Consumer Spending
- 4.2.11.3. Gross Domestic Product
- 4.2.11.4. Employment
- 4.2.11.5. Taxes
- 4.2.11.6. Stock Market Performance
- 4.2.11.7. Cross Border Dynamics
- 4.2.1. Time Period
- 4.3. Conclusion
5. EXECUTIVE SUMMARY
6. INTRODUCTION
- 6.1. Chapter Overview
- 6.2. Evolution of AI
- 6.3. Subfields of AI
- 6.4. Applications of AI in Healthcare
- 6.4.1. Drug Discovery
- 6.4.2. Drug Manufacturing
- 6.4.3. Marketing
- 6.4.4. Diagnosis and Treatment
- 6.4.5. Clinical Trials
- 6.5. AI in Clinical Trials
- 6.6. Challenges Associated with the Adoption of AI
- 6.7. Future Perspective
7. MARKET LANDSCAPE
- 7.1. Chapter Overview
- 7.2. AI in Clinical Trials: AI Software and Service Providers Landscape
- 7.2.1. Analysis by Year of Establishment
- 7.2.2. Analysis by Company Size
- 7.2.3. Analysis by Location of Headquarters
- 7.2.4. Analysis by Company Size and Location of Headquarters (Region)
- 7.2.5. Analysis by Key Offerings
- 7.2.6. Analysis by Deployment Options
- 7.2.7. Analysis by Type of AI Technology Used
- 7.2.8. Analysis by End-user
- 7.2.9. Analysis by Application Area
8. COMPANY PROFILES
- 8.1. Chapter Overview
- 8.2. Clarivate*
- 8.2.1. Company Overview
- 8.2.2. Financial Information
- 8.2.3. Offerings Portfolio
- 8.2.4. Recent Developments and Future Outlook
- Similar details are presented for other companies mentioned below (based on information in the public domain)
- 8.3. ConcertAI
- 8.4. IQVIA
- 8.5. LabCorp
- 8.6. Medidata
- 8.7. Microsoft
- 8.8. PathAI
- 8.9. ServiceNow
- 8.10. Signant Health
- 8.11. TransPerfect Life Sciences
9. CLINICAL TRIAL ANALYSIS
- 9.1. Chapter Overview
- 9.2. Scope and Methodology
- 9.3. AI in Clinical Trials
- 9.3.1. Analysis by Trial Registration Year
- 9.3.2. Analysis by Number of Patients Enrolled
- 9.3.3. Analysis by Trial Phase
- 9.3.4. Analysis by Trial Status
- 9.3.5. Analysis by Trial Registration Year and Status
- 9.3.6. Analysis by Type of Sponsor
- 9.3.7. Analysis by Patient Gender
- 9.3.8. Analysis by Patient Age
- 9.3.9. Word Cloud Analysis: Emerging Focus Areas
- 9.3.10. Analysis by Target Therapeutic Area
- 9.3.11. Analysis by Study Design
- 9.3.11.1. Analysis by Type of Patient Allocation Model Used
- 9.3.11.2. Analysis by Type of Trial Masking Adopted
- 9.3.11.3. Analysis by Type of Intervention
- 9.3.11.4. Analysis by Trial Purpose
- 9.3.12. Most Active Players: Analysis by Number of Clinical Trials
- 9.3.13. Analysis of Clinical Trials by Geography
- 9.3.14. Analysis of Clinical Trials by Geography and Trial Status
- 9.3.15. Analysis of Patients Enrolled by Geography and Trial Registration Year
- 9.3.16. Analysis of Patients Enrolled by Geography and Trial Status
10. PARTNERSHIPS AND COLLABORATIONS
- 10.1. Chapter Overview
- 10.2. Partnership Models
- 10.3. AI in Clinical Trials: Partnerships and Collaborations
- 10.3.1. Analysis by Monthly Trend of Partnership
- 10.3.2. Analysis by Type of Partnership
- 10.3.3. Analysis by Type of Partner
- 10.3.4. Most Active Players: Analysis by Number of Partnerships
- 10.3.5. Analysis by Geography
- 10.3.5.1. Local and International Agreements
- 10.3.5.2. Intracontinental and Intercontinental Agreements
11. FUNDING AND INVESTMENT ANALYSIS
- 11.1. Chapter Overview
- 11.2. Funding Models
- 11.3. AI in Clinical Trials: Funding and Investments
- 11.3.1. Analysis of Instances by Month-Year of Funding
- 11.3.2. Analysis of Amount Invested by Month-Year of Funding
- 11.3.3. Analysis of Instances by Type of Funding
- 11.3.4. Analysis of Amount Invested by Type of Funding
- 11.3.5. Analysis by Geography
- 11.3.6. Most Active Players: Analysis by Number of Funding Instances
- 11.3.7. Leading Investors: Analysis by Number of Funding Instances
- 11.4. Concluding Remarks
12. BIG PHARMA INITIATIVES
- 12.1. Chapter Overview
- 12.2. Scope and Methodology
- 12.3. Analysis by Year of Initiative
- 12.4. Analysis by Type of Initiative
- 12.5. Analysis by Application Area of AI
- 12.6. Analysis by Target Therapeutic Area
- 12.7. Benchmarking Analysis: Big Pharma Players
13. AI IN CLINICAL TRIALS: USE CASES
- 13.1. Chapter Overview
- 13.2. Use Case 1: Collaboration between Roche and AiCure
- 13.2.1. Roche
- 13.2.2. AiCure
- 13.2.3. Business Needs
- 13.2.4. Objectives Achieved and Solutions Provided
- 13.3. Use Case 2: Collaboration between Takeda and AiCure
- 13.3.1. Takeda
- 13.3.2. AiCure
- 13.3.3. Business Needs
- 13.3.4. Objectives Achieved and Solutions Provided
- 13.4. Use Case 3: Collaboration between Teva Pharmaceuticals and Intel
- 13.4.1. Teva Pharmaceuticals
- 13.4.2. Intel
- 13.4.3. Business Needs
- 13.4.4. Objectives Achieved and Solutions Provided
- 13.5. Use Case 4: Collaboration between Undisclosed Pharmaceutical Company and Antidote
- 13.5.1. Antidote
- 13.5.2. Business Needs
- 13.5.3. Objectives Achieved and Solutions Provided
- 13.6. Use Case 5: Collaboration between Undisclosed Pharmaceutical Company and Cognizant
- 13.6.1. Cognizant
- 13.6.2. Business Needs
- 13.6.3. Objectives Achieved and Solutions Offered
- 13.7. Use Case 6: Collaboration between Cedars-Sinai Medical Center and Deep 6 AI
- 13.7.1. Cedars-Sinai Medical Center
- 13.7.2. Deep 6 AI
- 13.7.3. Business Needs
- 13.7.4. Objectives Achieved and Solutions Offered
- 13.8. Use Case 7: Collaboration between GlaxoSmithKline (GSK) and PathAI
- 13.8.1. PathAI
- 13.8.2. GlaxoSmithKline (GSK)
- 13.8.3. Business Needs
- 13.8.4. Objectives Achieved and Solutions Provided
- 13.9. Use Case 8: Collaboration between Bristol Myers Squibb (BMS) and Concert AI
- 13.9.1. Concert AI
- 13.9.2. Bristol Myers Squibb (BMS)
- 13.9.3. Business Needs
- 13.9.4. Objectives Achieved and Solutions Provided
14. VALUE CREATION FRAMEWORK: A STRATEGIC GUIDE TO ADDRESS UNMET NEEDS IN CLINICAL TRIALS
- 14.1. Chapter Overview
- 14.2. Unmet Needs in Clinical Trials
- 14.3. Key Assumptions and Methodology
- 14.4. Key Tools and Technologies
- 14.4.1. Blockchain
- 14.4.2. Big Data Analytics
- 14.4.3. Real-world Evidence
- 14.4.4. Digital Twins
- 14.4.5. Cloud Computing
- 14.4.6. Internet of Things (IoT)
- 14.5. Trends in Research Activity
- 14.6. Trends in Intellectual Capital
- 14.7. Extent of Innovation versus Associated Risks
- 14.8. Results and Discussion
15. COST SAVING ANALYSIS
- 15.1. Chapter Overview
- 15.2. Key Assumptions and Methodology
- 15.3. Overall Cost Saving Potential Associated with Use of AI in Clinical Trials, Till 2035
- 15.3.1. Cost Saving Potential: Distribution by Trial Phase, 2026 and 2035
- 15.3.1.1. Cost Saving Potential in Phase I Clinical Trials, Till 2035
- 15.3.1.2. Cost Saving Potential in Phase II Clinical Trials, Till 2035
- 15.3.1.3. Cost Saving Potential in Phase III Clinical Trials, Till 2035
- 15.3.2. Cost Saving Potential: Distribution by Trial Procedure, 2026 and 2035
- 15.3.2.1. Cost Saving Potential in Patient Recruitment, Till 2035
- 15.3.2.2. Cost Saving Potential in Staffing and Administration, Till 2035
- 15.3.2.3. Cost Saving Potential in Site Monitoring, Till 2035
- 15.3.2.4. Cost Saving Potential in Source Data Verification, Till 2035
- 15.3.2.5. Cost Saving Potential in Patient Retention, Till 2035
- 15.3.2.6. Cost Saving Potential in Other Procedures, Till 2035
- 15.3.1. Cost Saving Potential: Distribution by Trial Phase, 2026 and 2035
- 15.4. Conclusion
16. MARKET IMPACT ANALYSIS
- 16.1. Chapter Overview
- 16.2. Market Drivers
- 16.3. Market Restraints
- 16.4. Market Opportunities
- 16.5. Market Challenges
- 16.6. Conclusion
17. GLOBAL AI IN CLINICAL TRIALS MARKET
- 17.1. Chapter Overview
- 17.2. Key Assumptions and Methodology
- 17.3. Global AI in Clinical Trials Market: Historical Trends (Since 2022) and Forecasted Estimates (Till 2035)
- 17.3.1. Scenario Analysis
- 17.3.1.1. Conservative Scenario
- 17.3.1.2. Optimistic Scenario
- 17.3.1. Scenario Analysis
- 17.4. Key Market Segmentation
18. AI IN CLINICAL TRIALS MARKET, BY TRIAL PHASE
- 18.1. Chapter Overview
- 18.2. Key Assumptions and Methodology
- 18.3. AI in Clinical Trials Market: Distribution by Trial Phase
- 18.3.1. AI in Clinical Trials Market for Phase I: Historical Trends (Since 2022) and Forecasted Estimates (Till 2035)
- 18.3.2. AI in Clinical Trials Market for Phase II: Historical Trends (Since 2022) and Forecasted Estimates (Till 2035)
- 18.3.3. AI in Clinical Trials Market for Phase III: Historical Trends (Since 2022) and Forecasted Estimates (Till 2035)
- 18.4. Data Triangulation and Validation
19. AI IN CLINICAL TRIALS MARKET, BY TYPE OF OFFERING
- 19.1. Chapter Overview
- 19.2. Key Assumptions and Methodology
- 19.3. AI in Clinical Trials Market: Distribution by Type of Offering
- 19.3.1. AI in Clinical Trials Market for Software: Historical Trends (Since 2022) and Forecasted Estimates (Till 2035)
- 19.3.2. AI in Clinical Trials Market for Services: Historical Trends (Since 2022) and Forecasted Estimates (Till 2035)
- 19.4. Data Triangulation and Validation
20. AI IN CLINICAL TRIALS MARKET, BY DEPLOYMENT MODE
- 20.1. Chapter Overview
- 20.2. Key Assumptions and Methodology
- 20.3. AI in Clinical Trials Market: Distribution by Deployment Mode
- 20.3.1. AI in Clinical Trials Market for Cloud-based Deployment: Historical Trends (Since 2022) and Forecasted Estimates (Till 2035)
- 20.3.2. AI in Clinical Trials Market for On-premises Deployment: Historical Trends (Since 2022) and Forecasted Estimates (Till 2035)
- 20.4. Data Triangulation and Validation
21. AI IN CLINICAL TRIALS MARKET, BY THERAPEUTIC AREA
- 21.1. Chapter Overview
- 21.2. Key Assumptions and Methodology
- 21.3. AI in Clinical Trials Market: Distribution by Therapeutic Area
- 21.3.1. AI in Clinical Trials Market for Oncological Disorders: Historical Trends (Since 2022) and Forecasted Estimates (Till 2035)
- 21.3.2. AI in Clinical Trials Market for Infectious Diseases: Historical Trends (Since 2022) and Forecasted Estimates (Till 2035)
- 21.3.3. AI in Clinical Trials Market for CNS Disorders: Historical Trends (Since 2022) and Forecasted Estimates (Till 2035)
- 21.3.4. AI in Clinical Trials Market for Metabolic Disorders: Historical Trends (Since 2022) and Forecasted Estimates (Till 2035)
- 21.3.5. AI in Clinical Trials Market for Immunological Disorders: Historical Trends (Since 2022) and Forecasted Estimates (Till 2035)
- 21.3.6. AI in Clinical Trials Market for Cardiovascular Disorders: Historical Trends (Since 2022) and Forecasted Estimates (Till 2035)
- 21.3.7. AI in Clinical Trials Market for Other Disorders: Historical Trends (Since 2022) and Forecasted Estimates (Till 2035)
- 21.4. Data Triangulation and Validation
22. AI IN CLINICAL TRIALS MARKET, BY TECHNOLOGY EXPOSURE
- 22.1. Chapter Overview
- 22.2. Key Assumptions and Methodology
- 22.3. AI in Clinical Trials Market: Distribution by Technology Exposure
- 22.3.1. AI in Clinical Trials Market for Machine Learning: Historical Trends (Since 2022) and Forecasted Estimates (Till 2035)
- 22.3.2. AI in Clinical Trials Market for Molecular Modeling and Simulation: Historical Trends (Since 2022) and Forecasted Estimates (Till 2035)
- 22.3.3. AI in Clinical Trials Market for Deep Learning: Historical Trends (Since 2022) and Forecasted Estimates (Till 2035)
- 22.3.4. AI in Clinical Trials Market for Omics Integration: Historical Trends (Since 2022) and Forecasted Estimates (Till 2035)
- 22.3.5. AI in Clinical Trials Market for Generative Model: Historical Trends (Since 2022) and Forecasted Estimates (Till 2035)
- 22.3.6. AI in Clinical Trials Market for Other Technologies: Historical Trends (Since 2022) and Forecasted Estimates (Till 2035)
- 22.4. Data Triangulation and Validation
23. AI IN CLINICAL TRIALS MARKET, BY END-USER
- 23.1. Chapter Overview
- 23.2. Key Assumptions and Methodology
- 23.3. AI in Clinical Trials Market: Distribution by End-user
- 23.3.1. AI in Clinical Trials Market for Biotechnology and Pharmaceutical Companies: Historical Trends (Since 2022) and Forecasted Estimates (Till 2035)
- 23.3.2. AI in Clinical Trials Market for Academic Research Institutes and Other End-users: Historical Trends (Since 2022) and Forecasted Estimates (Till 2035)
- 23.4. Data Triangulation and Validation
24. AI IN CLINICAL TRIALS MARKET, BY GEOGRAPHICAL REGIONS
- 24.1. Chapter Overview
- 24.2. Key Assumptions and Methodology
- 24.3. AI in Clinical Trials Market: Distribution by Geographical Regions
- 24.3.1. AI in Clinical Trials Market in North America: Historical Trends (Since 2022) and Forecasted Estimates (Till 2035)
- 24.3.1.1. AI in Clinical Trials Market in the US: Historical Trends (Since 2022) and Forecasted Estimates (Till 2035)
- 24.3.1.2. AI in Clinical Trials Market in Canada: Historical Trends (Since 2022) and Forecasted Estimates (Till 2035)
- 24.3.2. AI in Clinical Trials Market in Europe: Historical Trends (Since 2022) and Forecasted Estimates (Till 2035)
- 24.3.2.1. AI in Clinical Trials Market in the UK: Historical Trends (Since 2022) and Forecasted Estimates (Till 2035)
- 24.3.2.2. AI in Clinical Trials Market in Germany: Historical Trends (Since 2022) and Forecasted Estimates (Till 2035)
- 24.3.2.3. AI in Clinical Trials Market in France: Historical Trends (Since 2022) and Forecasted Estimates (Till 2035)
- 24.3.2.4. AI in Clinical Trials Market in Spain: Historical Trends (Since 2022) and Forecasted Estimates (Till 2035)
- 24.3.2.5. AI in Clinical Trials Market in Italy: Historical Trends (Since 2022) and Forecasted Estimates (Till 2035)
- 24.3.2.6. AI in Clinical Trials Market in Rest of Europe: Historical Trends (Since 2022) and Forecasted Estimates (Till 2035)
- 24.3.3. AI in Clinical Trials Market in Asia-Pacific: Historical Trends (Since 2022) and Forecasted Estimates (Till 2035)
- 24.3.3.1. AI in Clinical Trials Market in China: Historical Trends (Since 2022) and Forecasted Estimates (Till 2035)
- 24.3.3.2. AI in Clinical Trials Market in Japan: Historical Trends (Since 2022) and Forecasted Estimates (Till 2035)
- 24.3.3.3. AI in Clinical Trials Market in South Korea: Historical Trends (Since 2022) and Forecasted Estimates (Till 2035)
- 24.3.3.4. AI in Clinical Trials Market in Australia: Historical Trends (Since 2022) and Forecasted Estimates (Till 2035)
- 24.3.3.5. AI in Clinical Trials Market in India: Historical Trends (Since 2022) and Forecasted Estimates (Till 2035)
- 24.3.4. AI in Clinical Trials Market in Middle East and North Africa: Historical Trends (Since 2022) and Forecasted Estimates (Till 2035)
- 24.3.4.1. AI in Clinical Trials Market in Saudi Arabia: Historical Trends (Since 2022) and Forecasted Estimates (Till 2035)
- 24.3.4.2. AI in Clinical Trials Market in UAE: Historical Trends (Since 2022) and Forecasted Estimates (Till 2035)
- 24.3.4.3. AI in Clinical Trials Market in Egypt: Historical Trends (Since 2022) and Forecasted Estimates (Till 2035)
- 24.3.5. AI in Clinical Trials Market in Latin America: Historical Trends (Since 2022) and Forecasted Estimates (Till 2035)
- 24.3.5.1. AI in Clinical Trials Market in Brazil: Historical Trends (Since 2022) and Forecasted Estimates (Till 2035)
- 24.3.5.2. AI in Clinical Trials Market in Mexico: Historical Trends (Since 2022) and Forecasted Estimates (Till 2035)
- 24.3.5.3. AI in Clinical Trials Market in Argentina: Historical Trends (Since 2022) and Forecasted Estimates (Till 2035)
- 24.3.1. AI in Clinical Trials Market in North America: Historical Trends (Since 2022) and Forecasted Estimates (Till 2035)
- 24.4. Market Dynamics Assessment
- 24.4.1. Market Movement Analysis
- 24.4.2. Penetration-Growth (P-G) Matrix
- 24.5. Data Triangulation and Validation
25. MARKET OPPORTUNITY ANALYSIS: NORTH AMERICA
- 25.1. AI in Clinical Trials Market in North America: Distribution by Trial Phase
- 25.1.1. AI in Clinical Trials Market in North America for Phase I, Historical Trends (Since 2022) and Forecasted Estimates (Till 2035)
- 25.1.2. AI in Clinical Trials Market in North America for Phase II, Historical Trends (Since 2022) and Forecasted Estimates (Till 2035)
- 25.1.3. AI in Clinical Trials Market in North America for Phase III, Historical Trends (Since 2022) and Forecasted Estimates (Till 2035)
- 25.2. AI in Clinical Trials Market in North America: Distribution by Type of Offering
- 25.2.1. AI in Clinical Trials Market in North America for Software, Historical Trends (Since 2022) and Forecasted Estimates (Till 2035)
- 25.2.2. AI in Clinical Trials Market in North America for Services, Historical Trends (Since 2022) and Forecasted Estimates (Till 2035)
- 25.3. AI in Clinical Trials Market in North America: Distribution by Deployment Mode
- 25.3.1. AI in Clinical Trials Market in North America for Cloud-based Deployment, Historical Trends (Since 2022) and Forecasted Estimates (Till 2035)
- 25.3.2. AI in Clinical Trials Market in North America for On-premises Deployment, Historical Trends (Since 2022) and Forecasted Estimates (Till 2035)
- 25.4. AI in Clinical Trials Market in North America: Distribution by Therapeutic Area
- 25.4.1. AI in Clinical Trials Market in North America for Oncological Disorders, Historical Trends (Since 2022) and Forecasted Estimates (Till 2035)
- 25.4.2. AI in Clinical Trials Market in North America for Infectious Diseases, Historical Trends (Since 2022) and Forecasted Estimates (Till 2035)
- 25.4.3. AI in Clinical Trials Market in North America for CNS Disorders, Historical Trends (Since 2022) and Forecasted Estimates (Till 2035)
- 25.4.4. AI in Clinical Trials Market in North America for Metabolic Disorders, Historical Trends (Since 2022) and Forecasted Estimates (Till 2035)
- 25.4.5. AI in Clinical Trials Market in North America for Immunological Disorders, Historical Trends (Since 2022) and Forecasted Estimates (Till 2035)
- 25.4.6. AI in Clinical Trials Market in North America for Cardiovascular Disorders, Historical Trends (Since 2022) and Forecasted Estimates (Till 2035)
- 25.4.7. AI in Clinical Trials Market in North America for Other Disorders, Historical Trends (Since 2022) and Forecasted Estimates (Till 2035)
- 25.5. AI in Clinical Trials Market in North America: Distribution by Technology Exposure
- 25.5.1. AI in Clinical Trials Market in North America for Machine Learning, Historical Trends (Since 2022) and Forecasted Estimates (Till 2035)
- 25.5.2. AI in Clinical Trials Market in North America for Molecular Modeling and Simulation, Historical Trends (Since 2022) and Forecasted Estimates (Till 2035)
- 25.5.3. AI in Clinical Trials Market in North America for Deep Learning, Historical Trends (Since 2022) and Forecasted Estimates (Till 2035)
- 25.5.4. AI in Clinical Trials Market in North America for Omics Integration, Historical Trends (Since 2022) and Forecasted Estimates (Till 2035)
- 25.5.5. AI in Clinical Trials Market in North America for Generative Model, Historical Trends (Since 2022) and Forecasted Estimates (Till 2035)
- 25.5.6. AI in Clinical Trials Market in North America for Other Technologies, Historical Trends (Since 2022) and Forecasted Estimates (Till 2035)
- 25.6. AI in Clinical Trials Market in North America: Distribution by End-user
- 25.6.1. AI in Clinical Trials Market in North America for Biotechnology and Pharmaceutical Companies, Historical Trends (Since 2022) and Forecasted Estimates (Till 2035)
- 25.6.2. AI in Clinical Trials Market in North America for Academic Research Institutes and Other End-users, Historical Trends (Since 2022) and Forecasted Estimates (Till 2035)
26. MARKET OPPORTUNITY ANALYSIS: EUROPE
- 26.1. AI in Clinical Trials Market in Europe: Distribution by Trial Phase
- 26.1.1. AI in Clinical Trials Market in Europe for Phase I, Historical Trends (Since 2022) and Forecasted Estimates (Till 2035)
- 26.1.2. AI in Clinical Trials Market in Europe for Phase II, Historical Trends (Since 2022) and Forecasted Estimates (Till 2035)
- 26.1.3. AI in Clinical Trials Market in Europe for Phase III, Historical Trends (Since 2022) and Forecasted Estimates (Till 2035)
- 26.2. AI in Clinical Trials Market in Europe: Distribution by Type of Offering
- 26.2.1. AI in Clinical Trials Market in Europe for Software, Historical Trends (Since 2022) and Forecasted Estimates (Till 2035)
- 26.2.2. AI in Clinical Trials Market in Europe for Services, Historical Trends (Since 2022) and Forecasted Estimates (Till 2035)
- 26.3. AI in Clinical Trials Market in Europe: Distribution by Deployment Mode
- 26.3.1. AI in Clinical Trials Market in Europe for Cloud-based Deployment, Historical Trends (Since 2022) and Forecasted Estimates (Till 2035)
- 26.3.2. AI in Clinical Trials Market in Europe for On-premises Deployment, Historical Trends (Since 2022) and Forecasted Estimates (Till 2035)
- 26.4. AI in Clinical Trials Market in Europe: Distribution by Therapeutic Area
- 26.4.1. AI in Clinical Trials Market in Europe for Oncological Disorders, Historical Trends (Since 2022) and Forecasted Estimates (Till 2035)
- 26.4.2. AI in Clinical Trials Market in Europe for Infectious Diseases, Historical Trends (Since 2022) and Forecasted Estimates (Till 2035)
- 26.4.3. AI in Clinical Trials Market in Europe for CNS Disorders, Historical Trends (Since 2022) and Forecasted Estimates (Till 2035)
- 26.4.4. AI in Clinical Trials Market in Europe for Metabolic Disorders, Historical Trends (Since 2022) and Forecasted Estimates (Till 2035)
- 26.4.5. AI in Clinical Trials Market in Europe for Immunological Disorders, Historical Trends (Since 2022) and Forecasted Estimates (Till 2035)
- 26.4.6. AI in Clinical Trials Market in Europe for Cardiovascular Disorders, Historical Trends (Since 2022) and Forecasted Estimates (Till 2035)
- 26.4.7. AI in Clinical Trials Market in Europe for Other Disorders, Historical Trends (Since 2022) and Forecasted Estimates (Till 2035)
- 26.5. AI in Clinical Trials Market in Europe: Distribution by Technology Exposure
- 26.5.1. AI in Clinical Trials Market in Europe for Machine Learning, Historical Trends (Since 2022) and Forecasted Estimates (Till 2035)
- 26.5.2. AI in Clinical Trials Market in Europe for Molecular Modeling and Simulation, Historical Trends (Since 2022) and Forecasted Estimates (Till 2035)
- 26.5.3. AI in Clinical Trials Market in Europe for Deep Learning, Historical Trends (Since 2022) and Forecasted Estimates (Till 2035)
- 26.5.4. AI in Clinical Trials Market in Europe for Omics Integration, Historical Trends (Since 2022) and Forecasted Estimates (Till 2035)
- 26.5.5. AI in Clinical Trials Market in Europe for Generative Model, Historical Trends (Since 2022) and Forecasted Estimates (Till 2035)
- 26.5.6. AI in Clinical Trials Market in Europe for Other Technologies, Historical Trends (Since 2022) and Forecasted Estimates (Till 2035)
- 26.6. AI in Clinical Trials Market in Europe: Distribution by End-user
- 26.6.1. AI in Clinical Trials Market in Europe for Biotechnology and Pharmaceutical Companies, Historical Trends (Since 2022) and Forecasted Estimates (Till 2035)
- 26.6.2. AI in Clinical Trials Market in Europe for Academic Research Institutes and Other End-users, Historical Trends (Since 2022) and Forecasted Estimates (Till 2035)
27. MARKET OPPORTUNITY ANALYSIS: ASIA-PACIFIC
- 27.1. AI in Clinical Trials Market in Asia-Pacific: Distribution by Trial Phase
- 27.1.1. AI in Clinical Trials Market in Asia-Pacific for Phase I, Historical Trends (Since 2022) and Forecasted Estimates (Till 2035)
- 27.1.2. AI in Clinical Trials Market in Asia-Pacific for Phase II, Historical Trends (Since 2022) and Forecasted Estimates (Till 2035)
- 27.1.3. AI in Clinical Trials Market in Asia-Pacific for Phase III, Historical Trends (Since 2022) and Forecasted Estimates (Till 2035)
- 27.2. AI in Clinical Trials Market in Asia-Pacific: Distribution by Type of Offering
- 27.2.1. AI in Clinical Trials Market in Asia-Pacific for Software, Historical Trends (Since 2022) and Forecasted Estimates (Till 2035)
- 27.2.2. AI in Clinical Trials Market in Asia-Pacific for Services, Historical Trends (Since 2022) and Forecasted Estimates (Till 2035)
- 27.3. AI in Clinical Trials Market in Asia-Pacific: Distribution by Deployment Mode
- 27.3.1. AI in Clinical Trials Market in Asia-Pacific for Cloud-based Deployment, Historical Trends (Since 2022) and Forecasted Estimates (Till 2035)
- 27.3.2. AI in Clinical Trials Market in Asia-Pacific for On-premises Deployment, Historical Trends (Since 2022) and Forecasted Estimates (Till 2035)
- 27.4. AI in Clinical Trials Market in Asia-Pacific: Distribution by Therapeutic Area
- 27.4.1. AI in Clinical Trials Market in Asia-Pacific for Oncological Disorders, Historical Trends (Since 2022) and Forecasted Estimates (Till 2035)
- 27.4.2. AI in Clinical Trials Market in Asia-Pacific for Infectious Diseases, Historical Trends (Since 2022) and Forecasted Estimates (Till 2035)
- 27.4.3. AI in Clinical Trials Market in Asia-Pacific for CNS Disorders, Historical Trends (Since 2022) and Forecasted Estimates (Till 2035)
- 27.4.4. AI in Clinical Trials Market in Asia-Pacific for Metabolic Disorders, Historical Trends (Since 2022) and Forecasted Estimates (Till 2035)
- 27.4.5. AI in Clinical Trials Market in Asia-Pacific for Immunological Disorders, Historical Trends (Since 2022) and Forecasted Estimates (Till 2035)
- 27.4.6. AI in Clinical Trials Market in Asia-Pacific for Cardiovascular Disorders, Historical Trends (Since 2022) and Forecasted Estimates (Till 2035)
- 27.4.7. AI in Clinical Trials Market in Asia-Pacific for Other Disorders, Historical Trends (Since 2022) and Forecasted Estimates (Till 2035)
- 27.5. AI in Clinical Trials Market in Asia-Pacific: Distribution by Technology Exposure
- 27.5.1. AI in Clinical Trials Market in Asia-Pacific for Machine Learning, Historical Trends (Since 2022) and Forecasted Estimates (Till 2035)
- 27.5.2. AI in Clinical Trials Market in Asia-Pacific for Molecular Modeling and Simulation, Historical Trends (Since 2022) and Forecasted Estimates (Till 2035)
- 27.5.3. AI in Clinical Trials Market in Asia-Pacific for Deep Learning, Historical Trends (Since 2022) and Forecasted Estimates (Till 2035)
- 27.5.4. AI in Clinical Trials Market in Asia-Pacific for Omics Integration, Historical Trends (Since 2022) and Forecasted Estimates (Till 2035)
- 27.5.5. AI in Clinical Trials Market in Asia-Pacific for Generative Model, Historical Trends (Since 2022) and Forecasted Estimates (Till 2035)
- 27.5.6. AI in Clinical Trials Market in Asia-Pacific for Other Technologies, Historical Trends (Since 2022) and Forecasted Estimates (Till 2035)
- 27.6. AI in Clinical Trials Market in Asia-Pacific: Distribution by End-user
- 27.6.1. AI in Clinical Trials Market in Asia-Pacific for Biotechnology and Pharmaceutical Companies, Historical Trends (Since 2022) and Forecasted Estimates (Till 2035)
- 27.6.2. AI in Clinical Trials Market in Asia-Pacific for Academic Research Institutes and Other End-users, Historical Trends (Since 2022) and Forecasted Estimates (Till 2035)
28. MARKET OPPORTUNITY ANALYSIS: MIDDLE EAST AND NORTH AFRICA
- 28.1. AI in Clinical Trials Market in Middle East and North Africa: Distribution by Trial Phase
- 28.1.1. AI in Clinical Trials Market in Middle East and North Africa for Phase I, Historical Trends (Since 2022) and Forecasted Estimates (Till 2035)
- 28.1.2. AI in Clinical Trials Market in Middle East and North Africa for Phase II, Historical Trends (Since 2022) and Forecasted Estimates (Till 2035)
- 28.1.3. AI in Clinical Trials Market in Middle East and North Africa for Phase III, Historical Trends (Since 2022) and Forecasted Estimates (Till 2035)
- 28.2. AI in Clinical Trials Market in Middle East and North Africa: Distribution by Type of Offering
- 28.2.1. AI in Clinical Trials Market in Middle East and North Africa for Software, Historical Trends (Since 2022) and Forecasted Estimates (Till 2035)
- 28.2.2. AI in Clinical Trials Market in Middle East and North Africa for Services, Historical Trends (Since 2022) and Forecasted Estimates (Till 2035)
- 28.3. AI in Clinical Trials Market in Middle East and North Africa: Distribution by Deployment Mode
- 28.3.1. AI in Clinical Trials Market in Middle East and North Africa for Cloud-based Deployment, Historical Trends (Since 2022) and Forecasted Estimates (Till 2035)
- 28.3.2. AI in Clinical Trials Market in Middle East and North Africa for On-premises Deployment, Historical Trends (Since 2022) and Forecasted Estimates (Till 2035)
- 28.4. AI in Clinical Trials Market in Middle East and North Africa: Distribution by Therapeutic Area
- 28.4.1. AI in Clinical Trials Market in Middle East and North Africa for Oncological Disorders, Historical Trends (Since 2022) and Forecasted Estimates (Till 2035)
- 28.4.2. AI in Clinical Trials Market in Middle East and North Africa for Infectious Diseases, Historical Trends (Since 2022) and Forecasted Estimates (Till 2035)
- 28.4.3. AI in Clinical Trials Market in Middle East and North Africa for CNS Disorders, Historical Trends (Since 2022) and Forecasted Estimates (Till 2035)
- 28.4.4. AI in Clinical Trials Market in Middle East and North Africa for Metabolic Disorders, Historical Trends (Since 2022) and Forecasted Estimates (Till 2035)
- 28.4.5. AI in Clinical Trials Market in Middle East and North Africa for Immunological Disorders, Historical Trends (Since 2022) and Forecasted Estimates (Till 2035)
- 28.4.6. AI in Clinical Trials Market in Middle East and North Africa for Cardiovascular Disorders, Historical Trends (Since 2022) and Forecasted Estimates (Till 2035)
- 28.4.7. AI in Clinical Trials Market in Middle East and North Africa for Other Disorders, Historical Trends (Since 2022) and Forecasted Estimates (Till 2035)
- 28.5. AI in Clinical Trials Market in Middle East and North Africa: Distribution by Technology Exposure
- 28.5.1. AI in Clinical Trials Market in Middle East and North Africa for Machine Learning, Historical Trends (Since 2022) and Forecasted Estimates (Till 2035)
- 28.5.2. AI in Clinical Trials Market in Middle East and North Africa for Molecular Modeling and Simulation, Historical Trends (Since 2022) and Forecasted Estimates (Till 2035)
- 28.5.3. AI in Clinical Trials Market in Middle East and North Africa for Deep Learning, Historical Trends (Since 2022) and Forecasted Estimates (Till 2035)
- 28.5.4. AI in Clinical Trials Market in Middle East and North Africa for Omics Integration, Historical Trends (Since 2022) and Forecasted Estimates (Till 2035)
- 28.5.5. AI in Clinical Trials Market in Middle East and North Africa for Generative Model, Historical Trends (Since 2022) and Forecasted Estimates (Till 2035)
- 28.5.6. AI in Clinical Trials Market in Middle East and North Africa for Other Technologies, Historical Trends (Since 2022) and Forecasted Estimates (Till 2035)
- 28.6. AI in Clinical Trials Market in Middle East and North Africa: Distribution by End-user
- 28.6.1. AI in Clinical Trials Market in Middle East and North Africa for Biotechnology and Pharmaceutical Companies, Historical Trends (Since 2022) and Forecasted Estimates (Till 2035)
- 28.6.2. AI in Clinical Trials Market in Middle East and North Africa for Academic Research Institutes and Other End-users, Historical Trends (Since 2022) and Forecasted Estimates (Till 2035)
29. MARKET OPPORTUNITY ANALYSIS: LATIN AMERICA
- 29.1. AI in Clinical Trials Market in Latin America: Distribution by Trial Phase
- 29.1.1. AI in Clinical Trials Market in Latin America for Phase I, Historical Trends (Since 2022) and Forecasted Estimates (Till 2035)
- 29.1.2. AI in Clinical Trials Market in Latin America for Phase II, Historical Trends (Since 2022) and Forecasted Estimates (Till 2035)
- 29.1.3. AI in Clinical Trials Market in Latin America for Phase III, Historical Trends (Since 2022) and Forecasted Estimates (Till 2035)
- 29.2. AI in Clinical Trials Market in Latin America: Distribution by Type of Offering
- 29.2.1. AI in Clinical Trials Market in Latin America for Software, Historical Trends (Since 2022) and Forecasted Estimates (Till 2035)
- 29.2.2. AI in Clinical Trials Market in Latin America for Services, Historical Trends (Since 2022) and Forecasted Estimates (Till 2035)
- 29.3. AI in Clinical Trials Market in Latin America: Distribution by Deployment Mode
- 29.3.1. AI in Clinical Trials Market in Latin America for Cloud-based Deployment, Historical Trends (Since 2022) and Forecasted Estimates (Till 2035)
- 29.3.2. AI in Clinical Trials Market in Latin America for On-premises Deployment, Historical Trends (Since 2022) and Forecasted Estimates (Till 2035)
- 29.4. AI in Clinical Trials Market in Latin America: Distribution by Therapeutic Area
- 29.4.1. AI in Clinical Trials Market in Latin America for Oncological Disorders, Historical Trends (Since 2022) and Forecasted Estimates (Till 2035)
- 29.4.2. AI in Clinical Trials Market in Latin America for Infectious Diseases, Historical Trends (Since 2022) and Forecasted Estimates (Till 2035)
- 29.4.3. AI in Clinical Trials Market in Latin America for CNS Disorders, Historical Trends (Since 2022) and Forecasted Estimates (Till 2035)
- 29.4.4. AI in Clinical Trials Market in Latin America for Metabolic Disorders, Historical Trends (Since 2022) and Forecasted Estimates (Till 2035)
- 29.4.5. AI in Clinical Trials Market in Latin America for Immunological Disorders, Historical Trends (Since 2022) and Forecasted Estimates (Till 2035)
- 29.4.6. AI in Clinical Trials Market in Latin America for Cardiovascular Disorders, Historical Trends (Since 2022) and Forecasted Estimates (Till 2035)
- 29.4.7. AI in Clinical Trials Market in Latin America for Other Disorders, Historical Trends (Since 2022) and Forecasted Estimates (Till 2035)
- 29.5. AI in Clinical Trials Market in Latin America: Distribution by Technology Exposure
- 29.5.1. AI in Clinical Trials Market in Latin America for Machine Learning, Historical Trends (Since 2022) and Forecasted Estimates (Till 2035)
- 29.5.2. AI in Clinical Trials Market in Latin America for Molecular Modeling and Simulation, Historical Trends (Since 2022) and Forecasted Estimates (Till 2035)
- 29.5.3. AI in Clinical Trials Market in Latin America for Deep Learning, Historical Trends (Since 2022) and Forecasted Estimates (Till 2035)
- 29.5.4. AI in Clinical Trials Market in Latin America for Omics Integration, Historical Trends (Since 2022) and Forecasted Estimates (Till 2035)
- 29.5.5. AI in Clinical Trials Market in Latin America for Generative Model, Historical Trends (Since 2022) and Forecasted Estimates (Till 2035)
- 29.5.6. AI in Clinical Trials Market in Latin America for Other Technologies, Historical Trends (Since 2022) and Forecasted Estimates (Till 2035)
- 29.6. AI in Clinical Trials Market in Latin America: Distribution by End-user
- 29.6.1. AI in Clinical Trials Market in Latin America for Biotechnology and Pharmaceutical Companies, Historical Trends (Since 2022) and Forecasted Estimates (Till 2035)
- 29.6.2. AI in Clinical Trials Market in Latin America for Academic Research Institutes and Other End-users, Historical Trends (Since 2022) and Forecasted Estimates (Till 2035)
30. CONCLUDING REMARKS
31. EXECUTIVE INSIGHTS
32. APPENDIX I: TABULATED DATA
33. APPENDIX II: LIST OF COMPANIES AND ORGANIZATIONS
List of Tables
- Table 7.1 AI in Clinical Trials: Information on Year of Establishment, Company Size, and Location of Headquarters
- Table 7.2 AI in Clinical Trials: Information on Key Offering and Deployment Option
- Table 7.3 AI in Clinical Trials: Information on Type of AI Technology Used
- Table 7.4 AI in Clinical Trials: Information on End-user
- Table 7.5 AI in Clinical Trials: Information on Application Area
- Table 8.1 AI in Clinical Trials: List of Companies Profiled
- Table 8.2 Clarivate: Company Overview
- Table 8.3 Clarivate: Offerings Portfolio
- Table 8.4 Clarivate: Recent Developments and Future Outlook
- Table 8.5 ConcertAI: Company Overview
- Table 8.6 ConcertAI: Offerings Portfolio
- Table 8.7 ConcertAI: Recent Developments and Future Outlook
- Table 8.8 IQVIA: Company Overview
- Table 8.9 IQVIA: Offerings Portfolio
- Table 8.10 IQVIA: Recent Developments and Future Outlook
- Table 8.11 LabCorp: Company Overview
- Table 8.12 LabCorp: Offerings Portfolio
- Table 8.13 LabCorp: Recent Developments and Future Outlook
- Table 8.14 Medidata: Company Overview
- Table 8.15 Medidata: Offerings Portfolio
- Table 8.16 Medidata: Recent Developments and Future Outlook
- Table 8.17 Microsoft: Company Overview
- Table 8.18 Microsoft: Offerings Portfolio
- Table 8.19 Microsoft: Recent Developments and Future Outlook
- Table 8.20 PathAI: Company Overview
- Table 8.21 PathAI: Offerings Portfolio
- Table 8.22 PathAI: Recent Developments and Future Outlook
- Table 8.23 ServiceNow: Company Overview
- Table 8.24 ServiceNow: Offerings Portfolio
- Table 8.25 ServiceNow: Recent Developments and Future Outlook
- Table 8.26 Signant Health: Company Overview
- Table 8.27 Signant Health: Offerings Portfolio
- Table 8.28 Signant Health: Recent Developments and Future Outlook
- Table 8.29 TransPerfect Life Sciences: Company Overview
- Table 8.30 TransPerfect Life Sciences: Offerings Portfolio
- Table 8.31 TransPerfect Life Sciences: Recent Developments and Future Outlook
- Table 10.1 AI in Clinical Trials: List of Partnerships and Collaborations, Since 2025
- Table 11.1 AI in Clinical Trials: List of Funding and Investments, Since 2025
- Table 16.1 Growth Drivers: Market Impact and Time Period
- Table 16.2 Growth Restraints: Market Impact and Time Period
- Table 16.3 Growth Opportunities: Market Impact and Time Period
- Table 16.4 Growth Challenges: Market Impact and Time Period
- Table 26.1 Ancora.ai: Company Snapshot
- Table 26.2 Deep 6 AI: Company Snapshot
- Table 26.3 Intelligencia: Company Snapshot
- Table 26.4 nQ Medical: Company Snapshot
- Table 26.5 Science 37: Company Snapshot
- Table 27.1 AI in Clinical Trials: Distribution by Year of Establishment
- Table 27.2 AI in Clinical Trials: Distribution by Company Size
- Table 27.3 AI in Clinical Trials: Distribution by Location of Headquarters
- Table 27.4 AI in Clinical Trials: Distribution by Company Size and Location of Headquarters (Region)
- Table 27.5 AI in Clinical Trials: Distribution by Key Offering
- Table 27.6 AI in Clinical Trials: Distribution by Deployment Option
- Table 27.7 AI in Clinical Trials: Distribution by Type of AI Technology Used
- Table 27.8 AI in Clinical Trials: Distribution by End-user
- Table 27.9 AI in Clinical Trials: Distribution by Application Areas
- Table 27.10 Clarivate: Annual Revenues, Since 2022
- Table 27.11 IQVIA: Annual Revenues, Since 2022
- Table 27.12 LabCorp: Annual Revenues, Since 2022
- Table 27.13 Dassault Systemes (Parent Company of Medidata): Annual Revenues, Since 2022
- Table 27.14 Microsoft: Annual Revenues, Since 2022
- Table 27.15 ServiceNow: Annual Revenues, Since 2022
- Table 27.16 TransPerfect Life Sciences: Annual Revenues, Since 2022
- Table 27.17 Clinical Trial Analysis: Distribution by Trial Registration Year, Since 2018
- Table 27.18 Clinical Trial Analysis: Distribution of Patients Enrolled by Trial Registration Year, Since 2018
- Table 27.19 Clinical Trial Analysis: Distribution by Trial Phase
- Table 27.20 Clinical Trial Analysis: Distribution by Trial Status
- Table 27.21 Clinical Trial Analysis: Distribution by Trial Registration Year and Status, Since 2018
- Table 27.22 Clinical Trial Analysis: Distribution by Type of Sponsor / Collaborator
- Table 27.23 Clinical Trial Analysis: Distribution by Patient Gender
- Table 27.24 Clinical Trial Analysis: Distribution by Patient Age
- Table 27.25 Clinical Trial Analysis: Distribution by Target Therapeutic Area
- Table 27.26 Clinical Trial Analysis: Distribution by Type of Patient Allocation Model Used
- Table 27.27 Clinical Trial Analysis: Distribution by Type of Trial Masking Adopted
- Table 27.28 Clinical Trial Analysis: Distribution by Type of Intervention
- Table 27.29 Clinical Trial Analysis: Distribution by Trial Purpose
- Table 27.30 Most Active Players: Distribution by Number of Registered Trials
- Table 27.31 Partnerships and Collaborations: Distribution by Monthly Trend of Partnership, Since 2025
- Table 27.32 Partnerships and Collaborations: Distribution by Type of Partnership
- Table 27.33 Partnerships and Collaborations: Distribution by Type of Partner
- Table 27.34 Most Active Players: Distribution by Number of Partnerships
- Table 27.35 Partnerships and Collaborations: Local and International Agreements
- Table 27.36 Partnerships and Collaborations: Intercontinental and Intracontinental Agreements
- Table 27.37 Funding and Investment Analysis: Monthly Trend of Funding Instances, Since 2025
- Table 27.38 Funding and Investment Analysis: Monthly Trend of Amount Invested, Since 2025 (USD Million)
- Table 27.39 Funding and Investment Analysis: Distribution of Instances by Type of Funding
- Table 27.40 Funding and Investment Analysis: Distribution of Amount Invested by Type of Funding (USD Million)
- Table 27.41 Funding and Investment Analysis: Distribution by Geography (Country)
- Table 27.42 Most Active Players: Distribution by Number of Funding Instances
- Table 27.43 Leading Investors: Distribution by Number of Funding Instances
- Table 27.44 Big Pharma Initiatives: Distribution by Year of Initiative, Since 2019
- Table 27.45 Big Pharma Initiatives: Distribution by Type of Initiative
- Table 27.46 Big Pharma Initiatives: Distribution by Application Area of AI
- Table 27.47 Big Pharma Initiatives: Distribution by Target Therapeutic Area
- Table 27.48 Value Creation Framework: Trends in Research Activity
- Table 27.49 Value Creation Framework: Trends in Intellectual Property
- Table 27.50 Overall Cost Saving Potential of AI in Clinical Trials, Till 2035 (USD Billion)
- Table 27.51 Cost Saving Potential: Distribution by Trial Phase, 2026 and 2035 (USD Billion)
- Table 27.52 Cost Saving Potential in Phase I Clinical Trials, Till 2035 (USD Billion)
- Table 27.53 Cost Saving Potential in Phase II Clinical Trials, Till 2035 (USD Billion)
- Table 27.54 Cost Saving Potential in Phase III Clinical Trials, Till 2035 (USD Billion)
- Table 27.55 Cost Saving Potential: Distribution by Trial Procedure, 2026 and 2035 (USD Billion)
- Table 27.56 Cost Saving Potential in Patient Recruitment, Till 2035 (USD Billion)
- Table 27.57 Cost Saving Potential in Staffing and Administration, Till 2035 (USD Billion)
- Table 27.58 Cost Saving Potential in Site Monitoring, Till 2035 (USD Billion)
- Table 27.59 Cost Saving Potential in Source Data Verification, Till 2035 (USD Billion)
- Table 27.60 Cost Saving Potential in Patient Retention, Till 2035 (USD Billion)
- Table 27.61 Cost Saving Potential in Other Procedures, Till 2035 (USD Billion)
- Table 27.62 Global AI in Clinical Trials Market, Historical Trends (Since 2022) and Forecasted Estimates (Till 2035): Base Scenario (USD Billion)
- Table 27.63 Global AI in Clinical Trials Market, Forecasted Estimates (Till 2035): Conservative Scenario (USD Billion)
- Table 27.64 Global AI in Clinical Trials Market, Forecasted Estimates (Till 2035): Optimistic Scenario (USD Billion)
- Table 27.65 AI in Clinical Trials Market: Distribution by Trial Phase
- Table 27.66 AI in Clinical Trials Market for Phase I: Historical Trends (Since 2022) and Forecasted Estimates (Till 2035), Conservative, Base and Optimistic Scenarios (USD Million)
- Table 27.67 AI in Clinical Trials Market for Phase II: Historical Trends (Since 2022) and Forecasted Estimates (Till 2035), Conservative, Base and Optimistic Scenarios (USD Million)
- Table 27.68 AI in Clinical Trials Market for Phase III: Historical Trends (Since 2022) and Forecasted Estimates (Till 2035), Conservative, Base and Optimistic Scenarios (USD Million)
- Table 27.69 AI in Clinical Trials Market: Distribution by Type of Offering
- Table 27.70 AI in Clinical Trials Market for Software: Historical Trends (Since 2022) and Forecasted Estimates (Till 2035), Conservative, Base and Optimistic Scenarios (USD Million)
- Table 27.71 AI in Clinical Trials Market for Services: Historical Trends (Since 2022) and Forecasted Estimates (Till 2035), Conservative, Base and Optimistic Scenarios (USD Million)
- Table 27.72 AI in Clinical Trials Market: Distribution by Deployment Mode
- Table 27.73 AI in Clinical Trials Market for Cloud-based Deployment: Historical Trends (Since 2022) and Forecasted Estimates (Till 2035), Conservative, Base and Optimistic Scenarios (USD Million)
- Table 27.74 AI in Clinical Trials Market for On-premises Deployment: Historical Trends (Since 2022) and Forecasted Estimates (Till 2035), Conservative, Base and Optimistic Scenarios (USD Million)
- Table 27.75 AI in Clinical Trials Market: Distribution by Therapeutic Area
- Table 27.76 AI in Clinical Trials Market for Oncological Disorders: Historical Trends (Since 2022) and Forecasted Estimates (Till 2035), Conservative, Base and Optimistic Scenarios (USD Million)
- Table 27.77 AI in Clinical Trials Market for Infectious Diseases: Historical Trends (Since 2022) and Forecasted Estimates (Till 2035), Conservative, Base and Optimistic Scenarios (USD Million)
- Table 27.78 AI in Clinical Trials Market for CNS Disorders: Historical Trends (Since 2022) and Forecasted Estimates (Till 2035), Conservative, Base and Optimistic Scenarios (USD Million)
- Table 27.79 AI in Clinical Trials Market for Metabolic Disorders: Historical Trends (Since 2022) and Forecasted Estimates (Till 2035), Conservative, Base and Optimistic Scenarios (USD Million)
- Table 27.80 AI in Clinical Trials Market for Immunological Disorders: Historical Trends (Since 2022) and Forecasted Estimates (Till 2035), Conservative, Base and Optimistic Scenarios (USD Million)
- Table 27.81 AI in Clinical Trials Market for Cardiovascular Disorders: Historical Trends (Since 2022) and Forecasted Estimates (Till 2035), Conservative, Base and Optimistic Scenarios (USD Million)
- Table 27.82 AI in Clinical Trials Market for Other Disorders: Historical Trends (Since 2022) and Forecasted Estimates (Till 2035), Conservative, Base and Optimistic Scenarios (USD Million)
- Table 27.83 AI in Clinical Trials Market: Distribution by Technology Exposure
- Table 27.84 AI in Clinical Trials Market for Machine Learning: Historical Trends (Since 2022) and Forecasted Estimates (Till 2035), Conservative, Base and Optimistic Scenarios (USD Million)
- Table 27.85 AI in Clinical Trials Market for Molecular Modeling and Simulation: Historical Trends (Since 2022) and Forecasted Estimates (Till 2035), Conservative, Base and Optimistic Scenarios (USD Million)
- Table 27.86 AI in Clinical Trials Market for Deep Learning: Historical Trends (Since 2022) and Forecasted Estimates (Till 2035), Conservative, Base and Optimistic Scenarios (USD Million)
- Table 27.87 AI in Clinical Trials Market for Omics Integration: Historical Trends (Since 2022) and Forecasted Estimates (Till 2035), Conservative, Base and Optimistic Scenarios (USD Million)
- Table 27.88 AI in Clinical Trials Market for Generative Model: Historical Trends (Since 2022) and Forecasted Estimates (Till 2035), Conservative, Base and Optimistic Scenarios (USD Million)
- Table 27.89 AI in Clinical Trials Market for Other Technologies: Historical Trends (Since 2022) and Forecasted Estimates (Till 2035), Conservative, Base and Optimistic Scenarios (USD Million)
- Table 27.90 AI in Clinical Trials Market: Distribution by End-user
- Table 27.91 AI in Clinical Trials Market for Biotechnology and Pharmaceutical Companies: Historical Trends (Since 2022) and Forecasted Estimates (Till 2035), Conservative, Base and Optimistic Scenarios (USD Million)
- Table 27.92 AI in Clinical Trials Market for Academic Research Institute and Other End-users: Historical Trends (Since 2022) and Forecasted Estimates (Till 2035), Conservative, Base and Optimistic Scenarios (USD Million)
- Table 27.93 AI in Clinical Trials Market: Distribution by Geographical Regions
- Table 27.94 AI in Clinical Trials Market in North America: Historical Trends (Since 2022) and Forecasted Estimates (Till 2035), Conservative, Base and Optimistic Scenarios (USD Million)
- Table 27.95 AI in Clinical Trials Market in the US: Historical Trends (Since 2022) and Forecasted Estimates (Till 2035), Conservative, Base and Optimistic Scenarios (USD Million)
- Table 27.96 AI in Clinical Trials Market in Canada: Historical Trends (Since 2022) and Forecasted Estimates (Till 2035), Conservative, Base and Optimistic Scenarios (USD Million)
- Table 27.97 AI in Clinical Trials Market in Europe: Historical Trends (Since 2022) and Forecasted Estimates (Till 2035), Conservative, Base and Optimistic Scenarios (USD Million)
- Table 27.98 AI in Clinical Trials Market in the UK: Historical Trends (Since 2022) and Forecasted Estimates (Till 2035), Conservative, Base and Optimistic Scenarios (USD Million)
- Table 27.99 AI in Clinical Trials Market in Germany: Historical Trends (Since 2022) and Forecasted Estimates (Till 2035), Conservative, Base and Optimistic Scenarios (USD Million)
- Table 27.100 AI in Clinical Trials Market in France: Historical Trends (Since 2022) and Forecasted Estimates (Till 2035), Conservative, Base and Optimistic Scenarios (USD Million)
- Table 27.101 AI in Clinical Trials Market in Spain: Historical Trends (Since 2022) and Forecasted Estimates (Till 2035), Conservative, Base and Optimistic Scenarios (USD Million)
- Table 27.102 AI in Clinical Trials Market in Italy: Historical Trends (Since 2022) and Forecasted Estimates (Till 2035), Conservative, Base and Optimistic Scenarios (USD Million)
- Table 27.103 AI in Clinical Trials Market in Rest of Europe: Historical Trends (Since 2022) and Forecasted Estimates (Till 2035), Conservative, Base and Optimistic Scenarios (USD Million)
- Table 27.104 AI in Clinical Trials Market in Asia-Pacific: Historical Trends (Since 2022) and Forecasted Estimates (Till 2035), Conservative, Base and Optimistic Scenarios (USD Million)
- Table 27.105 AI in Clinical Trials Market in China: Historical Trends (Since 2022) and Forecasted Estimates (Till 2035), Conservative, Base and Optimistic Scenarios (USD Million)
- Table 27.106 AI in Clinical Trials Market in Japan: Historical Trends (Since 2022) and Forecasted Estimates (Till 2035), Conservative, Base and Optimistic Scenarios (USD Million)
- Table 27.107 AI in Clinical Trials Market in South Korea: Historical Trends (Since 2022) and Forecasted Estimates (Till 2035), Conservative, Base and Optimistic Scenarios (USD Million)
- Table 27.108 AI in Clinical Trials Market in Australia: Historical Trends (Since 2022) and Forecasted Estimates (Till 2035), Conservative, Base and Optimistic Scenarios (USD Million)
- Table 27.109 AI in Clinical Trials Market in India: Historical Trends (Since 2022) and Forecasted Estimates (Till 2035), Conservative, Base and Optimistic Scenarios (USD Million)
- Table 27.110 AI in Clinical Trials Market in Middle East and North Africa: Historical Trends (Since 2022) and Forecasted Estimates (Till 2035), Conservative, Base and Optimistic Scenarios (USD Million)
- Table 27.111 AI in Clinical Trials Market in Saudi Arabia: Historical Trends (Since 2022) and Forecasted Estimates (Till 2035), Conservative, Base and Optimistic Scenarios (USD Million)
- Table 27.112 AI in Clinical Trials Market in UAE: Historical Trends (Since 2022) and Forecasted Estimates (Till 2035), Conservative, Base and Optimistic Scenarios (USD Million)
- Table 27.113 AI in Clinical Trials Market in Egypt: Historical Trends (Since 2022) and Forecasted Estimates (Till 2035), Conservative, Base and Optimistic Scenarios (USD Million)
- Table 27.114 AI in Clinical Trials Market in Latin America: Historical Trends (Since 2022) and Forecasted Estimates (Till 2035), Conservative, Base and Optimistic Scenarios (USD Million)
- Table 27.115 AI in Clinical Trials Market in Brazil: Historical Trends (Since 2022) and Forecasted Estimates (Till 2035), Conservative, Base and Optimistic Scenarios (USD Million)
- Table 27.116 AI in Clinical Trials Market in Mexico: Historical Trends (Since 2022) and Forecasted Estimates (Till 2035), Conservative, Base and Optimistic Scenarios (USD Million)
- Table 27.117 AI in Clinical Trials Market in Argentina: Historical Trends (Since 2022) and Forecasted Estimates (Till 2035), Conservative, Base and Optimistic Scenarios (USD Million)
List of Figures
- Figure 2.1 Research Methodology: Project Methodology
- Figure 2.2 Research Methodology: Data Sources for Secondary Research
- Figure 2.3 Research Methodology: Robust Quality Control
- Figure 3.1 Market Dynamics: Forecast Methodology
- Figure 3.2 Market Dynamics: Market Assessment Framework
- Figure 4.1 Lessons Learnt from Past Recessions
- Figure 5.1 Executive Summary: Market Landscape
- Figure 5.2 Executive Summary: Recent Trends
- Figure 5.3 Executive Summary: Market Sizing and Opportunity Analysis
- Figure 6.1 Types of Algorithms of Machine Learning
- Figure 6.2 Applications of AI in Healthcare
- Figure 6.3 Examples of AI Platforms / Software Developed by Health-Tech Firms
- Figure 6.4 Areas of AI Integration in Clinical Trials
- Figure 6.5 Challenges Associated with the Adoption of AI
- Figure 7.1 AI in Clinical Trials: Distribution by Year of Establishment
- Figure 7.2 AI in Clinical Trials: Distribution by Company Size
- Figure 7.3 AI in Clinical Trials: Distribution by Location of Headquarters
- Figure 7.4 AI in Clinical Trials: Distribution by Company Size and Location of Headquarters (Region)
- Figure 7.5 AI in Clinical Trials: Distribution by Key Offering
- Figure 7.6 AI in Clinical Trials: Distribution by Deployment Option
- Figure 7.7 AI in Clinical Trials: Distribution by Type of AI Technology Used
- Figure 7.8 AI in Clinical Trials: Distribution by End-user
- Figure 7.9 AI in Clinical Trials: Distribution by Application Area
- Figure 8.1 Clarivate: Annual Revenues, Since 2022
- Figure 8.2 IQVIA: Annual Revenues, Since 2022
- Figure 8.3 LabCorp: Annual Revenues, Since 2022
- Figure 8.4 Dassault Systemes (Parent Company of Medidata): Annual Revenues, Since 2022
- Figure 8.5 Microsoft: Annual Revenues, Since 2022
- Figure 8.6 ServiceNow: Annual Revenues, Since 2022
- Figure 8.7 TransPerfect Life Sciences: Annual Revenues, Since 2022
- Figure 9.1 Clinical Trial Analysis: Distribution by Trial Registration Year, Since 2018
- Figure 9.2 Clinical Trial Analysis: Distribution of Patients Enrolled by Trial Registration Year, Since 2018
- Figure 9.3 Clinical Trial Analysis: Distribution by Trial Phase
- Figure 9.4 Clinical Trial Analysis: Distribution by Trial Status
- Figure 9.5 Clinical Trial Analysis: Distribution by Trial Registration Year and Status, Since 2018
- Figure 9.6 Clinical Trial Analysis: Distribution by Type of Sponsor / Collaborator
- Figure 9.7 Clinical Trial Analysis: Distribution by Patient Gender
- Figure 9.8 Clinical Trial Analysis: Distribution by Patient Age
- Figure 9.9 Word Cloud Analysis: Emerging Focus Areas
- Figure 9.10 Clinical Trial Analysis: Distribution by Target Therapeutic Area
- Figure 9.11 Clinical Trial Analysis: Distribution by Type of Patient Allocation Model Used
- Figure 9.12 Clinical Trial Analysis: Distribution by Type of Trial Masking Adopted
- Figure 9.13 Clinical Trial Analysis: Distribution by Type of Intervention
- Figure 9.14 Clinical Trial Analysis: Distribution by Trial Purpose
- Figure 9.15 Most Active Players: Distribution by Number of Registered Trials
- Figure 9.16 Clinical Trial Analysis: Distribution of Clinical Trials by Geography
- Figure 9.17 Clinical Trial Analysis: Distribution of Clinical Trials by Geography and Trial Status
- Figure 9.18 Clinical Trial Analysis: Distribution of Patients Enrolled by Geography and Trial Registration Year
- Figure 9.19 Clinical Trial Analysis: Distribution of Patients Enrolled by Geography and Trial Status
- Figure 10.1 Partnerships and Collaborations: Distribution by Monthly Trend of Partnership, Since 2025
- Figure 10.2 Partnerships and Collaborations: Distribution by Type of Partnership
- Figure 10.3 Partnerships and Collaborations: Distribution by Type of Partner
- Figure 10.4 Most Active Players: Distribution by Number of Partnerships
- Figure 10.5 Partnerships and Collaborations: Local and International Agreements
- Figure 10.6 Partnerships and Collaborations: Intracontinental and Intercontinental Agreements
- Figure 11.1 Funding and Investment Analysis: Monthly Trend of Funding Instances
- Figure 11.2 Funding and Investment Analysis: Monthly Trend of Amount Invested
- Figure 11.3 Funding and Investment Analysis: Distribution of Instances by Type of Funding
- Figure 11.4 Funding and Investment Analysis: Distribution of Amount Invested by Type of Funding (USD Million)
- Figure 11.5 Funding and Investment Analysis: Distribution by Geography (Region)
- Figure 11.6 Funding and Investment Analysis: Distribution by Geography (Country)
- Figure 11.7 Most Active Players: Distribution by Number of Funding Instances
- Figure 11.8 Leading Investors: Distribution by Number of Funding Instances
- Figure 12.1 Big Pharma Initiatives: Distribution by Year of Initiative
- Figure 12.2 Big Pharma Initiatives: Distribution by Type of Initiative
- Figure 12.3 Heat Map: Distribution by Type of Initiative
- Figure 12.4 Big Pharma Initiatives: Distribution by Application Area of AI
- Figure 12.5 Heat Map: Distribution by Application Area
- Figure 12.6 Big Pharma Initiatives: Distribution by Target Therapeutic Area
- Figure 12.7 Heat Map: Distribution by Target Therapeutic Area
- Figure 12.8 Benchmarking Analysis: Wind Rose Chart
- Figure 13.2 Value Creation Framework: Trends in Research Activity
- Figure 13.3 Value Creation Framework: Trends in Intellectual Property
- Figure 13.4 Value Creation Framework: Extent of Innovation versus Associated Risk Matrix
- Figure 13.5 Value Creation Framework: Harvey Ball Analysis of Key Tools and Technologies
- Figure 13.6 Value Creation Framework: Summary
- Figure 15.1 Overall Cost Saving Potential Associated with Use of AI in Clinical Trials, Till 2035 (USD Billion)
- Figure 15.2 Cost Saving Potential: Distribution by Trial Phase
- Figure 15.3 Cost Saving Potential in Phase I Clinical Trials, Till 2035 (USD Billion)
- Figure 15.5 Cost Saving Potential in Phase II Clinical Trials, Till 2035 (USD Billion)
- Figure 15.5 Cost Saving Potential in Phase III Clinical Trials, Till 2035 (USD Billion)
- Figure 15.6 Cost Saving Potential: Distribution by Trial Procedure
- Figure 15.7 Cost Saving Potential in Patient Recruitment, Till 2035 (USD Billion)
- Figure 15.8 Cost Saving Potential in Staffing and Administration, Till 2035 (USD Billion)
- Figure 15.9 Cost Saving Potential in Site Monitoring, Till 2035 (USD Billion)
- Figure 15.10 Cost Saving Potential in Source Data Verification, Till 2035 (USD Billion)
- Figure 15.11 Cost Saving Potential in Patient Retention, Till 2035 (USD Billion)
- Figure 15.12 Cost Saving Potential in Other Procedures, Till 2035 (USD Billion)
- Figure 17.1 Global AI in Clinical Trials Market: Historical Trends (Since 2022) and Forecasted Estimates (Till 2035) (USD Billion)
- Figure 17.2 Global AI in Clinical Trials Market: Forecasted Estimates (Till 2035), Conservative Scenario (USD Billion)
- Figure 17.3 Global AI in Clinical Trials Market: Forecasted Estimates (Till 2035), Optimistic Scenario (USD Billion)
- Figure 18.1 AI in Clinical Trials Market: Distribution by Trial Phase
- Figure 18.2 AI in Clinical Trials Market for Phase I: Historical Trends (Since 2022) and Forecasted Estimates (Till 2035) (USD Million)
- Figure 18.3 AI in Clinical Trials Market for Phase II: Historical Trends (Since 2022) and Forecasted Estimates (Till 2035) (USD Million)
- Figure 18.4 AI in Clinical Trials Market for Phase III: Historical Trends (Since 2022) and Forecasted Estimates (Till 2035) (USD Million)
- Figure 19.1 AI in Clinical Trials Market: Distribution by Type of Offering
- Figure 19.2 AI in Clinical Trials Market for Software: Historical Trends (Since 2022) and Forecasted Estimates (Till 2035) (USD Million)
- Figure 19.3 AI in Clinical Trials Market for Services: Historical Trends (Since 2022) and Forecasted Estimates (Till 2035) (USD Million)
- Figure 20.1 AI in Clinical Trials Market: Distribution by Deployment Mode
- Figure 20.2 AI in Clinical Trials Market for Cloud-based Deployment: Historical Trends (Since 2022) and Forecasted Estimates (Till 2035) (USD Million)
- Figure 20.3 AI in Clinical Trials Market for On-premises Deployment: Historical Trends (Since 2022) and Forecasted Estimates (Till 2035) (USD Million)
- Figure 21.1 AI in Clinical Trials Market: Distribution by Therapeutic Area
- Figure 21.2 AI in Clinical Trials Market for Oncological Disorders: Historical Trends (Since 2022) and Forecasted Estimates (Till 2035) (USD Million)
- Figure 21.3 AI in Clinical Trials Market for Infectious Diseases: Historical Trends (Since 2022) and Forecasted Estimates (Till 2035) (USD Million)
- Figure 21.4 AI in Clinical Trials Market for CNS Disorders: Historical Trends (Since 2022) and Forecasted Estimates (Till 2035) (USD Million)
- Figure 21.5 AI in Clinical Trials Market for Metabolic Disorders: Historical Trends (Since 2022) and Forecasted Estimates (Till 2035) (USD Million)
- Figure 21.6 AI in Clinical Trials Market for Immunological Disorders: Historical Trends (Since 2022) and Forecasted Estimates (Till 2035) (USD Million)
- Figure 21.7 AI in Clinical Trials Market for Cardiovascular Disorders: Historical Trends (Since 2022) and Forecasted Estimates (Till 2035) (USD Million)
- Figure 21.8 AI in Clinical Trials Market for Other Disorders: Historical Trends (Since 2022) and Forecasted Estimates (Till 2035) (USD Million)
- Figure 22.1 AI in Clinical Trials Market: Distribution by Technology Exposure
- Figure 22.2 AI in Clinical Trials Market for Machine Learning: Historical Trends (Since 2022) and Forecasted Estimates (Till 2035) (USD Million)
- Figure 22.3 AI in Clinical Trials Market for Molecular Modeling and Simulation: Historical Trends (Since 2022) and Forecasted Estimates (Till 2035) (USD Million)
- Figure 22.4 AI in Clinical Trials Market for Deep Learning: Historical Trends (Since 2022) and Forecasted Estimates (Till 2035) (USD Million)
- Figure 22.5 AI in Clinical Trials Market for Omics Integration: Historical Trends (Since 2022) and Forecasted Estimates (Till 2035) (USD Million)
- Figure 22.6 AI in Clinical Trials Market for Generative Model: Historical Trends (Since 2022) and Forecasted Estimates (Till 2035) (USD Million)
- Figure 22.7 AI in Clinical Trials Market for Other Technologies: Historical Trends (Since 2022) and Forecasted Estimates (Till 2035) (USD Million)
- Figure 23.1 AI in Clinical Trials Market: Distribution by End-user
- Figure 23.2 AI in Clinical Trials Market for Biotechnology and Pharmaceutical Companies: Historical Trends (Since 2022) and Forecasted Estimates (Till 2035) (USD Million)
- Figure 23.3 AI in Clinical Trials Market for Academic Research Institutes and Other End-users: Historical Trends (Since 2022) and Forecasted Estimates (Till 2035) (USD Million)
- Figure 24.1 AI in Clinical Trials Market: Distribution by Geographical Regions
- Figure 24.2 AI in Clinical Trials Market in North America: Historical Trends (Since 2022) and Forecasted Estimates (Till 2035) (USD Million)
- Figure 24.3 AI in Clinical Trials Market in the US: Historical Trends (Since 2022) and Forecasted Estimates (Till 2035) (USD Million)
- Figure 24.4 AI in Clinical Trials Market in Canada: Historical Trends (Since 2022) and Forecasted Estimates (Till 2035) (USD Million)
- Figure 24.5 AI in Clinical Trials Market in Europe: Historical Trends (Since 2022) and Forecasted Estimates (Till 2035) (USD Million)
- Figure 24.6 AI in Clinical Trials Market in the UK: Historical Trends (Since 2022) and Forecasted Estimates (Till 2035) (USD Million)
- Figure 24.7 AI in Clinical Trials Market in Germany: Historical Trends (Since 2022) and Forecasted Estimates (Till 2035) (USD Million)
- Figure 24.8 AI in Clinical Trials Market in France: Historical Trends (Since 2022) and Forecasted Estimates (Till 2035) (USD Million)
- Figure 24.9 AI in Clinical Trials Market in Spain: Historical Trends (Since 2022) and Forecasted Estimates (Till 2035) (USD Million)
- Figure 24.10 AI in Clinical Trials Market in Italy: Historical Trends (Since 2022) and Forecasted Estimates (Till 2035) (USD Million)
- Figure 24.11 AI in Clinical Trials Market in Rest of Europe: Historical Trends (Since 2022) and Forecasted Estimates (Till 2035) (USD Million)
- Figure 24.12 AI in Clinical Trials Market in Asia-Pacific: Historical Trends (Since 2022) and Forecasted Estimates (Till 2035) (USD Million)
- Figure 24.13 AI in Clinical Trials Market in China: Historical Trends (Since 2022) and Forecasted Estimates (Till 2035) (USD Million)
- Figure 24.14 AI in Clinical Trials Market in Japan: Historical Trends (Since 2022) and Forecasted Estimates (Till 2035) (USD Million)
- Figure 24.15 AI in Clinical Trials Market in South Korea: Historical Trends (Since 2022) and Forecasted Estimates (Till 2035) (USD Million)
- Figure 24.16 AI in Clinical Trials Market in Australia: Historical Trends (Since 2022) and Forecasted Estimates (Till 2035) (USD Million)
- Figure 24.17 AI in Clinical Trials Market in India: Historical Trends (Since 2022) and Forecasted Estimates (Till 2035) (USD Million)
- Figure 24.18 AI in Clinical Trials Market in Middle East and North Africa: Historical Trends (Since 2022) and Forecasted Estimates (Till 2035) (USD Million)
- Figure 24.19 AI in Clinical Trials Market in Saudi Arabia: Historical Trends (Since 2022) and Forecasted Estimates (Till 2035) (USD Million)
- Figure 24.20 AI in Clinical Trials Market in UAE: Historical Trends (Since 2022) and Forecasted Estimates (Till 2035) (USD Million)
- Figure 24.21 AI in Clinical Trials Market in Egypt: Historical Trends (Since 2022) and Forecasted Estimates (Till 2035) (USD Million
- Figure 24.22 AI in Clinical Trials Market in Latin America: Historical Trends (Since 2022) and Forecasted Estimates (Till 2035) (USD Million)
- Figure 24.23 AI in Clinical Trials Market in Brazil: Historical Trends (Since 2022) and Forecasted Estimates (Till 2035) (USD Million)
- Figure 24.24 AI in Clinical Trials Market in Mexico: Historical Trends (Since 2022) and Forecasted Estimates (Till 2035) (USD Million)
- Figure 24.25 AI in Clinical Trials Market in Argentina: Historical Trends (Since 2022) and Forecasted Estimates (Till 2035) (USD Million)
- Figure 24.26 Market Movement Analysis: Geographical Regions
- Figure 24.27 Penetration-Growth (P-G) Matrix: Geographical Regions
- Figure 25.1 Concluding Remarks: Overall Market Landscape of AI Software and Service Providers
- Figure 25.2 Concluding Remarks: Partnerships and Collaborations
- Figure 25.3 Concluding Remarks: Funding and Investment Analysis
- Figure 25.4 Concluding Remarks: Market Sizing and Opportunity Analysis (I / II)
- Figure 25.5 Concluding Remarks: Market Sizing and Opportunity Analysis (II / II)

