PUBLISHER: Roots Analysis | PRODUCT CODE: 2161680

PUBLISHER: Roots Analysis | PRODUCT CODE: 2161680
Exoskeleton Market - Trends and Forecast Till 2035
EXOSKELETON MARKET: OVERVIEW
As per Roots Analysis, the global exoskeleton market is valued at USD 3.7 billion in the current year and is projected to reach USD 20.3 billion by 2035, representing a CAGR of 20.8% during the forecast period. The exoskeleton market size is being propelled by the convergence of two previously distinct demand streams namely clinical rehabilitation for neuromotor impairment and occupational ergonomics for industrial workforces, both of which are increasingly served by the same underlying wearable robotics platforms.
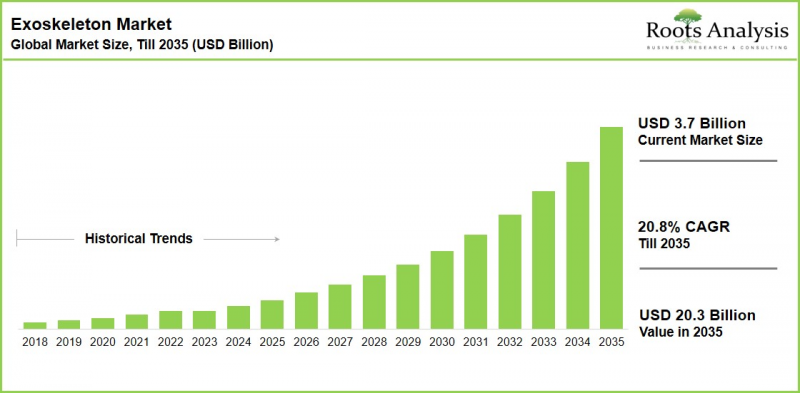
Exoskeleton Market: Growth and Trends
Mobility impairment has become one of the defining clinical and economic burdens of modern healthcare systems. Neurological conditions are now among the leading causes of disability worldwide, and the World Health Organization reported in 2025 that such conditions affect more than 40% of the global population, equivalent to over 3 billion people, and contribute to more than 11 million deaths annually. As this burden grows, health systems are looking beyond passive mobility aids such as wheelchairs, walkers, and crutches, toward technologies that can support active functional recovery.
In order to address this concern, exoskeletons have emerged as a next-generation solution. These wearable robotic systems integrate sensors, motors, actuators, control software, and power units to assist standing, walking, balance, and limb movement in individuals affected by stroke, spinal cord injury, multiple sclerosis, acquired brain injury, and other neuromotor conditions. Recently, Ekso Bionics reports that its exoskeleton technology is deployed across more than 500 rehabilitation centers globally. Further, its EksoNR platform holds FDA clearance for brain injury and multiple sclerosis, in addition to being the first exoskeleton cleared for both stroke and spinal cord injury rehabilitation.
A pivotal development reshaping market access has been the build-out of a Medicare reimbursement pathway for personal exoskeletons in the United States. For instance, Lifeward disclosed that Aetna, Humana, and UnitedHealthcare had extended Medicare Advantage coverage to the ReWalk Personal Exoskeleton, opening potential access to roughly 16 million covered individuals. The company also noted that Q4 FY2025 revenue from ReWalk Personal Exoskeleton sales rose 20% year-on-year, driven largely by higher volumes of reimbursed units. Expanding payer coverage of this kind lowers reimbursement uncertainty, improves affordability for eligible patients with spinal cord injury, and accelerates the shift of exoskeleton adoption from institutional rehabilitation settings toward home and community use.
Growth Drivers: Strategic Enablers of Exoskeleton Market Expansion
Growth in the exoskeleton market is being driven by a fundamental shift from passive mobility support toward active, technology-enabled functional recovery. Conventional aids such as wheelchairs, walkers, and crutches compensate for lost mobility but do not retrain movement patterns. Exoskeletons, in contrast, actively assist standing, walking, balance, and repetitive limb movement, positioning them as an attractive investment for hospitals and rehabilitation centers seeking to raise therapy intensity, support neuroplasticity, and increase patient engagement in recovery programs.
Further, technological advancement across sensors, artificial intelligence, control systems, and lightweight materials is supporting market growth. Continued improvement in motion sensors, AI-enabled control software, battery systems, actuators, and ergonomic design is making exoskeleton systems more responsive, safer, and easier to deploy across clinical, homecare, and industrial environments alike. Emerging research into data-driven, adaptive assistance for post-stroke gait training is a further sign of the market's direction, with wearable systems increasingly able to adjust support levels in real time based on patient-specific movement data.
Market Challenges: Critical Barriers to Exoskeleton Market Growth
Despite strong momentum, the exoskeleton market continues to face structural barriers that could temper the pace of adoption. Patient eligibility remains a central constraint: suitability for exoskeleton-assisted therapy can depend on height, weight, bone density, cardiovascular health, balance, upper-body strength, spasticity, cognition, skin condition, and level of injury. This narrows the addressable patient population and complicates manufacturers' efforts to scale adoption, since personal exoskeletons designed for spinal cord injury, for instance, may not suit every user with severe paralysis or complex comorbidities.
Reimbursement remains equally consequential. While the US has made measurable progress by classifying certain powered exoskeletons under the Medicare brace-benefit category, coverage still hinges on eligibility criteria, documentation requirements, prior authorization, payer-specific policy, and clinical justification. In many other geographies, reimbursement pathways remain undefined or limited, restricting broader adoption of medical exoskeletons beyond select rehabilitation centers and self-funded patients.
Exoskeleton Market: Key Insights
The report delves into the current state of the exoskeleton market and identifies potential growth opportunities within the industry. Some of the key findings include:
- Healthcare Drives Commercial Adoption: More than 500 Ekso Bionics exoskeletons are currently deployed across 30+ countries, highlighting the growing clinical footprint of rehabilitation exoskeletons.
- Powered Exoskeletons Lead Market Adoption: Powered systems remain the leading technology category as active motor-assisted movement expands across rehabilitation and industrial applications.
- Industrial Deployment Is Scaling: Airbus is testing 118 exoskeletons across France, Spain and Canada for shoulder, neck, lumbar and knee applications, demonstrating growing adoption beyond healthcare.
- Measured Ergonomic Benefits Support Industrial Demand: Airbus trials recorded a 10% to 40% reduction in shoulder and upper-back muscular strain among paint-shop operators using exoskeletons.
- Reimbursement is Expanding the Addressable Market: Coverage for the ReWalk Personal Exoskeleton across Aetna, UnitedHealthcare and Humana potentially extends access to approximately 16 million US beneficiaries.
- Regulatory Activity is Supporting Commercialization: Recent FDA clearances for powered exoskeleton systems are expanding the range of clinically available products, particularly for spinal cord injury and neurological rehabilitation.
- Mobile Systems Gain Traction: Demand is shifting toward wearable systems that support mobility outside controlled rehabilitation environments, including home and community use.
- Asia-Pacific Offers a High-Growth Opportunity: Rising healthcare investment, ageing populations and robotics development are supporting faster adoption of exoskeleton technologies across Asia-Pacific.
Exoskeleton Market Segments
The market sizing and opportunity analysis has been segmented across the following parameters:
By Body Part Covered
- Upper Body
- Lower Body
- Full Body
By Mode of Operation
- Powered
- Passive
- Hybrid
By Form of Exoskeleton
- Rigid
- Soft
By Mobility
- Fixed / Supported
- Mobile
By End User
- Patients
- Healthcare Professionals
- Industry Workers
- Military Personnel
- Others
By Key Geographical Regions
- North America
- Europe
- Asia-Pacific
- Rest of the World
Exoskeleton Market: Key Segment Insights
Lower Body Exoskeletons Emerge as a Key Market Growth Segment
Based on our market assessment, the lower body segment currently holds the largest share of the exoskeleton market. This dominance is due to its widespread adoption across rehabilitation, mobility assistance, and industrial use cases. The majority of commercially available exoskeleton systems are designed to restore or augment lower-limb function among individuals with spinal cord injury, stroke, multiple sclerosis, and related neurological or musculoskeletal disorders, underpinning a well-established base of clinical demand. Companies such as Ekso Bionics, ReWalk Robotics (Lifeward), and CYBERDYNE have each commercialized lower-limb exoskeleton platforms that are now widely used across rehabilitation and mobility-assistance settings.
The upper body segment is projected to expand at a higher CAGR during the forecast period. This growth is supported by rising deployment across manufacturing, logistics, construction, and healthcare settings aimed at reducing upper-limb fatigue and work-related musculoskeletal disorders. Growing employer awareness of occupational ergonomics, combined with advances in lightweight materials, wearable sensors, and AI-assisted motion control, is improving the comfort and usability of upper body exoskeleton systems and widening their addressable market.
Powered Exoskeletons Emerge as the Leading Operating Mode
Powered exoskeletons currently hold the largest share of the market. This largest share is driven by their superior functional capability relative to passive systems. Powered platforms use electric motors, actuators, or hydraulic mechanisms to assist movement. They are preferred for patients with severe mobility impairments, including spinal cord injury, stroke, and neuromuscular disorders. These platforms have also secured most regulatory clearances and reimbursement support to date. Industrial employers are separately increasing investment in powered systems to reduce worker fatigue and lift productivity in physically demanding roles.
The hybrid segment is expected to grow at a higher CAGR through the forecast period, as manufacturers including Ottobock and German Bionic develop architectures that deliver powered assistance only when needed, extending battery life while improving comfort. This trade-off makes hybrid exoskeletons particularly well suited to long-duration industrial shifts, military operations, and rehabilitation programs that do not require continuous powered support.
Rigid Exoskeletons Lead by Form and Soft System are Likely to Grow at a Higher CAGR
Rigid exoskeletons account for the largest share of the market by form. This dominance reflects their established role in medical rehabilitation and industrial load-bearing applications that demand high structural support and precise motion control. These systems deliver superior stability, weight-bearing capacity, and joint alignment, positioning them as the preferred choice for patients with spinal cord injury, stroke, and lower-limb paralysis. Most commercially approved powered exoskeletons available today are rigid in design, reinforcing their market penetration across hospitals, rehabilitation centers, and industrial worksites.
Meanwhile, soft exoskeletons are likely to grow at a higher CAGR during the forecast period. This lucrative growth is driven by demand for lightweight, flexible, and ergonomically designed wearable systems that enhance comfort without restricting natural movement. Players such as SUITX (now part of Ottobock) and HeroWear have advanced lightweight systems tailored to occupational ergonomics, while continued innovation in smart textiles and soft robotics is expected to widen clinical applications for soft exoskeleton platforms.
Mobile Exoskeletons Drive Demand Across Mobility Applications
Mobile exoskeletons account for the majority of current market share. This dominance is driven by their broad applicability across rehabilitation, industrial ergonomics, and defense use cases. Unlike fixed or supported systems confined to clinical or laboratory settings, mobile exoskeletons allow users to perform daily activities and rehabilitation exercises in real-world environments, considerably widening their commercial reach. Continued gains in portability, battery life, and AI-based gait assistance are expected to sustain this lead through the forecast period. This growth is largely because manufacturers including Wandercraft and German Bionic extend mobile, autonomous wearable systems into home rehabilitation, industrial operations, and military applications.
North America Retains Market Leadership and Asia-Pacific Emerges as the Fastest-Growing Region
North America currently holds the largest share of the market. This dominance is supported by a mature commercialization ecosystem, a comparatively favorable reimbursement landscape for medical exoskeletons, and sustained investment in wearable robotics across healthcare, industrial, and defense applications. The United States has been an early adopter of robotic rehabilitation technology, aided by expanding private-insurer and US Department of Veterans Affairs reimbursement for exoskeleton-assisted gait training among veterans with spinal cord injury. Multiple FDA clearances, together with the presence of leading manufacturers such as Ekso Bionics, ReWalk Robotics (Lifeward), Sarcos Technology and Robotics Corporation, and SuitX (now part of Ottobock), continue to reinforce the region's commercial lead.
The Asia-Pacific exoskeleton market is projected to grow at a higher CAGR during the forecast period. This accelerated growth is driven by rapid industrial automation, an aging population, rising incidence of neurological disorders, and expanding government support for robotics and rehabilitation technology. Japan's Robot Care Equipment Development and Introduction Project, backed by the Ministry of Economy, Trade and Industry (METI) and the New Energy and Industrial Technology Development Organization (NEDO), has accelerated commercialization of nursing-care and rehabilitation exoskeletons, while China's 14th Five-Year Plan for Robot Industry Development identifies rehabilitation and medical robotics as strategic growth priorities, encouraging domestic innovation and manufacturing capacity.
Example Players in the Exoskeleton Market
- Bionic Yantra
- CYBERDYNE
- Ekso Bionics
- ExoAtlet
- Fourier Intelligence
- Gloreha
- Guangzhou Yikang Medical Equipment
- Hexar Humancare
- Hocoma
- MediTouch
- Milebot Robotics
- Myomo
- Neofect
- NextStep Robotics
- ReWalk Robotics
- Rex Bionics
- Roam Robotics
- Trexo Robotics
- Tyromotion
- U&O Technologies
Expert and Industry Insights
The opinions and insights presented in this study were shaped by discussions conducted with multiple industry stakeholders. Emphasizing the shift towardsmaller, ergonomics-conscious industrial buyers, Gregory Galarneau, Founder of The Exoskeleton Store, noted that his organization currently serves over 250 customers, with smaller, family-run businesses of 50 employees or fewer emerging as a particularly promising segment given greater owner-level awareness of worker fatigue, simpler internal approval processes, and stronger willingness to invest in employee well-being.
The research report features detailed transcripts of interviews held with the following industry stakeholders:
- Co-Founder and Chief Executive Officer, Small Company, Spain
- Director of Business Planning and Development, Small Company, Japan
- Vice President of Sales and Marketing, Small Company, US
- Founder and Director, Small Company, US
- Marketing and Design Manager, Small Company, US
In addition, the report includes transcripts of the following third-party discussions:
- Founder and Chief Executive Officer, Small Company, US / China / Switzerland
- Founder, Small Company, US
- Co-Founder and Chief Scientific Officer, Small Company, US
- Division Head, Small Company, UK
- Scientific Chair, Technology and Innovation, Large Company, US
- Professor and Associate Professor, Large Company, US
- Wearable Robotics Researcher / Engineer, Mid-sized Company, US
EXOSKELETON MARKET: RESEARCH COVERAGE
- Market Sizing and Opportunity Analysis: An in-depth analysis of the exoskeleton market, focused on key market segments, including [A] body part covered, [B] mode of operation, [C] form of exoskeleton, [D] mobility, [E] end user, and [F] key geographical regions.
- Market Landscape: A detailed assessment of the overall exoskeleton device landscape, featuring information on parameters such as body part covered, mode of operation, form, mobility, actuation technology, and regulatory status, along with analysis of developers based on year of establishment, company size, and headquarters location.
- Company Profiles: In-depth profiles of prominent players engaged in the exoskeleton industry, featuring information on year of establishment, headquarters location, company size, management team, product portfolio, and key initiatives.
- Regulatory and Reimbursement Landscape: An analysis of regulatory clearances, reimbursement pathways, and payer coverage trends shaping exoskeleton adoption across key geographies.
- Partnerships and Collaborations Analysis: An assessment of strategic partnerships, collaborations, licensing agreements, technology alliances, and other commercial initiatives undertaken by key players in the exoskeletons market. This analysis helps stakeholders identify emerging business models, technology access opportunities, and potential partnership avenues.
- Funding and Investments Analysis: An evaluation of funding activities and investments across the exoskeletons ecosystem, including venture capital, private equity, grants, corporate investments, and other financing initiatives. The analysis provides insights into capital flows, investor interest, and areas attracting market investment.
- Patent Analysis: A comprehensive assessment of the exoskeletons patent landscape, covering patent applications and publications, jurisdictions, CPC classifications, applicant types, leading patent holders, patent characteristics, citations, and patent valuation. This analysis helps stakeholders assess technological innovation, intellectual property positioning, and competitive differentiation.
- Blue Ocean Strategy Analysis: An evaluation of emerging market opportunities and areas of limited competition within the exoskeletons market. The analysis uses strategy canvas, Pioneer-Migrator-Settler mapping, and Buyer Utility Map frameworks to identify potential avenues for differentiation, unmet customer needs, and new market opportunities.
- Market Impact Analysis: An assessment of the various drivers, restraints, opportunities, and challenges affecting exoskeleton market growth.
KEY QUESTIONS ANSWERED IN THIS REPORT
- Which companies are the leading players in the exoskeleton market?
- Which region dominates the exoskeleton market, and which is growing fastest?
- What are the key trends shaping the exoskeleton market?
- What factors are likely to influence the future evolution of this market?
- What are the primary challenges faced by exoskeleton manufacturers?
- What is the current and future size of the exoskeleton market?
- What is the CAGR of the exoskeleton market through 2035?
- How is market opportunity distributed across body part, mode of operation, form, mobility, and end user segments?
REASONS TO BUY THIS REPORT
- Provides a comprehensive market analysis with detailed revenue projections for the overall exoskeleton market and its specific sub-segments, valuable to both established market leaders and emerging entrants.
- Offers stakeholders a complete overview of the market, including key drivers, barriers, opportunities, and challenges, empowering data-driven decisions to capitalize on growth prospects.
- Helps businesses identify future opportunities across body part, technology, and end-user categories, and evaluate whether those opportunities are worth pursuing.
- Supports identification of customer demand by clarifying the needs, preferences, and behavior of the target audience, enabling more effective product and service tailoring.
- Equips new entrants with the information needed to build successful go-to-market and distribution strategies.
- Enables more effective communication with stakeholders and supports the development of strong business relationships across the exoskeleton value chain.
ADDITIONAL BENEFITS
- Complimentary Excel Data Packs for all analytical modules in the report
- 15% Free Content Customization
- Detailed Report Walkthrough Session with the Research Team
- Complimentary PowerPoint Presentation
- Free Updated Report if the report is 6-12 months old or older
TABLE OF CONTENTS
1. PREFACE
- 1.1. Scope of the Report
- 1.2. Research Methodology
- 1.3. Market Segmentations
- 1.4. Key Questions Answered
- 1.5. Chapter Outlines
2. RESEARCH METHODOLOGY
- 2.1. Chapter Overview
- 2.2. Research Assumptions
- 2.2.1. Market Landscape and Market Trends
- 2.2.2. Market Forecast and Opportunity Analysis
- 2.2.3. Comparative Analysis
- 2.3. Database Building
- 2.3.1. Data Collection
- 2.3.2. Data Validation
- 2.3.3. Data Analysis
- 2.4. Project Methodology
- 2.4.1. Secondary Research
- 2.4.1.1. Annual Reports
- 2.4.1.2. Academic Research Papers
- 2.4.1.3. Company Websites
- 2.4.1.4. Investor Presentations
- 2.4.1.5. Regulatory Filings
- 2.4.1.6. White Papers
- 2.4.1.7. Industry Publications
- 2.4.1.8. Conferences and Seminars
- 2.4.1.9. Government Portals
- 2.4.1.10. Media and Press Releases
- 2.4.1.11. Newsletters
- 2.4.1.12. Industry Databases
- 2.4.1.13. Roots Proprietary Databases
- 2.4.1.14. Paid Databases and Sources
- 2.4.1.15. Social Media Portals
- 2.4.1.16. Other Secondary Sources
- 2.4.2. Primary Research
- 2.4.2.1. Types of Primary Research
- 2.4.2.1.1. Qualitative Research
- 2.4.2.1.2. Quantitative Research
- 2.4.2.1.3. Hybrid Approach
- 2.4.2.2. Advantages of Primary Research
- 2.4.2.3. Techniques for Primary Research
- 2.4.2.3.1. Interviews
- 2.4.2.3.2. Surveys
- 2.4.2.3.3. Focus Groups
- 2.4.2.3.4. Observational Research
- 2.4.2.3.5. Social Media Interactions
- 2.4.2.4. Key Opinion Leaders Considered in Primary Research
- 2.4.2.4.1. Company Executives (CXOs)
- 2.4.2.4.2. Board of Directors
- 2.4.2.4.3. Company Presidents and Vice Presidents
- 2.4.2.4.4. Research and Development Heads
- 2.4.2.4.5. Technical Experts
- 2.4.2.4.6. Subject Matter Experts
- 2.4.2.4.7. Scientists
- 2.4.2.4.8. Doctors and Other Healthcare Providers
- 2.4.2.5. Ethics and Integrity
- 2.4.2.5.1. Research Ethics
- 2.4.2.5.2. Data Integrity
- 2.4.2.1. Types of Primary Research
- 2.4.3. Analytical Tools and Databases
- 2.4.1. Secondary Research
- 2.5. Robust Quality Control
3. MARKET DYNAMICS
- 3.1. Chapter Overview
- 3.2. Forecast Methodology
- 3.2.1. Top-down Approach
- 3.2.2. Bottom-up Approach
- 3.2.3. Hybrid Approach
- 3.3. Market Assessment Framework
- 3.3.1. Total Addressable Market (TAM)
- 3.3.2. Serviceable Addressable Market (SAM)
- 3.3.3. Serviceable Obtainable Market (SOM)
- 3.3.4. Currently Acquired Market (CAM)
- 3.4. Forecasting Tools and Techniques
- 3.4.1. Qualitative Forecasting
- 3.4.2. Correlation
- 3.4.3. Regression
- 3.4.4. Extrapolation
- 3.4.5. Convergence
- 3.4.6. Sensitivity Analysis
- 3.4.7. Scenario Planning
- 3.4.8. Data Visualization
- 3.4.9. Time Series Analysis
- 3.4.10. Forecast Error Analysis
- 3.5. Key Considerations
- 3.5.1. Demographics
- 3.5.2. Government Regulations
- 3.5.3. Reimbursement Scenarios
- 3.5.4. Market Access
- 3.5.5. Supply Chain
- 3.5.6. Industry Consolidation
- 3.5.7. Pandemic / Unforeseen Disruptions Impact
- 3.6. Limitations
4. MACRO-ECONOMIC INDICATORS
- 4.1. Chapter Overview
- 4.2. Market Dynamics
- 4.2.1. Time Period
- 4.2.1.1. Historical Trends
- 4.2.1.2. Current and Forecasted Estimates
- 4.2.2. Currency Coverage
- 4.2.2.1. Major Currencies Affecting the Market
- 4.2.2.2. Factors Affecting Currency Fluctuations
- 4.2.2.3. Impact of Currency Fluctuations on the Industry
- 4.2.3. Foreign Currency Exchange Rate
- 4.2.3.1. Impact of Foreign Exchange Rate Volatility on the Market
- 4.2.3.2. Strategies for Mitigating Foreign Exchange Risk
- 4.2.4. Recession
- 4.2.4.1. Assessment of Current Economic Conditions and Potential Impact on the Market
- 4.2.4.2. Historical Analysis of Past Recessions and Lessons Learnt
- 4.2.5. Inflation
- 4.2.5.1. Measurement and Analysis of Inflationary Pressures in the Economy
- 4.2.5.2. Potential Impact of Inflation on the Market Evolution
- 4.2.6. Interest Rates
- 4.2.6.1. Interest Rates and Their Impact on the Market
- 4.2.6.2. Strategies for Managing Interest Rate Risk
- 4.2.7. Commodity Flow Analysis
- 4.2.7.1. Type of Commodity
- 4.2.7.2. Origins and Destinations
- 4.2.7.3. Values and Weights
- 4.2.7.4. Modes of Transportation
- 4.2.8. Global Trade Dynamics
- 4.2.8.1. Import Scenario
- 4.2.8.2. Export Scenario
- 4.2.8.3. Trade Policies
- 4.2.8.4. Strategies for Mitigating the Risks Associated with Trade Barriers
- 4.2.8.5. Impact of Trade Barriers on the Market
- 4.2.9. War Impact Analysis
- 4.2.9.1. Russian-Ukraine War
- 4.2.9.2. Israel-Hamas War
- 4.2.10. COVID Impact / Related Factors
- 4.2.10.1. Global Economic Impact
- 4.2.10.2. Industry-specific Impact
- 4.2.10.3. Government Response and Stimulus Measures
- 4.2.10.4. Future Outlook and Adaptation Strategies
- 4.2.11. Other Indicators
- 4.2.11.1. Fiscal Policy
- 4.2.11.2. Consumer Spending
- 4.2.11.3. Gross Domestic Product (GDP)
- 4.2.11.4. Employment
- 4.2.11.5. Taxes
- 4.2.11.6. Stock Market Performance
- 4.2.11.7. Cross-Border Dynamics
- 4.2.1. Time Period
- 4.3. Conclusion
5. EXECUTIVE SUMMARY
6. INTRODUCTION
- 6.1. Chapter Overview
- 6.2. Overview of Exoskeletons
- 6.3. History of Exoskeletons
- 6.4. Classification of Exoskeletons
- 6.4.1. Based on Body Part Supported
- 6.4.2. Based on Form of Exoskeleton
- 6.4.3. Based on Mode of Operation
- 6.4.4. Based on Mobility
- 6.5. Features of Exoskeletons
- 6.6. Limitations of Exoskeletons
- 6.7. Applications of Exoskeletons
- 6.8. Future Aspects of Exoskeletons
7. MEDICAL EXOSKELETONS: MARKET LANDSCAPE
- 7.1. Chapter Overview
- 7.2. Medical Exoskeletons: Overall Market Landscape
- 7.2.1. Analysis by Status of Development
- 7.2.2. Analysis by Type of Body Part Covered
- 7.2.3. Analysis by Mode of Operation
- 7.2.4. Analysis by Type of Body Part Covered and Mode of Operation
- 7.2.5. Analysis by Form of Exoskeleton
- 7.2.6. Analysis by Mode of Operation and Form of Exoskeleton
- 7.2.7. Analysis by Type of Body Part Covered and Form of Exoskeleton
- 7.2.8. Analysis by Device Mobility
- 7.2.9. Analysis by Mode of Operation and Device Mobility
- 7.2.10. Analysis by Form of Exoskeleton and Device Mobility
- 7.2.11. Analysis by Type of Body Part Covered and Device Mobility
- 7.2.12. Analysis by User-Machine Interface
- 7.2.13. Analysis by Type of Body Part Covered and User-Machine Interface
- 7.2.14. Analysis by Mode of Operation and User-Machine Interface
- 7.2.15. Analysis by Availability of Advanced Features
- 7.2.16. Analysis by End User
- 7.2.17. Analysis by Patient Age Group
- 7.2.18. Analysis by Exoskeleton Setting for Patients
- 7.2.19. Analysis by Breakthrough Designation
- 7.3. Medical Exoskeletons: Developer Landscape
- 7.3.1. Analysis by Year of Establishment
- 7.3.2. Analysis by Company Size
- 7.3.3. Analysis by Location of Headquarters
- 7.3.4. Analysis by Company Size and Location of Headquarters (Region)
- 7.3.5. Analysis by Company Ownership
- 7.3.6. Analysis by Location of Headquarters (Region) and Company Ownership
- 7.3.7. Analysis by Additional Services Offered
- 7.3.8. Most Active Players: Analysis by Number of Medical Exoskeletons
8. NON-MEDICAL EXOSKELETONS: MARKET LANDSCAPE
- 8.1. Chapter Overview
- 8.2. Non-Medical Exoskeletons: Overall Market Landscape
- 8.2.1. Analysis by Status of Development
- 8.2.2. Analysis by Type of Body Part Covered
- 8.2.3. Analysis by Body Part Supported
- 8.2.4. Analysis by Mode of Operation
- 8.2.5. Analysis by Form of Exoskeleton
- 8.2.6. Analysis by Type of Body Part Covered and Mode of Operation
- 8.2.7. Analysis by Type of Body Part Covered and Form of Exoskeleton
- 8.2.8. Analysis by Mode of Operation and Form of Exoskeleton
- 8.2.9. Analysis by Application Area
- 8.2.10. Analysis by Mode of Operation and Application Area
- 8.3. Non-Medical Exoskeletons: Developer Landscape
- 8.3.1. Analysis by Year of Establishment
- 8.3.2. Analysis by Company Size
- 8.3.3. Analysis by Company Size and Employee Count
- 8.3.4. Analysis by Location of Headquarters
- 8.3.5. Analysis by Company Size and Location of Headquarters (Region)
- 8.3.6. Analysis by Company Ownership
- 8.3.7. Analysis by Location of Headquarters (Region) and Company Ownership
- 8.3.8. Most Active Players: Analysis by Number of Non-Medical Exoskeletons
- 8.3.9. Most Active Players: Analysis by Number of Exoskeletons
9. MEDICAL EXOSKELETONS: PRODUCT CompetitiveNESS ANALYSIS
- 9.1. Chapter Overview
- 9.2. Assumptions and Key Parameters
- 9.3. Methodology
- 9.4. Medical Exoskeletons: Product Competitiveness Analysis
- 9.4.1. Product Competitiveness Analysis: Upper Body Medical Exoskeletons
- 9.4.1.1. Product Competitiveness Analysis: Powered Upper Body Exoskeletons
- 9.4.1.2. Product Competitiveness Analysis: Passive Upper Body Exoskeletons
- 9.4.1.3. Product Competitiveness Analysis: Hybrid Upper Body Exoskeletons
- 9.4.2. Product Competitiveness Analysis: Lower Body Exoskeletons
- 9.4.2.1. Product Competitiveness Analysis: Powered Lower Body Exoskeletons
- 9.4.2.2. Product Competitiveness Analysis: Passive Lower Body Exoskeletons
- 9.4.2.3. Product Competitiveness Analysis: Hybrid Lower Body Exoskeletons
- 9.4.3. Product Competitiveness Analysis: Full Body Medical Exoskeletons
- 9.4.1. Product Competitiveness Analysis: Upper Body Medical Exoskeletons
10. EXOSKELETON DEVELOPERS: DETAILED COMPANY PROFILES
- 10.1. Chapter Overview
- 10.2. CYBERDYNE
- 10.2.1. Company Overview
- 10.2.2. Financial Information
- 10.2.3. Product Portfolio
- 10.2.4. Recent Developments and Future Outlook
- 10.3. Ekso Bionics
- 10.3.1. Company Overview
- 10.3.2. Financial Information
- 10.3.3. Product Portfolio
- 10.3.4. Recent Developments and Future Outlook
- 10.4. ExoAtlet
- 10.4.1. Company Overview
- 10.4.2. Product Portfolio
- 10.4.3. Recent Developments and Future Outlook
- 10.5. Fourier Intelligence
- 10.5.1. Company Overview
- 10.5.2. Product Portfolio
- 10.5.3. Recent Developments and Future Outlook
- 10.6. Gloreha
- 10.6.1. Company Overview
- 10.6.2. Product Portfolio
- 10.6.3. Recent Developments and Future Outlook
- 10.7. Guangzhou Yikang
- 10.7.1. Company Overview
- 10.7.2. Product Portfolio
- 10.7.3. Recent Developments and Future Outlook
- 10.8. Hexar Humancare
- 10.8.1. Company Overview
- 10.8.2. Product Portfolio
- 10.8.3. Recent Developments and Future Outlook
- 10.9. Hocoma
- 10.9.1. Company Overview
- 10.9.2. Product Portfolio
- 10.9.3. Recent Developments and Future Outlook
- 10.10. Tyromotion
- 10.10.1. Company Overview
- 10.10.2. Product Portfolio
- 10.10.3. Recent Developments and Future Outlook
11. EXOSKELETON DEVELOPERS: TABULATED COMPANY PROFILES
- 11.1. Chapter Overview
- 11.2. Bionic Yantra
- 11.2.1. Company Overview
- 11.2.2. Product Portfolio
- 11.3. MediTouch
- 11.3.1. Company Overview
- 11.3.2. Product Portfolio
- 11.4. Milebot Robotics
- 11.4.1. Company Overview
- 11.4.2. Product Portfolio
- 11.5. Myomo
- 11.5.1. Company Overview
- 11.5.2. Product Portfolio
- 11.6. Neofect
- 11.6.1. Company Overview
- 11.6.2. Product Portfolio
- 11.7. NextStep Robotics
- 11.7.1. Company Overview
- 11.7.2. Product Portfolio
- 11.8. ReWalk Robotics
- 11.8.1. Company Overview
- 11.8.2. Product Portfolio
- 11.9. Rex Bionics
- 11.9.1. Company Overview
- 11.9.2. Product Portfolio
- 11.10. Roam Robotics
- 11.10.1. Company Overview
- 11.10.2. Product Portfolio
- 11.11. Trexo Robotics
- 11.11.1. Company Overview
- 11.11.2. Product Portfolio
- 11.12. U&O Technologies
- 11.12.1. Company Overview
- 11.12.2. Product Portfolio
12. MEDICAL EXOSKELETONS: PARTNERSHIPS AND COLLABORATIONS
- 12.1. Chapter Overview
- 12.2. Partnership Models
- 12.3. Medical Exoskeletons: List of Partnerships and Collaborations
- 12.3.1. Analysis by Year of Partnership
- 12.3.2. Analysis by Type of Partnership
- 12.3.3. Analysis by Year and Type of Partnership
- 12.3.4. Analysis by Purpose of Partnership
- 12.3.5. Analysis by Type and Purpose of Partnership
- 12.3.6. Analysis by Type of Partner
- 12.3.7. Analysis by Year of Partnership and Type of Partner
- 12.3.8. Analysis by Type of Non-Industry Players
- 12.3.9. Most Active Players: Distribution by Number of Partnerships
- 12.3.10. Analysis by Geography
- 12.3.10.1. Local and International Agreements
- 12.3.10.2. Intracontinental and Intercontinental Agreements
13. PATENT ANALYSIS
- 13.1. Chapter Overview
- 13.2. Scope and Methodology
- 13.3. Exoskeletons: Patent Analysis
- 13.3.1. Analysis by Patent Application Year
- 13.3.2. Analysis by Patent Publication Year
- 13.3.3. Analysis by Type of Patent and Patent Publication Year
- 13.3.4. Analysis by Publication Time
- 13.3.5. Analysis by Patent Jurisdiction
- 13.3.6. Analysis by CPC symbols
- 13.3.7. Analysis by Type of Applicant
- 13.3.8. Leading Industry Players: Analysis by Number of Patents
- 13.3.9. Leading Non-Industry Players: Analysis by Number of Patents
- 13.3.10. Leading Patent Assignees: Analysis by Number of Patents
- 13.4. Exoskeletons: Patent Benchmarking
- 13.4.1. Analysis by Patent Characteristics
- 13.4.2. Exoskeleton: Patent Valuation
- 13.5. Leading Players by Number of Citations
14. BLUE OCEAN STRATEGY
- 14.1. Overview of Blue Ocean Strategy
- 14.1.1. Red Oceans
- 14.1.2. Blue Oceans
- 14.1.3. Comparison of Red Ocean Strategy and Blue Ocean Strategy
- 14.1.4. Medical Exoskeletons: Blue Ocean Strategy and Shift Tools
- 14.1.4.1. Strategy Canvas
- 14.1.4.2. Pioneer-Migrator-Settler (PMS) Map
- 14.1.4.3. Buyer Utility Map
15. MARKET IMPACT ANALYSIS: DRIVERS, RESTRAINTS, OPPORTUNITIES AND CHALLENGES
- 15.1. Chapter Overview
- 15.2. Market Drivers
- 15.3. Market Restraints
- 15.4. Market Opportunities
- 15.5. Market Challenges
- 15.6. Conclusion
16. GLOBAL EXOSKELETONS MARKET
- 16.1. Chapter Overview
- 16.2. Forecast Methodology and Key Assumptions
- 16.3. Global Exoskeletons Market, Historical Trends (Since 2018) and Forecasted Estimates (Till 2035)
- 16.3.1. Scenario Analysis
- 16.3.1.1. Conservative Scenario
- 16.3.1.2. Optimistic Scenario
- 16.3.1. Scenario Analysis
- 16.4. Key Market Segmentations
17. EXOSKELETONS MARKET, BY BODY PART COVERED
- 17.1. Chapter Overview
- 17.2. Forecast Methodology and Key Assumptions
- 17.3. Overall Exoskeletons Market: Distribution by Body Part Covered
- 17.3.1. Overall Upper Body Exoskeletons: Historical Trends (Since 2018) and Forecasted Estimates (Till 2035)
- 17.3.2. Overall Lower Body Exoskeletons: Historical Trends (Since 2018) and Forecasted Estimates (Till 2035)
- 17.3.3. Overall Full Body Exoskeletons: Historical Trends (Since 2018) and Forecasted Estimates (Till 2035)
- 17.4. Medical Exoskeletons Market: Distribution by Body Part Covered
- 17.4.1. Medical Upper Body Exoskeletons: Historical Trends (Since 2018) and Forecasted Estimates (Till 2035)
- 17.4.2. Medical Lower Body Exoskeletons: Historical Trends (Since 2018) and Forecasted Estimates (Till 2035)
- 17.4.3. Medical Full Body Exoskeletons: Historical Trends (Since 2018) and Forecasted Estimates (Till 2035)
- 17.5. Non-Medical Exoskeletons Market: Distribution by Body Part Covered
- 17.5.1. Non-Medical Upper Body Exoskeletons: Historical Trends (Since 2018) and Forecasted Estimates (Till 2035)
- 17.5.2. Non-Medical Lower Body Exoskeletons: Historical Trends (Since 2018) and Forecasted Estimates (Till 2035)
- 17.5.3. Non-Medical Full Body Exoskeletons: Historical Trends (Since 2018) and Forecasted Estimates (Till 2035)
- 17.6. Data Triangulation and Validation
18. EXOSKELETONS MARKET, BY MODE OF OPERATION
- 18.1. Chapter Overview
- 18.2. Forecast Methodology and Key Assumptions
- 18.3. Overall Exoskeletons Market: Distribution by Mode of Operation
- 18.3.1. Overall Powered Exoskeletons Market: Historical Trends (Since 2018) and Forecasted Estimates (Till 2035)
- 18.3.2. Overall Passive Exoskeletons Market: Historical Trends (Since 2018) and Forecasted Estimates (Till 2035)
- 18.3.3. Overall Hybrid Exoskeletons Market: Historical Trends (Since 2018) and Forecasted Estimates (Till 2035)
- 18.4. Medical Exoskeletons Market: Distribution by Mode of Operation
- 18.4.1. Medical Powered Exoskeletons Market: Historical Trends (Since 2018) and Forecasted Estimates (Till 2035)
- 18.4.2. Medical Passive Exoskeletons Market: Historical Trends (Since 2018) and Forecasted Estimates (Till 2035)
- 18.4.3. Medical Hybrid Exoskeletons Market: Historical Trends (Since 2018) and Forecasted Estimates (Till 2035)
- 18.5. Non-Medical Exoskeletons Market: Distribution by Mode of Operation
- 18.5.1. Non-Medical Powered Exoskeletons Market: Historical Trends (Since 2018) and Forecasted Estimates (Till 2035)
- 18.5.2. Non-Medical Passive Exoskeletons Market: Historical Trends (Since 2018) and Forecasted Estimates (Till 2035)
- 18.5.3. Non-Medical Hybrid Exoskeletons Market: Historical Trends (Since 2018) and Forecasted Estimates (Till 2035)
- 18.6. Data Triangulation and Validation
19. EXOSKELETON MARKETS, BY FORM OF EXOSKELETON
- 19.1. Chapter Overview
- 19.2. Forecast Methodology and Key Assumptions
- 19.3. Overall Exoskeletons Market: Distribution by Form of Exoskeleton
- 19.3.1. Overall Rigid Exoskeletons: Historical Trends (Since 2018) and Forecasted Estimates (Till 2035)
- 19.3.2. Overall Soft Exoskeletons: Historical Trends (Since 2018) and Forecasted Estimates (Till 2035)
- 19.4. Medical Exoskeletons Market: Distribution by Form of Exoskeleton
- 19.4.1. Medical Rigid Exoskeletons: Historical Trends (Since 2018) and Forecasted Estimates (Till 2035)
- 19.4.2. Medical Soft Exoskeletons: Historical Trends (Since 2018) and Forecasted Estimates (Till 2035)
- 19.5. Non-Medical Exoskeletons Market: Distribution by Form of Exoskeleton
- 19.5.1. Non-Medical Rigid Exoskeletons: Historical Trends (Since 2018) and Forecasted Estimates (Till 2035)
- 19.5.2. Non-Medical Soft Exoskeletons: Historical Trends (Since 2018) and Forecasted Estimates (Till 2035)
- 19.6. Data Triangulation and Validation
20. EXOSKELETON MARKETS, BY MOBILITY
- 20.1. Chapter Overview
- 20.2. Forecast Methodology and Key Assumptions
- 20.3. Medical Exoskeletons Market: Distribution by Mobility
- 20.3.1. Medical Fixed/ Supported Exoskeleton: Historical Trends (Since 2018) and Forecasted Estimates (Till 2035)
- 20.3.2. Medical Mobile / Overground Walking Exoskeleton: Historical Trends (Since 2018) and Forecasted Estimates (Till 2035)
- 20.4. Data Triangulation and Validation
21. EXOSKELETONS MARKET, BY END USER
- 21.1. Chapter Overview
- 21.2. Forecast Methodology and Key Assumptions
- 21.3. Overall Exoskeletons Market: Distribution by End User
- 21.4. Exoskeletons Market for Patients: Historical Trends (Since 2018) and Forecasted Estimates (Till 2035)
- 21.5. Exoskeletons Market for Healthcare Providers: Historical Trends (Since 2018) and Forecasted Estimates (Till 2035)
- 21.6. Exoskeletons Market for Industry Workers: Historical Trends (Since 2018) and Forecasted Estimates (Till 2035)
- 21.7. Exoskeletons Market for Military Personnel: Historical Trends (Since 2018) and Forecasted Estimates (Till 2035)
- 21.8. Exoskeletons Market for Other End Users: Historical Trends (Since 2018) and Forecasted Estimates (Till 2035)
- 21.9. Data Triangulation and Validation
22. EXOSKELETONS MARKET, BY KEY GEOGRAPHICAL REGIONS
- 22.1. Chapter Overview
- 22.2. Forecast Methodology and Key Assumptions
- 22.3. Overall Exoskeletons Market: Distribution by Key Geographical Regions
- 22.3.1. North America, Historical Trends (Since 2018) and Forecasted Estimates (Till 2035)
- 22.3.2. Europe, Historical Trends (Since 2018) and Forecasted Estimates (Till 2035)
- 22.3.3. Asia-Pacific, Historical Trends (Since 2018) and Forecasted Estimates (Till 2035)
- 22.3.4. Rest of the World, Historical Trends (Since 2018) and Forecasted Estimates (Till 2035)
- 22.4. Data Triangulation and Validation
23. CONCLUSION
24. EXECUTIVE INSIGHTS
25. APPENDIX I: BLUE OCEAN STRATEGY AND SHIFT TOOLS
- 25.1. Chapter Overview
- 25.2. Blue Ocean Strategy and Shift Tools
- 25.2.1. Value Innovation
- 25.2.2. Four Action Framework
- 25.2.3. Eliminate-Raise-Reduce-Create (ERRC) Grid
- 25.2.4. Six Path Framework
- 25.2.5. Three Tiers of Non-customers
- 25.3. Sequence of Blue Ocean Strategy
- 25.3.1. The Price Corridor of the Mass
- 25.3.2. Four Hurdles to Strategy Execution
- 25.3.3. Tipping Point Leadership
- 25.3.4. Fair Process
26. APPENDIX II: TABULATED DATA
27. APPENDIX III: LIST OF COMPANIES AND ORGANIZATION
List of Tables
- Table 6.1 Degrees of Freedom in Each Joint of Lower Exoskeletons
- Table 6.2 Contrasting Characteristics: Medical and Non-Medical Exoskeletons
- Table 6.3 Distinguishing Characteristics: Medical and Non-medical Exoskeletons
- Table 7.1 Medical Exoskeletons: Information on Status of Development, Type of Body Part Covered and Mode of Operation
- Table 7.2 Medical Exoskeletons: Information on Form, Device Mobility and User-Machine Interface
- Table 7.3 Medical Exoskeletons: Information on Advanced Features and End Users
- Table 7.4 Medical Exoskeletons: Information on Patient Age Group, Exoskeleton Setting for Patients and Breakthrough Designation
- Table 7.5 Medical Exoskeletons: Information on Technology / Software, Maximum Weight of Exoskeleton, Maximum Weight Carrying Capacity and Dimensions
- Table 7.6 Medical Exoskeletons: List of Developers
- Table 7.7 Medical Exoskeletons: Information on Additional Services Offered
- Table 8.1 Non-Medical Exoskeletons: Information on Status of Development, Type of Body Part Covered and Body Part Supported
- Table 8.2 Non-Medical Exoskeletons: Information on Mode of Operation and Form of Exoskeleton
- Table 8.3 Non-Medical Exoskeletons: Information on Application Area
- Table 8.4 Non-Medical Exoskeletons: Information on Technology / Software, Maximum Weight of Exoskeleton, Maximum Weight Carrying Capacity and Dimensions
- Table 8.5 Non-Medical Exoskeletons: List of Developers
- Table 10.1 List of Exoskeleton Companies Profiled
- Table 10.2 CYBERDYNE: Company Snapshot
- Table 10.3 CYBERDYNE: Medical Exoskeleton Portfolio
- Table 10.4 CYBERDYNE: Non-Medical Exoskeleton Portfolio
- Table 10.5 CYBERDYNE: Recent Developments and Future Outlook
- Table 10.6 Ekso Bionics: Company Snapshot
- Table 10.7 Ekso Bionics: Medical Exoskeleton Portfolio
- Table 10.8 Ekso Bionics: Non-Medical Exoskeleton Portfolio
- Table 10.9 Ekso Bionics: Recent Developments and Future Outlook
- Table 10.10 ExoAtlet: Company Snapshot
- Table 10.11 ExoAtlet: Medical Exoskeleton Portfolio
- Table 10.12 ExoAtlet: Non-Medical Exoskeleton Portfolio
- Table 10.13 ExoAtlet: Recent Developments and Future Outlook
- Table 10.14 Fourier Intelligence: Company Snapshot
- Table 10.15 Fourier Intelligence: Medical Exoskeleton Portfolio
- Table 10.16 Fourier Intelligence: Recent Developments and Future Outlook
- Table 10.17 Gloreha: Company Snapshot
- Table 10.18 Gloreha: Medical Exoskeleton Portfolio
- Table 10.19 Gloreha: Recent Developments and Future Outlook
- Table 10.20 Guangzhou YiKang: Company Snapshot
- Table 10.21 Guangzhou YiKang: Medical Exoskeleton Portfolio
- Table 10.22 Guangzhou YiKang: Recent Developments and Future Outlook
- Table 10.23 Hexar Humancare: Company Snapshot
- Table 10.24 Hexar Humancare: Medical Exoskeleton Portfolio
- Table 10.25 Hexar Humancare: Non-Medical Exoskeleton Portfolio
- Table 10.26 Hexar Humancare: Recent Developments and Future Outlook
- Table 10.27 Hocoma: Company Snapshot
- Table 10.28 Hocoma: Medical Exoskeleton Portfolio
- Table 10.29 Hocoma: Recent Developments and Future Outlook
- Table 10.30 Panasonic: Company Snapshot
- Table 10.31 Panasonic: Medical Exoskeleton Portfolio
- Table 10.32 Panasonic: Non-Medical Exoskeleton Portfolio
- Table 10.33 Panasonic: Recent Developments and Future Outlook
- Table 10.34 Tyromotion: Company Snapshot
- Table 10.35 Tyromotion: Medical Exoskeleton Portfolio
- Table 10.36 Tyromotion: Recent Developments and Future Outlook
- Table 11.1 Exoskeleton Developers: List of Companies Profiled
- Table 11.2 Bionic Yantra: Company Snapshot
- Table 11.3 Bionic Yantra: Medical Exoskeleton Portfolio
- Table 11.4 MediTouch: Company Snapshot
- Table 11.5 MediTouch: Medical Exoskeleton Portfolio
- Table 11.6 Milebot Robotics: Company Snapshot
- Table 11.7 Milebot Robotics: Medical Exoskeleton Portfolio
- Table 11.8 Milebot Robotics: Non- Medical Exoskeleton Portfolio
- Table 11.9 Myomo: Company Snapshot
- Table 11.10 Myomo: Medical Exoskeleton Portfolio
- Table 11.11 Neofect: Company Snapshot
- Table 11.12 Neofect: Medical Exoskeleton Portfolio
- Table 11.13 NextStep Robotics: Company Snapshot
- Table 11.14 NextStep Robotics: Medical Exoskeleton Portfolio
- Table 11.15 ReWalk Robotics: Company Snapshot
- Table 11.16 ReWalk Robotics: Medical Exoskeleton Portfolio
- Table 11.17 REX Bionics: Company Snapshot
- Table 11.18 REX Bionics: Medical Exoskeleton Portfolio
- Table 11.19 Roam Robotics: Company Snapshot
- Table 11.20 Roam Robotics: Medical Exoskeleton Portfolio
- Table 11.21 Roam Robotics: Non-Medical Exoskeleton Portfolio
- Table 11.22 Trexo Robotics: Company Snapshot
- Table 11.23 Trexo Robotics: Medical Exoskeleton Portfolio
- Table 11.24 U&O Technologies: Company Snapshot
- Table 11.25 U&O Technologies: Medical Exoskeleton Portfolio
- Table 12.1 Medical Exoskeletons: List of Partnerships and Collaborations
- Table 13.1 Patent Analysis: Top CPC Sections
- Table 13.2 Patent Analysis: Top CPC Symbols
- Table 13.3 Patent Analysis: Top CPC Codes
- Table 13.4 Patent Analysis: Summary of Benchmarking Analysis
- Table 13.5 Patent Analysis: Categorization based on Weighted Valuation Scores
- Table 13.6 Patent Portfolio: List of Leading Patents (by Highest Relative Valuation)
- Table 13.7 Patent Portfolio: List of Leading Patents (by Number of Citations)
- Table 16.1 Average Price of Powered Exoskeletons Used across Different Application Areas
- Table 17.1 Estimated Revenues of Medical Exoskeletons, based on Body Part Covered
- Table 17.2 Estimated Revenues of Non-Medical Exoskeletons, based on Body Part Covered
- Table 18.1 Estimated Revenues of Powered, Passive and Hybrid Exoskeletons from Various Application Areas
- Table 19.1 Estimated Revenues of Medical Exoskeletons, based on Form
- Table 19.2 Estimated Revenues of Non-Medical Exoskeletons, based on Form
- Table 19.3 Estimated Revenues of Medical Exoskeletons, based on Mobility
- Table 21.1 Estimated Revenues for Medical Exoskeletons from Various End Users
- Table 21.2 Estimated Revenues for Non-Medical Exoskeletons from Various End Users
- Table 24.1 ABLE Human Motion: Key Highlights
- Table 24.2 Archelis: Key Highlights
- Table 24.3 Biomotum: Key Highlights
- Table 24.4 Bionic Yantra: Key Highlights
- Table 24.5 Bionic Power: Key Highlights
- Table 26.1 Medical Exoskeletons: Distribution by Status of Development
- Table 26.2 Medical Exoskeletons: Distribution by Type of Body Part Covered
- Table 26.3 Medical Exoskeletons: Distribution by Mode of Operation
- Table 26.4 Medical Exoskeletons: Distribution by Type of Body Part Covered and Mode of Operation
- Table 26.5 Medical Exoskeletons: Distribution by Form of Exoskeleton
- Table 26.6 Medical Exoskeletons: Distribution by Mode of Operation and Form of Exoskeleton
- Table 26.7 Medical Exoskeletons: Distribution by Type of Body Part Covered and Form of Exoskeleton
- Table 26.8 Medical Exoskeletons: Distribution by Device Mobility
- Table 26.9 Medical Exoskeletons: Distribution by Mode of Operation and Device Mobility
- Table 26.10 Medical Exoskeletons: Distribution by Form of Exoskeleton and Device Mobility
- Table 26.11 Medical Exoskeletons: Distribution by Type of Body Part Covered and Device Mobility
- Table 26.12 Medical Exoskeletons: Distribution by User-Machine Interface
- Table 26.13 Medical Exoskeletons: Distribution by Type of Body Part Covered and User-Machine Interface
- Table 26.14 Medical Exoskeletons: Distribution by Mode of Operation and User-Machine Interface
- Table 26.15 Medical Exoskeletons: Distribution by Availability of Advanced Features
- Table 26.16 Medical Exoskeletons: Distribution by End User
- Table 26.17 Medical Exoskeletons: Distribution by Patient Age Group
- Table 26.18 Medical Exoskeletons: Distribution by Exoskeleton Setting for Patients
- Table 26.19 Medical Exoskeletons: Distribution by Breakthrough Designation
- Table 26.20 Medical Exoskeleton Developers: Distribution by Year of Establishment
- Table 26.21 Medical Exoskeleton Developers: Distribution by Company Size
- Table 26.22 Medical Exoskeleton Developers: Distribution by Company Size and Employee Count
- Table 26.23 Medical Exoskeleton Developers: Distribution by Location of Headquarters (Region)
- Table 26.24 Medical Exoskeleton Developers: Distribution by Location of Headquarters (Country)
- Table 26.25 Medical Exoskeleton Developers: Distribution by Company Size and Location of Headquarters
- Table 26.26 Medical Exoskeleton Developers: Distribution by Company Ownership
- Table 26.27 Medical Exoskeleton Developers: Distribution by Location of Headquarters and Company Ownership
- Table 26.28 Medical Exoskeleton Developers: Distribution by Additional Services Offered
- Table 26.29 Most Active Players: Distribution by Number of Medical Exoskeletons
- Table 26.30 Non-Medical Exoskeletons: Distribution by Status of Development
- Table 26.31 Non-Medical Exoskeletons: Distribution by Type of Body Part Covered
- Table 26.32 Non-Medical Exoskeletons: Distribution by Body Part Supported
- Table 26.33 Non-Medical Exoskeletons: Distribution by Mode of Operation
- Table 26.34 Non-Medical Exoskeletons: Distribution by Form of Exoskeleton
- Table 26.35 Non-Medical Exoskeletons: Distribution by Mode of Operation and Form of Exoskeleton
- Table 26.36 Non-Medical Exoskeletons: Distribution by Type of Body Part Covered and Mode of Operation
- Table 26.37 Non-Medical Exoskeletons: Distribution by Mode of Operation and Form of Exoskeleton
- Table 26.38 Non-Medical Exoskeletons: Distribution by Type of Body Part Covered and Form of Exoskeleton
- Table 26.39 Non-Medical Exoskeletons: Distribution by Application Area
- Table 26.40 Non-Medical Exoskeletons: Distribution by Mode of Operation and Application Area
- Table 26.41 Non-Medical Exoskeletons Developers: Distribution by Year of Establishment
- Table 26.42 Non-Medical Exoskeleton Developers: Distribution by Company Size
- Table 26.43 Non-Medical Exoskeleton Developers: Distribution by Company Size and Employee Count
- Table 26.44 Non-Medical Exoskeleton Developers: Distribution by Location of Headquarters (Region)
- Table 26.45 Non-Medical Exoskeleton Developers: Distribution by Location of Headquarters (Country)
- Table 26.46 Non-Medical Exoskeleton Developers: Distribution by Company Size and Location of Headquarters
- Table 26.47 Non-Medical Exoskeleton Developers: Distribution by Company Ownership
- Table 26.48 Non-Medical Exoskeleton Developers: Distribution by Location of Headquarters and Company Ownership
- Table 26.49 Most Active Players: Distribution by Number of Non-Medical Exoskeletons
- Table 26.50 Most Active Players: Distribution by Number of Medical and Non-Medical Exoskeletons
- Table 26.51 CYBERDYNE: Annual Revenues, Since FY 2019 (JPY Billion)
- Table 26.52 CYBERDYNE: Distribution of Annual Revenues by Business Segment, Since FY 2021 (JPY Billion)
- Table 26.53 Ekso Bionics: Annual Revenues, Since FY 2018 (USD Billion)
- Table 26.54 Ekso Bionics: Distribution of Annual Revenues by Business Segment, FY 2023
- Table 26.55 Panasonic: Annual Revenues, Since FY 2018 (JPY Billion)
- Table 26.56 Partnerships and Collaborations: Cumulative Year-wise Trend
- Table 26.57 Partnerships and Collaborations: Distribution by Type of Partnership
- Table 26.58 Partnerships and Collaborations: Distribution by Year and Type of Partnership
- Table 26.59 Partnerships and Collaborations: Distribution by Purpose of Partnership
- Table 26.60 Partnerships and Collaborations: Distribution by Type and Purpose of Partnership
- Table 26.61 Partnerships and Collaborations: Distribution by Type of Partner
- Table 26.62 Partnerships and Collaborations: Distribution by Type of Partnership and Type of Partner
- Table 26.63 Partnerships and Collaborations: Type of Non-Industry Partner
- Table 26.64 Most Active Players: Distribution by Number of Partnerships
- Table 26.65 Partnerships and Collaborations: Local and International Agreements
- Table 26.66 Partnerships and Collaborations: Intracontinental and Intercontinental Agreements
- Table 26.67 Patent Analysis: Distribution by Type of Patent
- Table 26.68 Patent Analysis: Cumulative Year-wise Trend by Patent Application Year
- Table 26.69 Patent Analysis: Cumulative Year-wise Trend by Patent Publication Year
- Table 26.70 Patent Analysis: Distribution by Type of Patent and Patent Publication Year
- Table 26.71 Patent Analysis: Distribution by Publication Time
- Table 26.72 Patent Analysis: Distribution by Patent Jurisdiction (Region)
- Table 26.73 Patent Analysis: Distribution by Patent Jurisdiction (Country)
- Table 26.74 Patent Analysis: Distribution by Type of Applicant
- Table 26.75 Leading Industry Players: Distribution by Number of Patents
- Table 26.76 Leading Non-Industry Players: Distribution by Number of Patents
- Table 26.77 Leading Individual Assignees: Distribution by Number of Patents
- Table 26.78 Leading Industry Players: Benchmarking by Patent Characteristics (CPC Codes)
- Table 26.79 Leading Non-Industry Players: Benchmarking by Patent Characteristics (CPC Codes)
- Table 26.80 Patent Analysis: Distribution by Patent Age
- Table 26.81 Patent Analysis: Patent Valuation
- Table 26.82 Global Exoskeletons Market, Historical Trends (Since 2018) and Forecasted Estimates (Till 2035) (USD Billion)
- Table 26.83 Global Exoskeletons Market, Forecasted Estimates (Till 2035) Conservative Scenario (USD Billion)
- Table 26.84 Global Exoskeletons Market, Forecasted Estimates (Till 2035), Optimistic Scenario (USD Billion)
- Table 26.85 Medical Exoskeletons Market: Distribution by Body Part Covered (USD Billion)
- Table 26.86 Medical Upper Body Exoskeleton Market: Historical Trends (Since 2018) and Forecasted Estimates (Till 2035) (USD Billion)
- Table 26.87 Medical Lower Body Exoskeleton Market: Historical Trends (Since 2018) and Forecasted Estimates (Till 2035) (USD Billion)
- Table 26.88 Medical Full Body Exoskeleton Market: Historical Trends (Since 2018) and Forecasted Estimates (Till 2035) (USD Billion)
- Table 26.89 Non-Medical Upper Body Exoskeletons Market: Historical Trends (Since 2018) and Forecasted Estimates (2023- 2035) (USD Billion)
- Table 26.90 Non-Medical Lower Body Exoskeleton Market: Historical Trends (Since 2018) and Forecasted Estimates (Till 2035) (USD Billion)
- Table 26.91 Non-Medical Full Body Exoskeleton Market Historical Trends (Since 2018) and Forecasted Estimates (Till 2035)
- Table 26.92 Overall Exoskeletons Market: Distribution by Body Part Covered (USD Billion)
- Table 26.93 Overall Upper Body Exoskeletons Market: Historical Trends (Since 2018) and Forecasted Estimates (Till 2035) (USD Billion)
- Table 26.94 Overall Lower Body Exoskeletons Market: Historical Trends (Since 2018) and Forecasted Estimates (Till 2035) (USD Billion)
- Table 26.95 Overall Full Body Exoskeletons Market: Historical Trends (Since 2018) and Forecasted Estimates (Till 2035) (USD Billion)
- Table 26.96 Medical Exoskeletons Market: Distribution by Mode of Operation (USD Billion)
- Table 26.97 Medical Powered Exoskeletons Market: Historical Trends (Since 2018) and Forecasted Estimates (Till 2035) (USD Billion)
- Table 26.98 Medical Passive Exoskeletons Market: Historical Trends (Since 2018) and Forecasted Estimates (Till 2035) (USD Billion)
- Table 26.99 Medical Hybrid Exoskeletons Market: Historical Trends (Since 2018) and Forecasted Estimates (Till 2035) (USD Billion)
- Table 26.100 Non-Medical Exoskeletons Market: Distribution by Mode of Operation (USD Billion)
- Table 26.101 Non-Medical Powered Exoskeletons Market: Historical Trends (Since 2018) and Forecasted Estimates (2023- 2035) (USD Billion)
- Table 26.102 Non-Medical Passive Exoskeletons Market: Historical Trends (Since 2018) and Forecasted Estimates (Till 2035) (USD Billion)
- Table 26.103 Non-Medical Hybrid Exoskeletons Market: Historical Trends (Since 2018) and Forecasted Estimates (Till 2035) (USD Billion)
- Table 26.104 Overall Powered Exoskeletons Market: Historical Trends (Since 2018) and Forecasted Estimates (2023- 2035) (USD Billion)
- Table 26.105 Overall Passive Exoskeletons Market: Historical Trends (Since 2018) and Forecasted Estimates (Till 2035) (USD Billion)
- Table 26.106 Overall Hybrid Exoskeletons Market: Historical Trends (Since 2018) and Forecasted Estimates (Till 2035) (USD Billion)
- Table 26.107 Medical Exoskeletons Market: Distribution by Form (USD Billion)
- Table 26.108 Medical Rigid Exoskeletons Market: Historical Trends (Since 2018) and Forecasted Estimates (Till 2035) (USD Billion)
- Table 26.109 Medical Soft Exoskeletons Market: Historical Trends (Since 2018) and Forecasted Estimates (Till 2035) (USD Billion)
- Table 26.110 Non-Medical Exoskeletons Market: Distribution by Form, 2018, 2023 and 2035 (USD Billion)
- Table 26.111 Non-Medical Rigid Exoskeletons Market: Historical Trends (Since 2018) and Forecasted Estimates (Till 2035) (USD Billion)
- Table 26.112 Non-Medical Soft Exoskeletons Market: Historical Trends (Since 2018) and Forecasted Estimates (Till 2035) (USD Billion)
- Table 26.113 Overall Exoskeletons Market: Distribution by Form (USD Billion)
- Table 26.114 Overall Rigid Exoskeletons Market: Historical Trends (Since 2018) and Forecasted Estimates (Till 2035)
- Table 26.115 Overall Soft Exoskeletons Market: Historical Trends (Since 2018) and Forecasted Estimates (Till 2035) (USD Billion)
- Table 26.116 Medical Fixed / Supported Exoskeletons Market: Historical Trends (Since 2018) and Forecasted Estimates (Till 2035) (USD Billion)
- Table 26.117 Medical Mobile / Overground Walking Exoskeletons Market: Historical Trends (Since 2018) and Forecasted Estimates (Till 2035) (USD Billion)
- Table 26.118 Overall Exoskeletons Market: Distribution by End Users (USD Billion)
- Table 26.119 Medical Exoskeletons Market by Patients: Historical Trends (Since 2018) and Forecasted Estimates (2023- 2035) (USD Billion)
- Table 26.120 Medical Exoskeletons Market by Healthcare Professionals: Historical Trends (Since 2018) and Forecasted Estimates (2023- 2035) (USD Billion)
- Table 26.121 Non-Medical Exoskeletons Market by Industry Workers: Historical Trends (Since 2018) and Forecasted Estimates (Till 2035) (USD Billion)
- Table 26.122 Non-Medical Exoskeletons Market by Military Personnel: Historical Trends (Since 2018) and Forecasted Estimates (Till 2035) (USD Billion)
- Table 26.123 Non-Medical Exoskeletons Market by Other End Users: Historical Trends (Since 2018) and Forecasted Estimates (Till 2035) (USD Billion)
- Table 26.124 Exoskeletons Market in North America: Historical Trends (Since 2018) Forecasted Estimates (2023- 2035) (USD Billion)
- Table 26.125 Exoskeletons Market in Europe: Historical Trends (Since 2018) Forecasted Estimates (2023- 2035) (USD Billion)
- Table 26.126 Exoskeleton Market in Asia-Pacific: Historical Trends (Since 2018) Forecasted Estimates (Till 2035) (USD Billion)
- Table 26.127 Exoskeleton Market in Rest of the World: Historical Trends (Since 2018) Forecasted Estimates (Till 2035) (USD Billion)
List of Figures
- Figure 2.1 Research Methodology: Project Methodology
- Figure 2.2 Research Methodology: Data Sources for Secondary Research
- Figure 2.3 Research Methodology: Robust Quality Control
- Figure 3.1 Market Dynamics: Forecast Methodology
- Figure 3.2 Market Dynamics: Key Market Segmentation
- Figure 4.1 Lessons Learnt from Past Recessions
- Figure 5.1 Executive Summary: Medical Exoskeletons Market Landscape
- Figure 5.2 Executive Summary: Non-Medical Exoskeletons Market Landscape
- Figure 5.3 Executive Summary: Partnerships and Collaborations
- Figure 5.4 Executive Summary: Patent Analysis
- Figure 5.5 Executive Summary: Overall Market Forecast and Opportunity Analysis
- Figure 5.6 Executive Summary: Medical Exoskeletons Market Forecast and Opportunity Analysis
- Figure 5.7 Executive Summary: Non-Medical Exoskeletons Market Forecast and Opportunity Analysis
- Figure 6.1 Types of Mobility Assistive Devices
- Figure 6.2 Historical Events Related to Exoskeletons
- Figure 6.3 Classification of Exoskeletons
- Figure 6.4 Movements Supported by Lower Body, Upper Body and Full Body Exoskeletons
- Figure 6.5 Components of a Powered / Robotic Exoskeletons
- Figure 6.6 Features of Exoskeletons
- Figure 6.7 Limitations of Exoskeletons
- Figure 6.8 Applications of Exoskeleton
- Figure 7.1 Medical Exoskeletons: Distribution by Status of Development
- Figure 7.2 Medical Exoskeletons: Distribution by Type of Body Part Covered
- Figure 7.3 Medical Exoskeletons: Distribution by Mode of Operation
- Figure 7.4 Medical Exoskeletons: Distribution Type of Body Part Covered and Mode of Operation
- Figure 7.5 Medical Exoskeletons: Distribution by Form of Exoskeleton
- Figure 7.6 Medical Exoskeletons: Distribution by Mode of Operation and Form of Exoskeleton
- Figure 7.7 Medical Exoskeletons: Distribution Type of Body Part Covered and Form of Exoskeleton
- Figure 7.8 Medical Exoskeletons: Distribution by Device Mobility
- Figure 7.9 Medical Exoskeletons: Distribution by Mode of Operation and Device Mobility
- Figure 7.10 Medical Exoskeletons: Distribution by Form and Device Mobility
- Figure 7.11 Medical Exoskeletons: Distribution by Type of Body Part Covered and Device Mobility
- Figure 7.12 Medical Exoskeletons: Distribution by User-Machine Interface
- Figure 7.13 Medical Exoskeletons: Distribution by Type of Body Part Covered and User-Machine Interface
- Figure 7.14 Medical Exoskeletons: Distribution by Mode of Operation and User-Machine Interface
- Figure 7.15 Medical Exoskeletons: Distribution by Availability of Advanced Features
- Figure 7.16 Medical Exoskeletons: Distribution by End User
- Figure 7.17 Medical Exoskeletons: Distribution by Patient Age Group
- Figure 7.18 Medical Exoskeletons: Distribution by Exoskeleton Setting for Patients
- Figure 7.19 Medical Exoskeletons: Distribution by Breakthrough Designation
- Figure 7.20 Medical Exoskeleton Developers: Distribution by Year of Establishment
- Figure 7.21 Medical Exoskeleton Developers: Distribution by Company Size
- Figure 7.22 Medical Exoskeleton Developers: Distribution by Company Size and Employee Count
- Figure 7.23 Medical Exoskeleton Developers: Distribution by Location of Headquarters (Region)
- Figure 7.24 Medical Exoskeleton Developers: Distribution by Location of Headquarters (Country)
- Figure 7.25 Medical Exoskeleton Developers: Distribution by Company Size and Location of Headquarters
- Figure 7.26 Medical Exoskeleton Developers: Distribution by Company Ownership
- Figure 7.27 Medical Exoskeleton Developers: Distribution by Location of Headquarters and Company Ownership
- Figure 7.28 Medical Exoskeleton Developers: Distribution by Additional Services Offered
- Figure 7.29 Most Active Players: Distribution by Number of Medical Exoskeleton
- Figure 8.1 Non-Medical Exoskeletons: Distribution by Status of Development
- Figure 8.2 Non-Medical Exoskeletons: Distribution by Type of Body Part Covered
- Figure 8.3 Non-Medical Exoskeletons: Distribution by Body Part Supported
- Figure 8.4 Non-Medical Exoskeletons: Distribution by Mode of Operation
- Figure 8.5 Non-Medical Exoskeletons: Distribution by Form of Exoskeleton
- Figure 8.6 Non-Medical Exoskeletons: Distribution by Type of Body Part Covered and Mode of Operation
- Figure 8.7 Non-Medical Exoskeletons: Distribution by Type of Body Part Covered and Form of Exoskeleton
- Figure 8.8 Non-Medical Exoskeletons: Distribution by Mode of Operation and Form of Exoskeleton
- Figure 8.9 Non-Medical Exoskeletons: Distribution by Application Area
- Figure 8.10 Non-Medical Exoskeletons: Distribution by Mode of Operation and Application Area
- Figure 8.11 Non-Medical Exoskeleton Developers: Distribution by Year of Establishment
- Figure 8.12 Non-Medical Exoskeleton Developers: Distribution by Company Size
- Figure 8.13 Non-Medical Exoskeleton Developers: Distribution by Company Size and Employee Count
- Figure 8.14 Non-Medical Exoskeleton Developers: Distribution by Location of Headquarters (Region)
- Figure 8.15 Non-Medical Exoskeleton Developers: Distribution by Location of Headquarters (Country)
- Figure 8.16 Non-Medical Exoskeleton Developers: Distribution by Company Size and Location of Headquarters
- Figure 8.17 Non-Medical Exoskeleton Developers: Distribution by Company Ownership
- Figure 8.18 Non-Medical Exoskeleton Developers: Distribution by Location of Headquarters and Company Ownership
- Figure 8.19 Most Active Players: Distribution by Number of Exoskeletons
- Figure 8.20 Most Active Players: Distribution by Number of Medical and Non-Medical Exoskeletons
- Figure 9.1 Product Competitiveness Analysis: Powered Upper Body Exoskeletons (Peer Group I)
- Figure 9.2 Product Competitiveness Analysis: Passive Upper Body Exoskeletons (Peer Group II)
- Figure 9.3 Product Competitiveness Analysis: Hybrid Upper Body Exoskeletons (Peer Group III)
- Figure 9.4 Product Competitiveness Analysis: Powered Lower Body Exoskeletons (Peer Group IV)
- Figure 9.5 Product Competitiveness Analysis: Passive Lower Body Exoskeletons (Peer Group V)
- Figure 9.6 Product Competitiveness Analysis: Hybrid Lower Body Exoskeletons (Peer Group VI)
- Figure 9.7 Product Competitiveness Analysis: Full Body Exoskeleton (Peer Group VII)
- Figure 10.1 CYBERDYNE: Annual Revenues, Since FY 2019 (JPY Billion)
- Figure 10.2 CYBERDYNE: Distribution of Revenues by Business Segment, Since FY 2021
- Figure 10.3 Ekso Bionics: Annual Revenues, Since FY 2018 - FY Q1 2023 (USD Billion)
- Figure 10.4 Ekso Bionics: Distribution of Revenues by Business Segment, FY 2023
- Figure 10.5 Panasonic: Annual Revenues, Since FY 2018 (JPY Billion)
- Figure 12.1 Partnerships and Collaborations: Cumulative Year-wise Trend
- Figure 12.2 Partnerships and Collaborations: Distribution by Type of Partnership
- Figure 12.3 Partnerships and Collaborations: Distribution by Year and Type of Partnership
- Figure 12.4 Partnerships and Collaborations: Distribution by Purpose of Partnership
- Figure 12.5 Partnerships and Collaborations: Distribution by Type and Purpose of Partnership
- Figure 12.6 Partnerships and Collaborations: Distribution by Type of Partner
- Figure 12.7 Partnerships and Collaborations: Distribution by Type of Partnership and Type of Partner
- Figure 12.8 Partnerships and Collaborations: Distribution by Type of Non-Industry Partner
- Figure 12.9 Most Active Players: Distribution by Number of Partnerships
- Figure 12.10 Partnerships and Collaborations: Local and International Agreements
- Figure 12.11 Partnerships and Collaborations: Intracontinental and Intercontinental Agreements
- Figure 13.1 Patent Analysis: Distribution by Type of Patent
- Figure 13.2 Patent Analysis: Cumulative Year-wise Trend by Patent Application Year
- Figure 13.3 Patent Analysis: Cumulative Year-wise Trend by Patent Publication Year
- Figure 13.4 Patent Analysis: Distribution by Type of Patent and Patent Publication Year
- Figure 13.5 Patent Analysis: Distribution by Publication Time
- Figure 13.6 Patent Analysis: Distribution by Patent Jurisdiction (Region)
- Figure 13.7 Patent Analysis: Distribution by Patent Jurisdiction (Country)
- Figure 13.8 Patent Analysis: Distribution by CPC Symbols
- Figure 13.9 Patent Analysis: Distribution by Type of Applicant
- Figure 13.10 Leading Industry Players: Distribution by Number of Patents
- Figure 13.11 Leading Non-Industry Players: Distribution by Number of Patents
- Figure 13.12 Leading Individual Assignees: Distribution by Number of Patents
- Figure 13.13 Patent Benchmarking Analysis: Distribution of CPC Codes by Leading Industry Players
- Figure 13.14 Patent Benchmarking Analysis: Distribution of CPC Codes by Leading Non- Industry Players
- Figure 13.15 Patent Analysis: Distribution by Patent Age
- Figure 13.16 Patent Analysis: Patent Valuation
- Figure 14.1 Differences Between Red Ocean Strategy and Blue Ocean Strategy
- Figure 14.2 Blue Ocean Strategy: Strategy Canvas
- Figure 14.3 Blue Ocean Strategy: Pioneer-Migrator-Settler (PMS) Map
- Figure 14.4 Blue Ocean Strategy: Buyer Utility Map
- Figure 16.1 Standard Demand-Price Curve for Exoskeleton
- Figure 16.2 Global Exoskeletons Market, Historical Trends (Since 2018) and Forecasted Estimates (Till 2035) (USD Billion)
- Figure 16.3 Global Exoskeletons Market, Forecasted Estimates (2023- 2035), Conservative Scenario (USD Billion)
- Figure 16.4 Global Exoskeletons Market, Forecasted Estimates (2023- 2035), Optimistic Scenario (USD Billion)
- Figure 17.1 Overall Exoskeletons Market: Distribution by Body Part Covered, 2018, 2023 and 2035 (USD Billion)
- Figure 17.2 Overall Exoskeletons Market for Upper Body Exoskeletons: Historical Trends (Since 2018) and Future Estimates (Till 2035) (USD Billion)
- Figure 17.3 Overall Exoskeletons Market for Lower Body Exoskeletons: Historical Trends (Since 2018) and Future Estimates (2023- 2035) (USD Billion)
- Figure 17.4 Overall Exoskeletons Market for Full Body Exoskeletons: Historical Trends (Since 2018) and Future Estimates (Till 2035) (USD Billion)
- Figure 17.5 Medical Exoskeletons Market: Distribution by Body Part Covered, 2018, 2023 and 2035 (USD Billion)
- Figure 17.6 Medical Exoskeletons Market for Upper Body Exoskeletons: Historical Trends (Since 2018) and Future Estimates (Till 2035) (USD Billion)
- Figure 17.7 Medical Exoskeletons Market for Lower Body Exoskeletons: Historical Trends (Since 2018) and Future Estimates (Till 2035) (USD Billion)
- Figure 17.8 Medical Exoskeletons Market for Full Body Exoskeletons: Historical Trends (Since 2018) and Future Estimates (Till 2035) (USD Billion)
- Figure 17.9 Non-Medical Exoskeletons Market: Distribution by Body Part Covered, 2018, 2023 and 2035 (USD Billion)
- Figure 17.10 Non-Medical Exoskeletons Market for Upper Body Exoskeletons: Historical Trends (Since 2018) and Future Estimates (Till 2035) (USD Billion)
- Figure 17.11 Non-Medical Exoskeletons Market for Lower Body Exoskeletons: Historical Trends (Since 2018) and Future Estimates (2023- 2035) (USD Billion)
- Figure 17.12 Non-Medical Exoskeletons Market for Full Body Exoskeletons: Historical Trends (Since 2018) and Future Estimates (Till 2035) (USD Billion)
- Figure 18.1 Overall Exoskeletons Market: Distribution by Mode of Operation, 2018, 2023 and 2035 (USD Billion)
- Figure 18.2 Overall Exoskeletons Market for Powered Exoskeletons, Historical Trends (Since 2018) and Future Estimates (Till 2035) (USD Billion)
- Figure 18.3 Overall Exoskeletons Market for Passive Exoskeletons, Historical Trends (Since 2018) and Future Estimates (Till 2035) (USD Billion)
- Figure 18.4 Overall Exoskeletons Market for Hybrid Exoskeletons, Historical Trends (Since 2018) and Future Estimates (Till 2035) (USD Billion)
- Figure 18.5 Medical Exoskeletons Market: Distribution by Mode of Operation, 2018, 2023 and 2035 (USD Billion)
- Figure 18.6 Medical Powered Exoskeletons Market, Historical Trends (Since 2018) and Future Estimates (Till 2035) (USD Billion)
- Figure 18.7 Medical Passive Exoskeletons Market, Historical Trends (Since 2018) and Future Estimates (Till 2035) (USD Billion)
- Figure 18.8 Medical Hybrid Exoskeletons Market, Historical Trends (Since 2018) and Future Estimates (Till 2035) (USD Billion)
- Figure 18.9 Non-Medical Exoskeletons Market: Distribution by Mode of Operation, 2018, 2023 and 2035 (USD Billion)
- Figure 18.10 Non-Medical Powered Exoskeletons Market, Historical Trends (Since 2018) and Future Estimates (Till 2035) (USD Billion)
- Figure 18.11 Non-Medical Passive Exoskeletons Market, Historical Trends (Since 2018) and Future Estimates (Till 2035) (USD Billion)
- Figure 18.12 Non-Medical Hybrid Exoskeletons Market, Historical Trends (Since 2018) and Future Estimates (Till 2035) (USD Billion)
- Figure 19.1 Overall Exoskeletons Market: Distribution by Form, 2018, 2023 and 2035 (USD Billion)
- Figure 19.2 Overall Exoskeletons Market for Rigid Exoskeletons, Historical Trends (Since 2018) and Future Estimates (Till 2035) (USD Billion)
- Figure 19.3 Overall Exoskeletons Market for Soft Exoskeletons, Historical Trends (Since 2018) and Future Estimates (Till 2035) (USD Billion)
- Figure 19.4 Medical Exoskeletons Market: Distribution by Form, 2018, 2023 and 2035 (USD Billion)
- Figure 19.5 Medical Rigid Exoskeletons Market, Historical Trends (Since 2018) and Future Estimates (Till 2035) (USD Billion)
- Figure 19.6 Medical Soft Exoskeletons Market, Historical Trends (Since 2018) and Future Estimates (Till 2035) (USD Billion)
- Figure 19.7 Non-Medical Exoskeletons Market: Distribution by Form, 2018, 2023 and 2035 (USD Billion)
- Figure 19.8 Non-Medical Rigid Exoskeletons Market, Historical Trends (Since 2018) and Future Estimates (Till 2035) (USD Billion)
- Figure 19.9 Non-Medical Soft Exoskeletons Market, Historical Trends (Since 2018) and Future Estimates (Till 2035) (USD Billion)
- Figure 20.1 Medical Exoskeletons Market: Distribution by Mobility, 2018, 2023 and 2035 (USD Billion)
- Figure 20.2 Medical Fixed / Supported Exoskeletons Market: Historical Trends (Since 2018) and Future Estimates (Till 2035) (USD Billion)
- Figure 20.3 Medical Mobile / Overground Walking Exoskeletons Market: Historical Trends (Since 2018) and Future Estimates (Till 2035) (USD Billion)
- Figure 21.1 Overall Exoskeletons Market: Distribution by End Users, 2018, 2023 and 2035 (USD Billion)
- Figure 21.2 Exoskeletons Market for Patients, Historical Trends (Since 2018) and Future Estimates (Till 2035) (USD Billion)
- Figure 21.3 Exoskeletons Market for Healthcare Professionals, Historical Trends (Since 2018) and Future Estimates (Till 2035) (USD Billion)
- Figure 21.4 Exoskeletons Market for Industry Workers, Historical Trends (Since 2018) and Future Estimates (Till 2035) (USD Billion)
- Figure 21.5 Exoskeletons Market for Military Personnel, Historical Trends (Since 2018) and Future Estimates (Till 2035) (USD Billion)
- Figure 21.6 Exoskeletons Market for Other End Users, Historical Trends (Since 2018) and Future Estimates (Till 2035) (USD Billion)
- Figure 22.1 Overall Exoskeletons Market: Distribution by Geography, 2018, 2023 and 2035
- Figure 22.2 Exoskeletons Market in North America, Historical Trends (Since 2018) and Future Estimates (Till 2035) (USD Billion)
- Figure 22.3 Exoskeletons Market in Europe, Historical Trends (Since 2018) and Future Estimates (Till 2035) (USD Billion)
- Figure 22.4 Exoskeletons Market in Asia-Pacific, Historical Trends (Since 2018) and Future Estimates (Till 2035) (USD Billion)
- Figure 22.5 Exoskeletons Market in Rest of the World, Historical Trends (Since 2018) and Future Estimates (Till 2035) (USD Billion)
- Figure 23.1 Concluding Remarks: Overall Medical Exoskeletons Market Landscape
- Figure 23.2 Concluding Remarks: Overall Non-Medical Exoskeletons Market Landscape
- Figure 23.3 Concluding Remarks: Partnerships and Collaborations
- Figure 23.4 Concluding Remarks: Patent Analysis
- Figure 23.5 Concluding Remarks: Market Forecast and Opportunity Analysis (I/II)
- Figure 23.6 Concluding Remarks: Market Forecast and Opportunity Analysis (II/II)
- Figure 25.1 Blue Ocean Strategy: Three Tiers of Non-customers
- Figure 25.2 Blue Ocean Strategy: Sequence of Blue Ocean Strategy
- Figure 25.3 Blue Ocean Strategy: The Price Corridor of The Mass

