PUBLISHER: Roots Analysis | PRODUCT CODE: 2161886

PUBLISHER: Roots Analysis | PRODUCT CODE: 2161886
Cancer Biomarkers Market - Trends and Forecast Till 2035
CANCER BIOMARKERS MARKET OVERVIEW
As per Roots Analysis, the global cancer biomarkers market is estimated to reach from USD 25.9 billion in the current year to USD 37.8 billion by 2035, expanding at a CAGR of 4.3%during the forecast period.
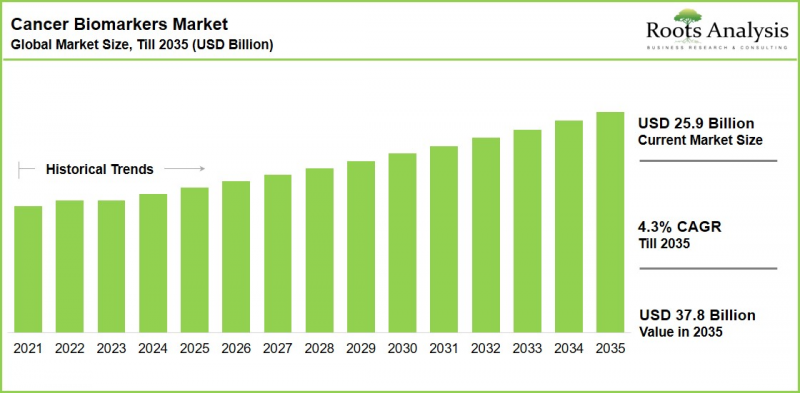
Cancer Biomarkers Market: Growth and Trends
Cancer biomarkers have become an important component of modern oncology as clinicians and drug developers increasingly seek molecular information to understand tumor biology and identify patients who are most likely to respond to specific therapies. Conventional approaches based primarily on cancer type and disease stage are increasingly being supplemented by molecular profiling, including biomarker testing for HER2, EGFR, PD-L1, ALK, NTRK and MET, alongside broader genomic indicators such as tumor mutational burden, microsatellite instability, single nucleotide variants, copy number variants and insertions and deletions.
The cancer biomarkers market is transitioning from conventional single-analyte testing toward integrated molecular profiling and multi-biomarker approaches. Increasing investments in precision medicine have encouraged pharmaceutical and biotechnology companies to incorporate biomarker strategies across drug discovery, clinical development, patient stratification and post-treatment monitoring. The growing pipeline of targeted oncology therapies is also expanding the need for companion and complementary diagnostic solutions. Biomarker testing can support identification of eligible patients, treatment selection and assessment of therapeutic response, thereby creating a closer link between oncology drug development and diagnostic testing.
Technological advancements are further changing the competitive landscape. Next-generation sequencing and liquid biopsy platforms are enabling the analysis of multiple genomic alterations from increasingly limited biological samples, while artificial intelligence and digital pathology are being explored to improve biomarker identification, interpretation and clinical decision-making. The combination of molecular diagnostics with real-world data and advanced analytics is expected to create additional opportunities across the oncology value chain.
Growth Drivers: Factors Fueling Cancer Biomarkers Market Expansion
Increasing incidence of breast, lung, colorectal, prostate and other cancers is expanding the addressable population for diagnostic, prognostic and predictive biomarker testing. The growing need for earlier and more precise disease characterization is supporting demand for molecular testing solutions. Healthcare providers and pharmaceutical companies are increasingly using molecular information to guide treatment selection. This is creating sustained demand for biomarkers that can identify actionable mutations, predict treatment response and support patient stratification.
Market Challenges: Critical Barriers Hindering Progress
Despite strong demand, several factors continue to influence the pace of market development. Discovery, analytical validation, clinical validation and regulatory approval can require substantial financial and technical resources. Long development timelines can also make it difficult for smaller companies to commercialize novel biomarker technologies.
Several emerging biomarkers require additional evidence demonstrating clinical utility across diverse patient populations. Lack of sufficiently large and representative datasets can delay adoption in routine oncology practice. Differences in assay methodologies, reporting formats, laboratory protocols and clinical datasets can complicate the integration and comparison of biomarker results.
Cancer Biomarkers Market: Emerging Opportunity Areas
Liquid Biopsy And Circulating Biomarkers: Liquid biopsy represents an important opportunity for non-invasive cancer detection and molecular monitoring. Continued improvements in sensitivity may expand applications across early detection, treatment selection, minimal residual disease monitoring and recurrence assessment.
Multi-Biomarker And Comprehensive Genomic Profiling: The growing complexity of cancer biology is creating demand for testing approaches capable of evaluating multiple genomic alterations simultaneously. Comprehensive profiling can support identification of actionable molecular changes across heterogeneous tumors.
AI-Powered Biomarker Discovery: Artificial intelligence can help analyze large genomic, pathological and clinical datasets to identify previously unrecognized molecular patterns. Integration of AI with digital pathology and multi-omics could create new biomarker discovery and interpretation opportunities.
Recent Developments in Cancer Biomarkers Market
The market is witnessing increased collaboration between diagnostic technology companies, pharmaceutical companies and data-driven oncology platforms.
- Illumina and Labcorp entered into a collaboration to advance precision oncology testing capabilities, with initiatives focused on expanding access to cancer biomarker testing.
- Lunit and Daiichi Sankyo partnered to advance biomarker discovery and translational research by integrating AI-powered digital pathology solutions into oncology pipeline programs.
- Tempus AI and Whitehawk Therapeutics collaborated to use real-world data to support biomarker-driven research and oncology pipeline development.
These developments demonstrate the increasing convergence of molecular diagnostics, artificial intelligence, real-world data and pharmaceutical R&D within the cancer biomarker ecosystem.
Cancer Biomarkers Market Segments
By Type of Biomarker
- HER2
- MET
- EGFR
- PD-L1
- NTRK
- ALK
- Other Biomarkers
By Type of Cancer
- Breast Cancer
- Colorectum Cancer
- Lung Cancer
- Prostate Cancer
- Thyroid Cancer
- Bladder Cancer
- Melanoma
- Non-Hodgkin Lymphoma
- Endometrial Cancer
- Kidney Cancer
- Leukemia
By Geographical Regions
- North America
- Europe
- Asia-Pacific
- Latin America
- Middle East and North Africa
Cancer Biomarkers Market: Key Segmentation Insights
HER2 Biomarkers Maintain A Strong Market Position
HER2 biomarkers represent a major established segment due to extensive clinical validation and their role in breast and gastric cancer management. HER2 testing is also closely associated with targeted therapies, supporting continued demand across diagnostic laboratories and oncology care settings. EGFR represents an important growth opportunity as precision treatment strategies expand in lung cancer and other relevant indications.
The broader biomarker landscape is also expanding beyond individual molecular targets. TMB, MSI, SNVs, CNVs and indels are increasingly relevant for understanding tumor biology and supporting personalized treatment strategies.
Breast Cancer Represents A Major Application Area
Breast cancer represents a major application area due to the established use of molecular biomarkers for diagnosis, prognosis, risk assessment and treatment selection. Lung cancer is another important application area because of the increasing relevance of molecular testing for targeted treatment selection.
Melanoma also presents opportunities for biomarker testing as targeted therapies and molecular diagnostics continue to develop. Biomarkers associated with BRAF and other molecular alterations can support treatment-selection strategies, while liquid biopsy approaches may expand the scope of molecular monitoring.
North America Leads The Cancer Biomarkers Market
North America represents the largest regional market, supported by advanced healthcare infrastructure, high adoption of precision medicine, established diagnostic networks, strong pharmaceutical R&D activity and increasing use of molecular oncology testing.
Europe represents another important market due to its established oncology research ecosystem and increasing integration of molecular diagnostics into cancer care. Asia-Pacific offers significant expansion opportunities as cancer diagnosis rates increase and healthcare systems invest in genomic testing, precision medicine and advanced laboratory infrastructure.
Latin America and the Middle East and Africa are also expected to present opportunities as access to cancer diagnostics improves and healthcare providers increasingly adopt advanced molecular testing technologies.
Example Players in Cancer Biomarkers Market
- ARUP Laboratories
- Asper Biogene
- BioReference
- Caris Life Sciences
- CeGaT
- Foundation Medicine
- Genekor Medical
- Guardant Health
- IQVIA Laborateries
- Labcorp
- MedGenome
- NeoGenomics Laboratories
- Nonacus
- OncoDNA
- Quest Diagnostics
- Oxford Gene Technology
- Personal Genome Diagnostics
- PhenoPath
- Positive Biosciences
- Tempus
- Thermo Fisher Scientific
- YuceBio
Expert Interview and Industry Insights
The market report includes transcripts of the following discussions:
- Chief Technical Officer and Former Director of Preclinical Development & Strategic Partnerships, Small Company, US
- Business Manager, Mid-sized Company, Germany
- Former Chief Scientific Officer, Large Company, US
Industry Experts on Cancer Biomarkers Market
The market report includes transcripts of the following other third-party discussions:
- Doctor of Medicine, Research Organization, US, North America
- Professor, Research University, UK, Europe
- Doctor of Medicine, Research Organization, US, North America
- Professor, Research University, US, North America
- Doctor of Medicine, Research Organization, US, North America
- Professor, Research University, US, North America
- Oncologist, Hospital, US, North America
- Professor, Research University, US, North America
- Lead of Cancer Genomics, Research University, Australia, Asia-Pacific
- Professor, Research University, US, North America
CANCER BIOMARKERS MARKET: RESEARCH COVERAGE
- Market Sizing and Opportunity Analysis: The report provides an in-depth assessment of the cancer biomarkers market, focusing on key segments including type of biomarker, type of cancer and geographical regions. The analysis provides market size forecasts, historical trends and opportunity assessment across major market segments.
- Competitive Landscape: Evaluation of leading companies operating across the cancer biomarkers ecosystem, including diagnostic laboratories, genomic testing companies, biotechnology firms and precision oncology providers.
- Company Profiles: In-depth profiles of prominent cancer biomarker companies covering company overview, product and service portfolio, biomarker capabilities, business activities and key strategic initiatives.
- Product Competitiveness Analysis: Comparative evaluation of cancer biomarker testing solutions offered by providers across North America, Europe, and Asia-Pacific, including assessment of peer groups and regional product portfolios.
- Company Profiles: Detailed profiles of leading cancer biomarker testing solution providers, including Agilent, ARUP Laboratories, Asper Biogene, BioReference, Caris Life Sciences, Foundation Medicine, Guardant Health, Labcorp, Quest Diagnostics, Tempus AI, Thermo Fisher Scientific, and other key players, with a focus on company overview and testing solution portfolios.
- Innovative Study Designs: Analysis of biomarker-based clinical trial designs, including enrichment, all-comers, mixture/hybrid, and adaptive designs, along with relevant regulatory guidelines.
- Clinical Trial Analysis: Comprehensive assessment of cancer biomarker clinical trials by registration year, trial status, phase, patient population, gender, study design, sponsor or collaborator, and geography, including analysis of leading industry and non-industry participants.
- Publication Analysis: Evaluation of cancer biomarker publications by publication year, publication type, cancer type, copyright holder, emerging focus areas, leading publishers, and key journals based on impact factor and publication volume.
- Big Pharma Benchmarking: Comparative benchmarking of major pharmaceutical companies based on their cancer biomarker activities and strategic positioning, supported by company-level spider web analysis.
- Value Chain Analysis: Case study assessing the companion diagnostics value chain, including cost distribution across research and product development, manufacturing and assembly, clinical trials and regulatory activities, payer negotiations, KOL engagement, marketing, and sales.
CANCER BIOMARKERS MARKET: KEY QUESTIONS ANSWERED
- What is the current market size of the global cancer biomarkers market?
- What will be the market size of cancer biomarkers by 2035?
- Which type of cancer biomarker currently represents the largest market opportunity?
- Which cancer types generate the greatest demand for biomarker testing?
- What are the major factors driving adoption of cancer biomarkers?
- What are the key challenges limiting biomarker development and commercialization?
- How are liquid biopsy and next-generation sequencing changing the biomarker landscape?
- What role will artificial intelligence play in cancer biomarker discovery and interpretation?
- How is the growing adoption of precision oncology influencing biomarker demand?
- What opportunities exist for companion diagnostic developers?
- Which regions represent significant growth opportunities for cancer biomarker companies?
- Who are the leading companies operating in the cancer biomarkers market?
- What strategic partnerships and collaborations are shaping the competitive landscape?
- What are the emerging opportunities across multi-omics, liquid biopsy, AI-powered diagnostics and real-world data?
- How is the competitive landscape expected to evolve through 2035?
WHY BUY THIS CANCER BIOMARKERS MARKET REPORT?
- This report provides stakeholders with a structured view of the evolving cancer biomarkers ecosystem and the commercial opportunities emerging across diagnostics, pharmaceutical R&D and precision oncology.
- The analysis can support market entry strategies, investment assessment, product portfolio planning, competitive benchmarking, partnership identification and regional expansion decisions.
- The report is particularly relevant for biomarker developers, diagnostic companies, pharmaceutical and biotechnology companies, clinical laboratories, companion diagnostic developers, sequencing technology providers, investors, contract research organizations and healthcare organizations seeking to assess current market opportunities and emerging technology trends.
- The report includes 336 pages of analysis, historical market trends, forecasts through 2035, more than 140 figures and 135+ market data tables, along with company profiles and industry insights.
ADDITIONAL BENEFITS
- Complementary PPT Insights Pack
- Complementary Excel Data Packs for all Analytical Modules in the Report
- 15% Free Content Customization
- Detailed Report Walkthrough Session with Research Team
- Free Updated Report if the Report is 6-12 Months Old or Older
TABLE OF CONTENTS
1. PREFACE
- 1.1. Introduction
- 1.2. Report Coverage
- 1.3. Market Segmentation
- 1.4. Key Market Insights
- 1.5. Market Share Insights
- 1.6. Key Questions Answered
2. RESEARCH METHODOLOGY
- 2.1. Chapter Overview
- 2.2. Research Assumptions
- 2.2.1. Market Landscape and Market Trends
- 2.2.2. Market Forecast and Opportunity Analysis
- 2.2.3. Comparative Analysis
- 2.3. Database Building
- 2.3.1. Data Collection
- 2.3.2. Data Validation
- 2.3.3. Data Analysis
- 2.4. Project Methodology
- 2.4.1. Secondary Research
- 2.4.1.1. Annual Reports
- 2.4.1.2. Academic Research Papers
- 2.4.1.3. Company Websites
- 2.4.1.4. Investor Presentations
- 2.4.1.5. Regulatory Filings
- 2.4.1.6. White Papers
- 2.4.1.7. Industry Publications
- 2.4.1.8. Conferences and Seminars
- 2.4.1.9. Government Portals
- 2.4.1.10. Media and Press Releases
- 2.4.1.11. Newsletters
- 2.4.1.12. Industry Databases
- 2.4.1.13. Roots Proprietary Databases
- 2.4.1.14. Paid Databases and Sources
- 2.4.1.15. Social Media Portals
- 2.4.1.16. Other Secondary Sources
- 2.4.2. Primary Research
- 2.4.2.1. Types of Primary Research
- 2.4.2.1.1. Qualitative Research
- 2.4.2.1.2. Quantitative Research
- 2.4.2.1.3. Hybrid Approach
- 2.4.2.2. Advantages of Primary
- 2.4.2.3. Techniques for Primary Research
- 2.4.2.3.1. Interviews
- 2.4.2.3.2. Surveys
- 2.4.2.3.3. Focus Groups
- 2.4.2.3.4. Observational Research
- 2.4.2.3.5. Social Media Interactions
- 2.4.2.4. Key Opinion Leaders Considered in Primary Research
- 2.4.2.4.1. Company Executives (CXOs)
- 2.4.2.4.2. Board of Directors
- 2.4.2.4.3. Company Presidents and Vice Presidents
- 2.4.2.4.4. Research and Development Heads
- 2.4.2.4.5. Technical Experts
- 2.4.2.4.6. Subject Matter Experts
- 2.4.2.4.7. Scientists
- 2.4.2.4.8. Doctors and Other Healthcare Providers
- 2.4.2.5. Ethics and Integrity
- 2.4.2.5.1. Research Ethics
- 2.4.2.5.2. Data Integrity
- 2.4.2.1. Types of Primary Research
- 2.4.3. Analytical Tools and Databases
- 2.4.1. Secondary Research
- 2.5. Robust Quality Control
3. ECONOMIC AND OTHER PROJECT-SPECIFIC CONSIDERATIONS
- 3.1. Chapter Overview
- 3.2. Forecast Methodology
- 3.2.1. Top-down Approach
- 3.2.2. Bottom-up Approach
- 3.2.3. Hybrid Approach
- 3.3. Market Assessment Framework
- 3.3.1. Total Addressable Market (TAM)
- 3.3.2. Serviceable Addressable Market (SAM)
- 3.3.3. Serviceable Obtainable Market (SOM)
- 3.3.4. Currently Acquired Market (CAM)
- 3.4. Forecasting Tools and Techniques
- 3.4.1. Qualitative Forecasting
- 3.4.2. Correlation
- 3.4.3. Regression
- 3.4.4. Extrapolation
- 3.4.5. Convergence
- 3.4.6. Sensitivity Analysis
- 3.4.7. Scenario Planning
- 3.4.8. Data Visualization
- 3.4.9. Time Series Analysis
- 3.4.10. Forecast Error Analysis
- 3.5. Key Considerations
- 3.5.1. Demographics
- 3.5.2. Government Regulations
- 3.5.3. Reimbursement Scenarios
- 3.5.4. Market Access
- 3.5.5. Supply Chain
- 3.5.6. Industry Consolidation
- 3.5.7. Pandemic / Unforeseen Disruptions Impact
- 3.6. Limitations
4. MACRO-ECONOMIC INDICATORS
- 4.1. Chapter Overview
- 4.2. Market Dynamics
- 4.2.1. Time Period
- 4.2.1.1. Historical Trends
- 4.2.1.2. Current and Forecasted Estimates
- 4.2.2. Currency Coverage
- 4.2.2.1. Major Currencies Affecting the Market
- 4.2.2.2. Factors Affecting Currency Fluctuations
- 4.2.2.3. Impact of Currency Fluctuations on the Industry
- 4.2.3. Foreign Currency Exchange Rate
- 4.2.3.1. Impact of Foreign Exchange Rate Volatility on the Market
- 4.2.3.2. Strategies for Mitigating Foreign Exchange Risk
- 4.2.4. Recession
- 4.2.4.1. Assessment of Current Economic Conditions and Potential Impact on the Market
- 4.2.4.2. Historical Analysis of Past Recessions and Lessons Learnt
- 4.2.5. Inflation
- 4.2.5.1. Measurement and Analysis of Inflationary Pressures in the Economy
- 4.2.5.2. Potential Impact of Inflation on the Market Evolution
- 4.2.6. Interest Rates
- 4.2.6.1. Interest Rates and Their Impact on the Market
- 4.2.6.2. Strategies for Managing Interest Rate Risk
- 4.2.7. Commodity Flow Analysis
- 4.2.7.1. Type of Commodity
- 4.2.7.2. Origins and Destinations
- 4.2.7.3. Value and Weights
- 4.2.7.4. Modes of Transportation
- 4.2.8. Global Trade Dynamics
- 4.2.8.1. Import Scenario
- 4.2.8.2. Export Scenario
- 4.2.8.3. Trade Policies
- 4.2.8.4. Strategies for Mitigating the Risks Associated with Trade Barriers
- 4.2.8.5. Impact of Trade Barriers on the Market
- 4.2.9. War Impact Analysis
- 4.2.9.1. Russian-Ukraine War
- 4.2.9.2. Israel-Hamas War
- 4.2.10. COVID Impact / Related Factors
- 4.2.10.1. Global Economic Impact
- 4.2.10.2. Industry-specific Impact
- 4.2.10.3. Government Response and Stimulus Measures
- 4.2.10.4. Future Outlook and Adaptation Strategies
- 4.2.11. Other Indicators
- 4.2.11.1. Fiscal Policy
- 4.2.11.2. Consumer Spending
- 4.2.11.3. Gross Domestic Product (GDP)
- 4.2.11.4. Employment
- 4.2.11.5. Taxes
- 4.2.11.6. Stock Market Performance
- 4.2.11.7. Cross-Border Dynamics
- 4.2.1. Time Period
- 4.3. Conclusion
5. EXECUTIVE SUMMARY
- 5.1. Cancer Biomarker Testing Solutions: Market Landscape
- 5.2. Cancer Biomarker Testing Solutions: Market Trends
- 5.3. Cancer Biomarker Testing Solutions: Market Forecast and Opportunity Analysis
6. INTRODUCTION
- 6.1. Chapter Overview
- 6.2. An Overview of Cancer Biomarkers
- 6.2.1. Need for Cancer Biomarkers
- 6.2.2. Identification of a Candidate Biomarker
- 6.3. Type of Cancer Biomarkers
- 6.4. Novel Cancer Biomarkers
- 6.4.1. Tumor Mutation Burden (TMB)
- 6.4.1.1. Variation of TMB across Multiple Indications
- 6.4.1.2. Methods for Measurement of TMB
- 6.4.1.3. Factors Affecting Measurement of TMB
- 6.4.1.4. Initiatives for Assessment of TMB as a Potential Biomarker
- 6.4.2. Microsatellite Instability / Mismatch Repair Deficiency (MSI / MMR)
- 6.4.2.1. Variation of MSI across Multiple Indications
- 6.4.2.2. Methods for Measurement of MSI
- 6.4.3. Single Nucleotide Variants (SNVs)
- 6.4.3.1. Variation of SNV across Multiple Indications
- 6.4.3.2. Methods for Measurement of SNV
- 6.4.4. Copy Number Variants (CNVs)
- 6.4.4.1. Variation of CNV across Multiple Cancer Indications
- 6.4.4.2. Methods for Measurement of CNV
- 6.4.5. Indels and Other Novel Biomarkers
- 6.4.1. Tumor Mutation Burden (TMB)
- 6.5. Future Perspective
7. MARKET LANDSCAPE
- 7.1. Chapter Overview
- 7.2. Cancer Biomarker Testing Solutions: Overall Market Landscape
- 7.2.1. Analysis by Type of Biomarker Evaluated
- 7.2.2. Analysis by Type of Analytical Technique Used
- 7.2.3. Analysis by Turnaround Time
- 7.2.4. Analysis by Type of Sample Supported
- 7.2.5. Analysis by Type of Nucleic Acid Tested
- 7.2.6. Analysis by Type of Cancer
- 7.2.7. Analysis by Application Area
- 7.2.8. Analysis by End-user
- 7.3. Cancer Biomarkers Testing Solutions: Provider Landscape
- 7.3.1. Analysis by Year of Establishment
- 7.3.2. Analysis by Company Size
- 7.3.3. Analysis by Location of Headquarters
- 7.3.4. Most Active Player: Analysis by Number of Testing Solutions Offered
8. PRODUCT COMPETITIVENESS ANALYSIS
- 8.1. Chapter Overview
- 8.2. Assumptions / Key Parameters
- 8.3. Methodology
- 8.4. Overview of Peer Groups
- 8.5. Cancer Biomarkers Testing Solutions: Product Competitiveness Analysis
- 8.5.1. Cancer Biomarker Testing Solutions Offered by Providers Headquartered in North America
- 8.5.2. Cancer Biomarker Testing Solutions Offered by Providers Headquartered in Europe
- 8.5.3. Cancer Biomarker Testing Solutions Offered by Providers Headquartered in Asia-Pacific
9. COMPANY PROFILES: CANCER BIOMARKERS TESTING SOLUTION PROVIDERS
- 9.1. Chapter Overview
- 9.2. Agilent
- 9.2.1. Company Overview
- 9.2.2. Cancer Biomarker Testing Solutions Portfolio
- 9.3. ARUP Laboratories
- 9.3.1. Company Overview
- 9.3.2. Cancer Biomarker Testing Solutions Portfolio
- 9.4. Asper Biogene
- 9.4.1. Company Overview
- 9.4.2. Cancer Biomarker Testing Solutions Portfolio
- 9.5. BioReference
- 9.5.1. Company Overview
- 9.5.2. Cancer Biomarker Testing Solutions Portfolio
- 9.6. Caris Life Sciences
- 9.6.1. Company Overview
- 9.6.2. Cancer Biomarker Testing Solutions Portfolio
- 9.7. CeGaT
- 9.7.1. Company Overview
- 9.7.2. Cancer Biomarker Testing Solutions Portfolio
- 9.8. Foundation Medicine
- 9.8.1. Company Overview
- 9.8.2. Cancer Biomarker Testing Solutions Portfolio
- 9.9. Genekor Medical
- 9.9.1. Company Overview
- 9.9.2. Cancer Biomarker Testing Solutions Portfolio
- 9.10. Guardant Health
- 9.10.1. Company Overview
- 9.10.2. Cancer Biomarker Testing Solutions Portfolio
- 9.11. IQVIA Laboratories
- 9.11.1. Company Overview
- 9.11.2. Cancer Biomarker Testing Solutions Portfolio
- 9.12. Labcorp
- 9.12.1. Company Overview
- 9.12.2. Cancer Biomarker Testing Solutions Portfolio
- 9.13. MedGenome
- 9.13.1. Company Overview
- 9.13.2. Cancer Biomarker Testing Solutions Portfolio
- 9.14. NeoGenomics Laboratories
- 9.14.1. Company Overview
- 9.14.2. Cancer Biomarker Testing Solutions Portfolio
- 9.15. Nonacus
- 9.15.1. Company Overview
- 9.15.2. Cancer Biomarker Testing Solutions Portfolio
- 9.16. OncoDNA
- 9.16.1. Company Overview
- 9.16.2. Cancer Biomarker Testing Solutions Portfolio
- 9.17. Quest Diagnostics
- 9.17.1. Company Overview
- 9.17.2. Cancer Biomarker Testing Solutions Portfolio
- 9.18. Oxford Gene Technology
- 9.18.1. Company Overview
- 9.18.2. Cancer Biomarker Testing Solutions Portfolio
- 9.19. Personal Genome Diagnostics
- 9.19.1. Company Overview
- 9.19.2. Cancer Biomarker Testing Solutions Portfolio
- 9.20. PhenoPath
- 9.20.1. Company Overview
- 9.20.2. Cancer Biomarker Testing Solutions Portfolio
- 9.21. Positive Biosciences
- 9.21.1. Company Overview
- 9.21.2. Cancer Biomarker Testing Solutions Portfolio
- 9.22. Tempus AI
- 9.22.1. Company Overview
- 9.22.2. Cancer Biomarker Testing Solutions Portfolio
- 9.23. Thermo Fisher Scientific
- 9.23.1. Company Overview
- 9.23.2. Cancer Biomarker Testing Solutions Portfolio
- 9.24. YuceBio
- 9.24.1. Company Overview
- 9.24.2. Cancer Biomarker Testing Solutions Portfolio
10. INNOVATIVE STUDY DESIGNS FOR BIOMARKER-BASED CLINICAL TRIALS
- 10.1. Chapter Overview
- 10.2. Study Designs for Biomarker-based Clinical Trials
- 10.2.1. Enrichment Design
- 10.2.2. All-comers Design
- 10.2.3. Mixture / Hybrid Design
- 10.2.4. Adaptive Design
- 10.3. Regulatory Guidelines for Biomarker-based Clinical Trial Designs
- 10.4. Conclusion
11. CLINICAL TRIAL ANALYSIS
- 11.1. Chapter Overview
- 11.2. Scope and Methodology
- 11.3. Cancer Biomarkers: Clinical Trial Analysis
- 11.3.1. Analysis by Trial Registration Year
- 11.3.2. Analysis of Patients Enrolled by Trial Registration Year
- 11.3.3. Analysis by Trial Status
- 11.3.4. Analysis by Trial Registration Year and Trial Status
- 11.3.5. Analysis by Trial Phase
- 11.3.6. Analysis of Enrolled Patient Population by Trial Phase
- 11.3.7. Analysis by Patient Gender
- 11.3.8. Analysis by Study Design
- 11.3.8.1. Analysis by Type of Allocation
- 11.3.8.2. Analysis by Type of Intervention Model
- 11.3.8.3. Analysis by Type of Masking
- 11.3.8.4. Analysis by Type of Primary Purpose
- 11.3.9. Analysis by Type of Sponsor / Collaborator
- 11.3.10. Most Active Industry Player: Analysis by Number of Registered Trials
- 11.3.11. Most Active Non-Industry Player: Analysis by Number of Registered Trials
- 11.3.12. Analysis of Clinical Trials by Geography
- 11.3.13. Analysis of Clinical Trials by Trial Status and Geography
- 11.3.14. Analysis of Patients Enrolled by Trial Status and Geography
12. PUBLICATION ANALYSIS
- 12.1. Chapter Overview
- 12.2. Scope and Methodology
- 12.3. Cancer Biomarkers: Publication Analysis
- 12.3.1. Analysis by Year of Publication
- 12.3.2. Analysis by Type of Publication
- 12.3.3. Analysis by Type of Cancer
- 12.3.4. Analysis by Copyright Holders
- 12.3.5. Word Cloud: Emerging Focus Areas
- 12.3.6. Most Active Publishers: Analysis by Number of Publications
- 12.3.7. Key Journals: Analysis by Impact Factor
- 12.3.8. Key Journals: Analysis by Number of Publications
13. BIG PHARMA PLAYERS: BENCHMARK ANALYSIS
- 13.1. Chapter Overview
- 13.2. Scope and Methodology
- 13.3. Big Pharma Players: Benchmarking Analysis
- 13.3.1. Spider Web Analysis: Abbott
- 13.3.2. Spider Web Analysis: AbbVie
- 13.3.3. Spider Web Analysis: Amgen
- 13.3.4. Spider Web Analysis: AstraZeneca
- 13.3.5. Spider Web Analysis: Bayer
- 13.3.6. Spider Web Analysis: Boehringer Ingelheim
- 13.3.7. Spider Web Analysis: Bristol-Myers Squib
- 13.3.8. Spider Web Analysis: Eli Lilly
- 13.3.9. Spider Web Analysis: Gilead
- 13.3.10. Spider Web Analysis: GlaxoSmithKline
- 13.3.11. Spider Web Analysis: Merck
- 13.3.12. Spider Web Analysis: Novartis
- 13.3.13. Spider Web Analysis: Pfizer
- 13.3.14. Spider Web Analysis: Roche
- 13.3.15. Spider Web Analysis: Sanofi
- 13.4. Concluding Remarks
14. CASE STUDY: ANALYSIS OF VALUE CHAIN IN THE COMPANION DIAGNOSTICS INDUSTRY
- 14.1. Chapter Overview
- 14.2. Companion Diagnostics: Value Chain
- 14.3. Cost Distribution Across the Value Chain
- 14.3.1. Costs Associated with Research and Product Development
- 14.3.2. Costs Associated with Manufacturing and Assembly
- 14.3.3. Costs Associated with Clinical Trials, FDA Approval and Other Administrative Tasks
- 14.3.4. Costs Associated with Payer Negotiation and KOL Engagement
- 14.3.5. Costs Associated with Marketing and Sales
15. CASE STUDY: FUTURE GROWTH OPPORTUNITIES IN CANCER BIOMARKERS INDUSTRY
- 15.1. Chapter Overview
- 15.1.1. Growing Focus on Personalized Medicines
- 15.1.2. Rising need for Biomarker Testing for Various Oncological Disorders
- 15.1.3. Increase in Number of Biomarker-based Clinical Trials
- 15.1.4. Increased Adoption of Emerging Analytical Techniques for Biomarker Assessment
- 15.1.5. Development of Companion Diagnostic Products
- 15.2. Conclusion
16. GLOBAL CANCER BIOMARKERS MARKET
- 16.1. Chapter Overview
- 16.2. Assumptions and Methodology
- 16.3. Global Cancer Biomarkers Market, Historical Trends (since 2021) and Forecasted Estimates (till 2035)
- 16.3.1. Scenario Analysis
- 16.3.1.1. Conservative Scenario
- 16.3.1.2. Optimistic Scenario
- 16.3.1. Scenario Analysis
- 16.4. Key Market Segmentations
17. CANCER BIOMARKERS MARKET, BY TYPE OF BIOMARKER
- 17.1. Chapter Overview
- 17.2. Key Assumptions and Methodology
- 17.3. Cancer Biomarkers Market: Distribution by Type of Biomarker
- 17.3.1. Cancer Biomarkers Market for HER2 Biomarkers: Historical Trends (since 2021) and Forecasted Estimates (till 2035)
- 17.3.2. Cancer Biomarkers Market for MET Biomarkers: Historical Trends (since 2021) and Forecasted Estimates (till 2035)
- 17.3.3. Cancer Biomarkers Market for EGFR Biomarkers: Historical Trends (since 2021) and Forecasted Estimates (till 2035)
- 17.3.4. Cancer Biomarkers Market for PD-L1 Biomarkers: Historical Trends (since 2021) and Forecasted Estimates (till 2035)
- 17.3.5. Cancer Biomarkers Market for NTRK Biomarkers: Historical Trends (since 2021) and Forecasted Estimates (till 2035)
- 17.3.6. Cancer Biomarkers Market for ALK Biomarkers: Historical Trends (since 2021) and Forecasted Estimates (till 2035)
- 17.3.7. Cancer Biomarkers Market for Other Biomarkers: Historical Trends (since 2021) and Forecasted Estimates (till 2035)
- 17.4. Cancer Biomarkers Market: Distribution of Novel Biomarkers
- 17.4.1. Cancer Biomarkers Market for SNV Biomarkers: Historical Trends (since 2021) and Forecasted Estimates (till 2035)
- 17.4.2. Cancer Biomarkers Market for MSI Biomarkers: Historical Trends (since 2021) and Forecasted Estimates (till 2035)
- 17.4.3. Cancer Biomarkers Market for CNV Biomarkers: Historical Trends (since 2021) and Forecasted Estimates (till 2035)
- 17.4.4. Cancer Biomarkers Market for TMB Biomarkers: Historical Trends (since 2021) and Forecasted Estimates (till 2035)
- 17.4.5. Cancer Biomarkers Market for TIL Biomarkers: Historical Trends (since 2021) and Forecasted Estimates (till 2035)
- 17.4.6. Cancer Biomarkers Market for Indel Biomarkers: Historical Trends (since 2021) and Forecasted Estimates (till 2035)
- 17.5. Data Triangulation and Validation
18. CANCER BIOMARKERS MARKET, BY TYPE OF CANCER
- 18.1. Chapter Overview
- 18.2. Key Assumptions and Methodology
- 18.3. Cancer Biomarkers Market: Distribution by Type of Cancer
- 18.3.1. Cancer Biomarkers Market for Breast Cancer: Historical Trends (since 2021) and Forecasted Estimates (till 2035)
- 18.3.2. Cancer Biomarkers Market for Colorectum Cancer: Historical Trends (since 2021) and Forecasted Estimates (till 2035)
- 18.3.3. Cancer Biomarkers Market for Lung Cancer: Historical Trends (since 2021) and Forecasted Estimates (till 2035)
- 18.3.4. Cancer Biomarkers Market for Prostate Cancer: Historical Trends (since 2021) and Forecasted Estimates (till 2035)
- 18.3.5. Cancer Biomarkers Market for Thyroid Cancer: Historical Trends (since 2021) and Forecasted Estimates (till 2035)
- 18.3.6. Cancer Biomarkers Market for Bladder Cancer: Historical Trends (since 2021) and Forecasted Estimates (till 2035)
- 18.3.7. Cancer Biomarkers Market for Melanoma: Historical Trends (since 2021) and Forecasted Estimates (till 2035)
- 18.3.8. Cancer Biomarkers Market for Non-Hodgkin Lymphoma: Historical Trends (since 2021) and Forecasted Estimates (till 2035)
- 18.3.9. Cancer Biomarkers Market for Endometrial Cancer: Historical Trends (since 2021) and Forecasted Estimates (till 2035)
- 18.3.10. Cancer Biomarkers Market for Kidney Cancer: Historical Trends (since 2021) and Forecasted Estimates (till 2035)
- 18.3.11. Cancer Biomarkers Market for Leukemia: Historical Trends (since 2021) and Forecasted Estimates (till 2035)
- 18.4. Data Triangulation and Validation
19. CANCER BIOMARKERS MARKET, BY GEOGRAPHICAL REGIONS
- 19.1. Chapter Overview
- 19.2. Key Assumptions and Methodology
- 19.3. Cancer Biomarkers Market: Distribution by Geographical Regions
- 19.3.1. Cancer Biomarkers Market in North America: Historical Trends (since 2021) and Forecasted Estimates (till 2035)
- 19.3.1.1. North America Cancer Biomarkers Market in the US: Historical Trends (since 2021) and Forecasted Estimates (till 2035)
- 19.3.1.2. North America Cancer Biomarkers Market in Canada: Historical Trends (since 2021) and Forecasted Estimates (till 2035)
- 19.3.2. Cancer Biomarkers Market in Europe: Historical Trends (since 2021) and Forecasted Estimates (till 2035)
- 19.3.2.1. Europe Cancer Biomarkers Market in Germany: Historical Trends (since 2021) and Forecasted Estimates (till 2035)
- 19.3.2.2. Europe Cancer Biomarkers Market in France: Historical Trends (since 2021) and Forecasted Estimates (till 2035)
- 19.3.2.3. Europe Cancer Biomarkers Market in the UK: Historical Trends (since 2021) and Forecasted Estimates (till 2035)
- 19.3.2.4. Europe Cancer Biomarkers Market in Italy: Historical Trends (since 2021) and Forecasted Estimates (till 2035)
- 19.3.2.5. Europe Cancer Biomarkers Market in Spain: Historical Trends (since 2021) and Forecasted Estimates (till 2035)
- 19.3.3. Cancer Biomarkers Market in Asia-Pacific: Historical Trends (since 2021) and Forecasted Estimates (till 2035)
- 19.3.3.1. Asia-Pacific Cancer Biomarkers Market in China: Historical Trends (since 2021) and Forecasted Estimates (till 2035)
- 19.3.3.2. Asia-Pacific Cancer Biomarkers Market in Japan: Historical Trends (since 2021) and Forecasted Estimates (till 2035)
- 19.3.3.3. Asia-Pacific Cancer Biomarkers Market in India: Historical Trends (since 2021) and Forecasted Estimates (till 2035)
- 19.3.3.4. Asia-Pacific Cancer Biomarkers Market in South Korea: Historical Trends (since 2021) and Forecasted Estimates (till 2035)
- 19.3.3.5. Asia-Pacific Cancer Biomarkers Market in Australia: Historical Trends (since 2021) and Forecasted Estimates (till 2035)
- 19.3.3.6. Asia-Pacific Cancer Biomarkers Market in New Zealand: Historical Trends (since 2021) and Forecasted Estimates (till 2035)
- 19.3.4. Cancer Biomarkers Market in Latin America: Historical Trends (since 2021) and Forecasted Estimates (till 2035)
- 19.3.4.1. Latin America Cancer Biomarkers Market in Brazil: Historical Trends (since 2021) and Forecasted Estimates (till 2035)
- 19.3.4.2. Latin America Cancer Biomarkers Market in Argentina: Historical Trends (since 2021) and Forecasted Estimates (till 2035)
- 19.3.4.3. Latin America Cancer Biomarkers Market in Chile: Historical Trends (since 2021) and Forecasted Estimates (till 2035)
- 19.3.5. Cancer Biomarkers Market in Middle East and North Africa: Historical Trends (since 2021) and Forecasted Estimates (till 2035)
- 19.3.5.1. Middle East and North Africa Cancer Biomarkers Market in Egypt: Historical Trends (since 2021) and Forecasted Estimates (till 2035)
- 19.3.1. Cancer Biomarkers Market in North America: Historical Trends (since 2021) and Forecasted Estimates (till 2035)
- 19.4. Market Dynamics Assessment
- 19.4.1. Penetration Growth (P-G) Matrix
- 19.4.2. Market Movement Analysis
- 19.5. Data Triangulation and Validation
- *Detailed information on cross sectional analysis is available in the Excel Data Packs shared along with the report**
20. CONCLUDING REMARKS
21. EXECUTIVE INSIGHTS
22. APPENDIX 1: TABULATED DATA
23. APPENDIX 2: LIST OF COMPANIES AND ORGANIZATIONS
List of Tables
- Table 6.1 List of Cancer Biomarker Testing Solution Providers
- Table 7.1 Cancer Biomarkers Testing Solutions: Information on Type of Biomarker Evaluated
- Table 7.2 Cancer Biomarkers Testing Solutions: Information on Analytical Technique Used
- Table 7.3 Cancer Biomarkers Testing Solutions: Information on Turnaround Time, Type of Sample Supported and Type of Nucleic Acid Tested
- Table 7.4 Cancer Biomarkers Testing Solutions: Information on Type of Cancer
- Table 7.5 Cancer Biomarkers Testing Solutions: Information on Application Area and End-user
- Table 9.1 Cancer Biomarkers Testing Solution Providers: List of Companies Profiled
- Table 9.2 Agilent: Company Overview
- Table 9.3 Agilent: Cancer Biomarkers Testing Solutions Portfolio
- Table 9.4 ARUP Laboratories: Company Overview
- Table 9.5 ARUP Laboratories: Cancer Biomarker Testing Solutions Portfolio
- Table 9.6 Asper Biogene: Company Overview
- Table 9.7 Asper Biogene: Cancer Biomarkers Testing Solutions Portfolio
- Table 9.8 BioReference: Company Overview
- Table 9.9 BioReference: Cancer Biomarker Testing Solutions Portfolio
- Table 9.10 Caris Life Sciences: Company Overview
- Table 9.11 Caris Life Sciences: Cancer Biomarkers Testing Solutions Portfolio
- Table 9.12 CeGaT: Company Overview
- Table 9.13 CeGaT: Cancer Biomarkers Testing Solutions Portfolio
- Table 9.14 Foundation Medicine: Company Overview
- Table 9.15 Foundation Medicine: Cancer Biomarker Testing Solutions Portfolio
- Table 9.16 Genekor Medical: Company Overview
- Table 9.17 Genekor Medical: Cancer Biomarkers Testing Solutions Portfolio
- Table 9.18 Guardant Health: Company Overview
- Table 9.19 Guardant Health: Cancer Biomarkers Testing Solutions Portfolio
- Table 9.20 IQVIA Laboratories: Company Overview
- Table 9.21 IQVIA Laboratories: Cancer Biomarkers Testing Solutions Portfolio
- Table 9.22 Labcorp: Company Overview
- Table 9.23 Labcorp: Cancer Biomarkers Testing Solutions Portfolio
- Table 9.24 MedGenome: Company Overview
- Table 9.25 MedGenome: Cancer Biomarkers Testing Solutions Portfolio
- Table 9.26 NeoGenomics Laboratories: Company Overview
- Table 9.27 NeoGenomics Laboratories: Cancer Biomarkers Testing Solutions Portfolio
- Table 9.28 Nonacus: Company Overview
- Table 9.29 Nonacus: Cancer Biomarkers Testing Solutions Portfolio
- Table 9.30 OncoDNA: Company Overview
- Table 9.31 OncoDNA: Cancer Biomarker Testing Solutions Portfolio
- Table 9.32 Quest Diagnostics: Company Overview
- Table 9.33 Quest Diagnostics: Cancer Biomarker Testing Solutions Portfolio
- Table 9.34 Oxford Gene Technology: Company Overview
- Table 9.35 Oxford Gene Technology: Cancer Biomarkers Testing Solutions Portfolio
- Table 9.36 Personal Genome Diagnostics: Company Overview
- Table 9.37 Personal Genome Diagnostics: Cancer Biomarkers Testing Solutions Portfolio
- Table 9.38 PhenoPath: Company Overview
- Table 9.39 PhenoPath: Cancer Biomarkers Testing Solutions Portfolio
- Table 9.40 Positive Biosciences: Company Overview
- Table 9.41 Positive Biosciences: Cancer Biomarkers Testing Solutions Portfolio
- Table 9.42 Tempus AI: Company Overview
- Table 9.43 Tempus AI: Cancer Biomarkers Testing Solutions Portfolio
- Table 9.44 Thermo Fisher Scientific: Company Overview
- Table 9.45 Thermo Fisher Scientific: Cancer Biomarker Testing Solutions Portfolio
- Table 9.46 YuceBio: Company Overview
- Table 9.47 YuceBio: Cancer Biomarker Testing Solutions Portfolio
- Table 21.1 Cell IDx: Company Snapshot
- Table 21.2 NeoGenomics Laboratories: Company Snapshot
- Table 21.3 CeGat: Company Snapshot
- Table 22.1 Cancer Biomarker Testing Solutions: Distribution by Type of Biomarker Evaluated
- Table 22.2 Cancer Biomarker Testing Solutions: Distribution by Analytical Technique Used
- Table 22.3 Cancer Biomarker Testing Solutions: Distribution by Turnaround Time
- Table 22.4 Cancer Biomarker Testing Solutions: Distribution by Type of Sample Supported
- Table 22.5 Cancer Biomarker Testing Solutions: Distribution by Type of Nucleic Acid Tested
- Table 22.6 Cancer Biomarker Testing Solutions: Distribution by Type of Cancer
- Table 22.7 Cancer Biomarker Testing Solutions: Distribution by Application Area
- Table 22.8 Cancer Biomarker Testing Solutions: Distribution by End-user
- Table 22.9 Cancer Biomarker Testing Solution Providers: Distribution by Year of Establishment
- Table 22.10 Cancer Biomarker Testing Solution Providers: Distribution by Company Size
- Table 22.11 Cancer Biomarker Testing Solution Providers: Distribution by Location of Headquarters (Region)
- Table 22.12 Cancer Biomarker Testing Solution Providers: Distribution by Most Active Players
- Table 22.13 Clinical Trial Analysis: Distribution by Trial Registration Year, 2022-2025
- Table 22.14 Clinical Trial Analysis: Distribution of Patients Enrolled by Trial Registration Year, 2022-2025
- Table 22.15 Clinical Trial Analysis: Distribution by Trial Status
- Table 22.16 Clinical Trial Analysis: Distribution by Trial Registration Year and Trial Status
- Table 22.17 Clinical Trial Analysis: Distribution by Trial Phase
- Table 22.18 Clinical Trial Analysis: Distribution of Enrolled Patient Population by Trial Phase
- Table 22.19 Clinical Trial Analysis: Distribution by Patient Gender
- Table 22.20 Clinical Trial Analysis: Distribution by Study Design
- Table 22.21 Clinical Trial Analysis: Distribution by Type of Sponsor / Collaborator
- Table 22.22 Most Active Industry Players: Distribution by Number of Registered Trials
- Table 22.23 Most Active Non-Industry Players: Distribution by Number of Registered Trials
- Table 22.24 Clinical Trial Analysis: Distribution of Clinical Trials by Geography
- Table 22.25 Clinical Trial Analysis: Distribution of Clinical Trials by Trial Status and Geography
- Table 22.26 Clinical Trial Analysis: Distribution of Patients Enrolled by Trial Status and Geography
- Table 22.27 Publication Analysis: Cumulative Year-wise Trend of Publications, 2019-2023
- Table 22.28 Publication Analysis: Distribution by Type of Publication
- Table 22.29 Publication Analysis: Distribution by Type of Cancer
- Table 22.30 Copyright Holders: Distribution by Number of Publications
- Table 22.31 Most Active Publishers: Distribution by Number of Publications
- Table 22.32 Key Journals: Distribution by Impact Factor
- Table 22.33 Key Journals: Distribution by Number of Publications
- Table 22.34 Benchmarking Analysis: Big Pharma players
- Table 22.35 Global Cancer Biomarkers Market: Since 2021, Till 2035 (USD Billion) Conservative, Base and Optimistic
- Table 22.36 Cancer Biomarkers Market: Distribution by Type of Biomarker
- Table 22.37 Cancer Biomarkers Market for HER2 Biomarkers: Historical Trends (since 2021) and Forecasted Estimates (till 2035)
- Table 22.38 Cancer Biomarkers Market for MET Biomarkers: Historical Trends (since 2021) and Forecasted Estimates (till 2035)
- Table 22.39 Cancer Biomarkers Market for EGFR Biomarkers: Historical Trends (since 2021) and Forecasted Estimates (till 2035)
- Table 22.40 Cancer Biomarkers Market for PD-L1 Biomarkers: Historical Trends (since 2021) and Forecasted Estimates (till 2035)
- Table 22.41 Cancer Biomarkers Market for NTRK Biomarkers: Historical Trends (since 2021) and Forecasted Estimates (till 2035)
- Table 22.42 Cancer Biomarkers Market for ALK Biomarkers: Historical Trends (since 2021) and Forecasted Estimates (till 2035)
- Table 22.43 Cancer Biomarkers Market for Other Biomarkers: Historical Trends (since 2021) and Forecasted Estimates (till 2035)
- Table 22.44 Cancer Biomarkers Market: Distribution of Novel Biomarker
- Table 22.45 Cancer Biomarkers Market for SNV Biomarkers: Historical Trends (since 2021) and Forecasted Estimates (till 2035)
- Table 22.46 Cancer Biomarkers Market for CNV Biomarkers: Historical Trends (since 2021) and Forecasted Estimates (till 2035)
- Table 22.47 Cancer Biomarkers Market for Indel Biomarkers: Historical Trends (since 2021) and Forecasted Estimates (till 2035)
- Table 22.48 Cancer Biomarkers Market for TIL Biomarkers: Historical Trends (since 2021) and Forecasted Estimates (till 2035)
- Table 22.49 Cancer Biomarkers Market for MSI Biomarkers: Historical Trends (since 2021) and Forecasted Estimates (till 2035)
- Table 22.50 Cancer Biomarkers Market for TMB Biomarkers: Historical Trends (since 2021) and Forecasted Estimates (till 2035)
- Table 22.51 Cancer Biomarkers Market: Distribution by Type of Cancer
- Table 22.52 Cancer Biomarkers Market for Breast Cancer: Historical Trends (since 2021) and Forecasted Estimates (till 2035)
- Table 22.53 Cancer Biomarkers Market for Colorectum Cancer: Historical Trends (since 2021) and Forecasted Estimates (till 2035)
- Table 22.54 Cancer Biomarkers Market for Lung Cancer: Historical Trends (since 2021) and Forecasted Estimates (till 2035)
- Table 22.55 Cancer Biomarkers Market for Prostate Cancer: Historical Trends (since 2021) and Forecasted Estimates (till 2035)
- Table 22.56 Cancer Biomarkers Market for Thyroid Cancer: Historical Trends (since 2021) and Forecasted Estimates (till 2035)
- Table 22.57 Cancer Biomarkers Market for Bladder Cancer: Historical Trends (since 2021) and Forecasted Estimates (till 2035)
- Table 22.58 Cancer Biomarkers Market for Melanoma: Historical Trends (since 2021) and Forecasted Estimates (till 2035)
- Table 22.59 Cancer Biomarkers Market for Non-Hodgkin Lymphoma: Historical Trends (since 2021) and Forecasted Estimates (till 2035)
- Table 22.60 Cancer Biomarkers Market for Endometrial Cancer: Historical Trends (since 2021) and Forecasted Estimates (till 2035)
- Table 22.61 Cancer Biomarkers Market for Kidney Cancer: Historical Trends (since 2021) and Forecasted Estimates (till 2035)
- Table 22.62 Cancer Biomarkers Market for Leukemia: Historical Trends (since 2021) and Forecasted Estimates (till 2035)
- Table 22.63 Cancer Biomarkers Market: Distribution by Key Geographical Regions
- Table 22.64 Cancer Biomarkers Market in North America: Historical Trends (since 2021) and Forecasted Estimates (till 2035)
- Table 22.65 North America Cancer Biomarkers Market in the US: Historical Trends (since 2021) and Forecasted Estimates (till 2035)
- Table 22.66 North America Cancer Biomarkers Market in Canada: Historical Trends (since 2021) and Forecasted Estimates (till 2035)
- Table 22.67 Cancer Biomarkers Market in Europe: Historical Trends (since 2021) and Forecasted Estimates (till 2035)
- Table 22.68 Europe Cancer Biomarkers Market in Germany: Historical Trends (since 2021) and Forecasted Estimates (till 2035)
- Table 22.69 Europe Cancer Biomarkers Market in France: Historical Trends (since 2021) and Forecasted Estimates (till 2035)
- Table 22.70 Europe Cancer Biomarkers Market in the UK: Historical Trends (since 2021) and Forecasted Estimates (till 2035)
- Table 22.71 Europe Cancer Biomarkers Market in Italy: Historical Trends (since 2021) and Forecasted Estimates (till 2035)
- Table 22.72 Europe Cancer Biomarkers Market in Spain: Historical Trends (since 2021) and Forecasted Estimates (till 2035)
- Table 22.73 Cancer Biomarkers Market in Asia-Pacific: Historical Trends (since 2021) and Forecasted Estimates (till 2035)
- Table 22.74 Asia-Pacific Cancer Biomarkers Market in China: Historical Trends (since 2021) and Forecasted Estimates (till 2035)
- Table 22.75 Asia-Pacific Cancer Biomarkers Market in Japan: Historical Trends (since 2021) and Forecasted Estimates (till 2035)
- Table 22.76 Asia-Pacific Cancer Biomarkers Market in India: Historical Trends (since 2021) and Forecasted Estimates (till 2035)
- Table 22.77 Asia-Pacific Cancer Biomarkers Market in South Korea: Historical Trends (since 2021) and Forecasted Estimates (till 2035)
- Table 22.78 Asia-Pacific Cancer Biomarkers Market in Australia: Historical Trends (since 2021) and Forecasted Estimates (till 2035)
- Table 22.79 Asia-Pacific Cancer Biomarkers Market in New Zealand: Historical Trends (since 2021) and Forecasted Estimates (till 2035)
- Table 22.80 Cancer Biomarkers Market in Latin America: Historical Trends (since 2021) and Forecasted Estimates (till 2035)
- Table 22.81 Latin America Cancer Biomarkers Market in Brazil: Historical Trends (since 2021) and Forecasted Estimates (till 2035)
- Table 22.82 Latin America Cancer Biomarkers Market in Argentina: Historical Trends (since 2021) and Forecasted Estimates (till 2035)
- Table 22.83 Latin America Cancer Biomarkers Market in Chile: Historical Trends (since 2021) and Forecasted Estimates (till 2035)
- Table 22.84 Cancer Biomarkers Market in Middle East and North Africa: Historical Trends (since 2021) and Forecasted Estimates (till 2035)
- Table 22.85 Middle East and North Africa Cancer Biomarkers Market in Egypt: Historical Trends (since 2021) and Forecasted Estimates (till 2035)
List of Figures
- Figure 2.1 Research Methodology: Project Methodology
- Figure 2.2 Research Methodology: Data Sources for Secondary Research
- Figure 2.3 Research Methodology: Robust Quality Control
- Figure 3.1 Market Dynamics: Forecast Methodology
- Figure 3.2 Market Dynamics: Market Assessment Framework
- Figure 4.1 Lessons Learnt from Past Recessions
- Figure 5.1 Executive Summary: Overall Market Landscape
- Figure 5.2 Executive Summary: Market Trends
- Figure 5.3 Executive Summary: Market Forecast and Opportunity Analysis
- Figure 7.1 Cancer Biomarker Testing Solutions: Distribution by Type of Biomarker Evaluated
- Figure 7.2 Cancer Biomarker Testing Solutions: Distribution by Analytical Technique Used
- Figure 7.3 Cancer Biomarker Testing Solutions: Distribution by Turnaround Time
- Figure 7.4 Cancer Biomarker Testing Solutions: Distribution by Type of Sample Supported
- Figure 7.5 Cancer Biomarker Testing Solutions: Distribution by Type of Nucleic Acid Tested
- Figure 7.6 Cancer Biomarker Testing Solutions: Distribution by Type of Cancer
- Figure 7.7 Cancer Biomarker Testing Solutions: Distribution by Application Area
- Figure 7.8 Cancer Biomarker Testing Solutions: Distribution by End-user
- Figure 7.9 Cancer Biomarker Testing Solution Providers: Distribution by Year of Establishment
- Figure 7.10 Cancer Biomarker Testing Solution Providers: Distribution by Company Size
- Figure 7.11 Cancer Biomarker Testing Solution Providers: Distribution by Location of Headquarters (Region)
- Figure 7.12 Most Active Players: Distribution by Number of Testing Solutions Offered
- Figure 8.1 Product Competitiveness Analysis: Overview of Peer Group I
- Figure 8.2 Product Competitiveness Analysis: Overview of Peer Group II
- Figure 8.3 Product Competitiveness Analysis: Overview of Peer Group III
- Figure 8.4 Product Competitiveness Analysis: Cancer Biomarkers Testing Solution Offered by Providers Headquartered in North America (Peer Group I)
- Figure 8.5 Product Competitiveness Analysis: Cancer Biomarkers Testing Solution Offered by Providers Headquartered in Europe (Peer Group II)
- Figure 8.6 Product Competitiveness Analysis: Cancer Biomarkers Testing Solution Offered by Providers Headquartered in Asia-Pacific (Peer Group III)
- Figure 10.1 Enrichment Clinical Trial Design: Steps Involved
- Figure 10.2 All-Comers Clinical Trial Design: Steps Involved
- Figure 10.3 Hybrid Clinical Trial Design: Steps Involved
- Figure 10.4 Adaptive Clinical Trial Design: Steps Involved
- Figure 11.1 Clinical Trial Analysis: Distribution by Trial Registration Year, 2022-2025
- Figure 11.2 Clinical Trial Analysis: Distribution of Patients Enrolled by Trial Registration Year, 2022-2025
- Figure 11.3 Clinical Trial Analysis: Distribution by Trial Status
- Figure 11.4 Clinical Trial Analysis: Distribution by Trial Registration Year and Trial Status
- Figure 11.5 Clinical Trial Analysis: Distribution by Trial Phase
- Figure 11.6 Clinical Trial Analysis: Distribution of Enrolled Patient Population by Trial Phase
- Figure 11.7 Clinical Trial Analysis: Distribution by Patient Gender
- Figure 11.8 Clinical Trial Analysis: Distribution by Type of Allocation
- Figure 11.9 Clinical Trial Analysis: Distribution by Type of Intervention Model
- Figure 11.10 Clinical Trial Analysis: Distribution by Type of Masking
- Figure 11.11 Clinical Trial Analysis: Distribution by Type of Primary Purpose
- Figure 11.12 Clinical Trial Analysis: Distribution by Type of Sponsor / Collaborator
- Figure 11.13 Most Active Industry Players: Distribution by Number of Registered Trials
- Figure 11.14 Most Active Non-Industry Players: Distribution by Number of Registered Trials
- Figure 11.15 Clinical Trial Analysis: Distribution of Clinical Trials by Geography
- Figure 11.16 Clinical Trial Analysis: Distribution of Clinical Trials by Trial Status and Geography
- Figure 11.17 Clinical Trial Analysis: Distribution of Patients Enrolled by Trial Status and Geography
- Figure 12.1 Publication Analysis: Cumulative Year-wise Trend of Publications, 2019-2023
- Figure 12.2 Publication Analysis: Distribution by Type of Publication
- Figure 12.3 Publication Analysis: Distribution by Type of Cancer
- Figure 12.4 Most Popular Copyright Holders: Distribution by Number of Publications
- Figure 12.5 Word Cloud Analysis: Emerging Focus Areas
- Figure 12.6 Most Active Publishers: Distribution by Number of Publications
- Figure 12.7 Key Journals: Distribution by Impact Factor
- Figure 12.8 Key Journals: Distribution by Number of Publications
- Figure 13.1 Spider Web Analysis: Abbott
- Figure 13.2 Spider Web Analysis: AbbVie
- Figure 13.3 Spider Web Analysis: Amgen
- Figure 13.4 Spider Web Analysis: AstraZeneca
- Figure 13.5 Spider Web Analysis: Bayer
- Figure 13.6 Spider Web Analysis: Boehringer Ingelheim
- Figure 13.7 Spider Web Analysis: Bristol-Myers Squib
- Figure 13.8 Spider Web Analysis: Eli Lilly
- Figure 13.9 Spider Web Analysis: Gilead
- Figure 13.10 Spider Web Analysis: GlaxoSmithKline
- Figure 13.11 Spider Web Analysis: Merck
- Figure 13.12 Spider Web Analysis: Novartis
- Figure 13.13 Spider Web Analysis: Pfizer
- Figure 13.14 Spider Web Analysis: Roche
- Figure 13.15 Spider Web Analysis: Sanofi
- Figure 13.16 Benchmarking Analysis: Big Pharma players
- Figure 14.1 Companion Diagnostics: Value Chain
- Figure 14.2 Companion Diagnostics: Cost Distribution Across Value Chain
- Figure 14.3 Costs Associated with Research and Product Development
- Figure 14.4 Costs Associated with Manufacturing and Assembly
- Figure 14.5 Costs Associated with Clinical Trials, FDA Approval and Other Administrative Tasks
- Figure 14.6 Costs Associated with Payer Negotiation and KOL Engagement
- Figure 14.7 Costs Associated with Marketing and Sales
- Figure 15.1 Cancer Biomarkers Market: Future Growth Opportunities
- Figure 16.1 Global Cancer Biomarkers Market: Historical Trends (since 2021) and Forecasted Estimates (till 2035)
- Figure 16.2 Global Cancer Biomarkers Market: Forecasted Estimates (till 2035): Conservative Scenario (USD Billion)
- Figure 16.3 Global Cancer Biomarkers Market: Forecasted Estimates (till 2035): Optimistic Scenario (USD Billion)
- Figure 17.1 Cancer Biomarkers Market: Distribution by Type of Biomarker
- Figure 17.2 Cancer Biomarkers Market for HER2 Biomarkers: Historical Trends (since 2021) and Forecasted Estimates (till 2035)
- Figure 17.3 Cancer Biomarkers Market for MET Biomarkers: Historical Trends (since 2021) and Forecasted Estimates (till 2035)
- Figure 17.4 Cancer Biomarkers Market for EGFR Biomarkers: Historical Trends (since 2021) and Forecasted Estimates (till 2035)
- Figure 17.5 Cancer Biomarkers Market for PD-L1 Biomarkers: Historical Trends (since 2021) and Forecasted Estimates (till 2035)
- Figure 17.6 Cancer Biomarkers Market for NTRK Biomarkers: Historical Trends (since 2021) and Forecasted Estimates (till 2035)
- Figure 17.7 Cancer Biomarkers Market for ALK Biomarkers: Historical Trends (since 2021) and Forecasted Estimates (till 2035)
- Figure 17.8 Cancer Biomarkers Market for Other Biomarkers: Historical Trends (since 2021) and Forecasted Estimates (till 2035)
- Figure 17.9 Cancer Biomarkers Market: Distribution of Novel Biomarkers
- Figure 17.10 Cancer Biomarkers Market for SNV Biomarkers: Historical Trends (since 2021) and Forecasted Estimates (till 2035)
- Figure 17.11 Cancer Biomarkers Market for CNV Biomarkers: Historical Trends (since 2021) and Forecasted Estimates (till 2035)
- Figure 17.12 Cancer Biomarkers Market for Indel Biomarkers: Historical Trends (since 2021) and Forecasted Estimates (till 2035)
- Figure 17.13 Cancer Biomarkers Market for TIL Biomarkers: Historical Trends (since 2021) and Forecasted Estimates (till 2035)
- Figure 17.14 Cancer Biomarkers Market for MSI Biomarkers: Historical Trends (since 2021) and Forecasted Estimates (till 2035)
- Figure 17.15 Cancer Biomarkers Market for TMB Biomarkers: Historical Trends (since 2021) and Forecasted Estimates (till 2035)
- Figure 18.1 Cancer Biomarkers Market: Distribution by Type of Cancer
- Figure 18.2 Cancer Biomarkers Market for Breast Cancer: Historical Trends (since 2021) and Forecasted Estimates (till 2035)
- Figure 18.3 Cancer Biomarkers Market for Colorectum Cancer: Historical Trends (since 2021) and Forecasted Estimates (till 2035)
- Figure 18.4 Cancer Biomarkers Market for Lung Cancer: Historical Trends (since 2021) and Forecasted Estimates (till 2035)
- Figure 18.5 Cancer Biomarkers Market for Prostate Cancer: Historical Trends (since 2021) and Forecasted Estimates (till 2035)
- Figure 18.6 Cancer Biomarkers Market for Thyroid Cancer: Historical Trends (since 2021) and Forecasted Estimates (till 2035)
- Figure 18.7 Cancer Biomarkers Market for Bladder Cancer: Historical Trends (since 2021) and Forecasted Estimates (till 2035)
- Figure 18.8 Cancer Biomarkers Market for Melanoma: Historical Trends (since 2021) and Forecasted Estimates (till 2035)
- Figure 18.9 Cancer Biomarkers Market for Non-Hodgkin Lymphoma: Historical Trends (since 2021) and Forecasted Estimates (till 2035)
- Figure 18.10 Cancer Biomarkers Market for Endometrial Cancer: Historical Trends (since 2021) and Forecasted Estimates (till 2035)
- Figure 18.11 Cancer Biomarkers Market for Kidney Cancer: Historical Trends (since 2021) and Forecasted Estimates (till 2035)
- Figure 18.12 Cancer Biomarkers Market for Leukemia: Historical Trends (since 2021) and Forecasted Estimates (till 2035)
- Figure 19.1 Cancer Biomarkers Market: Distribution by Key Geographical Regions
- Figure 19.2 Cancer Biomarkers Market in North America: Historical Trends (since 2021) and Forecasted Estimates (till 2035)
- Figure 19.3 Cancer Biomarkers Market in the US: Historical Trends (since 2021) and Forecasted Estimates (till 2035)
- Figure 19.4 Cancer Biomarkers Market in Canada: Historical Trends (since 2021) and Forecasted Estimates (till 2035)
- Figure 19.5 Cancer Biomarkers Market in Europe: Historical Trends (since 2021) and Forecasted Estimates (till 2035)
- Figure 19.6 Cancer Biomarkers Market in Germany: Historical Trends (since 2021) and Forecasted Estimates (till 2035)
- Figure 19.7 Cancer Biomarkers Market in France: Historical Trends (since 2021) and Forecasted Estimates (till 2035)
- Figure 19.8 Cancer Biomarkers Market in the UK: Historical Trends (since 2021) and Forecasted Estimates (till 2035)
- Figure 19.9 Cancer Biomarkers Market in Italy: Historical Trends (since 2021) and Forecasted Estimates (till 2035)
- Figure 19.10 Cancer Biomarkers Market in Spain: Historical Trends (since 2021) and Forecasted Estimates (till 2035)
- Figure 19.11 Cancer Biomarkers Market in Asia-Pacific: Historical Trends (since 2021) and Forecasted Estimates (till 2035)
- Figure 19.12 Cancer Biomarkers Market in China: Historical Trends (since 2021) and Forecasted Estimates (till 2035)
- Figure 19.13 Cancer Biomarkers Market in Japan: Historical Trends (since 2021) and Forecasted Estimates (till 2035)
- Figure 19.14 Cancer Biomarkers Market in India: Historical Trends (since 2021) and Forecasted Estimates (till 2035)
- Figure 19.15 Cancer Biomarkers Market in South Korea: Historical Trends (since 2021) and Forecasted Estimates (till 2035)
- Figure 19.16 Cancer Biomarkers Market in Australia: Historical Trends (since 2021) and Forecasted Estimates (till 2035)
- Figure 19.17 Cancer Biomarkers Market in New Zealand: Historical Trends (since 2021) and Forecasted Estimates (till 2035)
- Figure 19.18 Cancer Biomarkers Market in Latin America: Historical Trends (since 2021) and Forecasted Estimates (till 2035)
- Figure 19.19 Cancer Biomarkers Market in Brazil: Historical Trends (since 2021) and Forecasted Estimates (till 2035)
- Figure 19.20 Cancer Biomarkers Market in Argentina: Historical Trends (since 2021) and Forecasted Estimates (till 2035)
- Figure 19.21 Cancer Biomarkers Market in Chile: Historical Trends (since 2021) and Forecasted Estimates (till 2035)
- Figure 19.22 Cancer Biomarkers Market in Middle East and North Africa: Historical Trends (since 2021) and Forecasted Estimates (till 2035)
- Figure 19.23 Cancer Biomarkers Market in Egypt: Historical Trends (since 2021) and Forecasted Estimates (till 2035)
- Figure 19.24 Market Movement Analysis: Geographical Regions
- Figure 19.25 Penetration-Growth (P-G) Matrix: Geographical Regions
- Figure 20.1 Concluding Remarks: Market Landscape
- Figure 20.2 Concluding Remarks: Clinical Trial Analysis
- Figure 20.3 Concluding Remarks: Publication Analysis
- Figure 20.4 Concluding Remarks: Market Forecast and Opportunity Analysis

