PUBLISHER: Roots Analysis | PRODUCT CODE: 2161896

PUBLISHER: Roots Analysis | PRODUCT CODE: 2161896
Global Digital Twins in Healthcare Market - Trends and Forecast, Till 2035
GLOBAL DIGITAL TWINS IN HEALTHCARE MARKET OVERVIEW
As per Roots Analysis, the global digital twins in healthcare market is estimated to grow from USD 3.4 billion in 2026 to USD 33.4 billion by 2035, representing a CAGR of 28.8% during the forecast period.
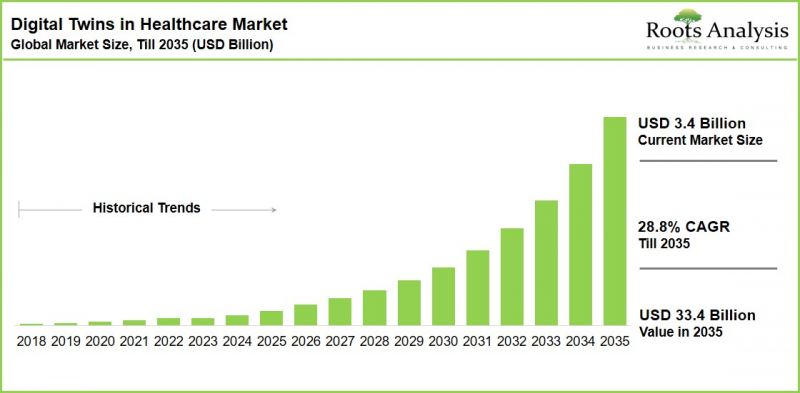
Digital Twins in Healthcare Market: Growth and Trends
Digital twins are virtual representations of physical objects, systems, or processes created using real-time data and simulation models. In healthcare, these technologies are being used to support clinical trials, simulate patient populations, optimize treatment strategies, and improve efficiency in drug development. The growing adoption of Industry 4.0 technologies is further supporting the integration of digital twins across healthcare workflows, physical assets, and patient models.
Healthcare organizations are increasingly recognizing the value of digital twins for improving collaboration, decision-making, and operational efficiency. Adoption is expanding among organizations with existing IoT initiatives, while several others are evaluating or implementing digital twin platforms across their processes. Emerging applications also include drug safety, with researchers developing virtual simulation and machine learning models to assess cardiotoxicity risk and support more efficient drug development.
Investment activity in healthcare digital twins has also increased significantly, supported by growing interest from technology companies, investors, and healthcare stakeholders. Funding has been directed toward companies developing digital twin platforms and healthcare-specific applications. For example, Leucine raised a USD 7 million funding round led by Ecolab and Pravega Ventures, highlighting continued investor interest in digital solutions for biopharmaceutical manufacturing.
Partnership activity is further expanding the digital twin ecosystem, particularly through technology integration and development agreements. These collaborations are helping healthcare and technology companies combine simulation platforms, artificial intelligence, and clinical data to develop new applications. Blackford's agreement with Nurea, which integrated Nurea's PRAEVAorta 2 solution with the Blackford AI platform for cardiovascular surgical planning, reflects the growing focus on technology integration within healthcare digital twin applications.
Growth Drivers for the Digital Twins in Healthcare Market
The global digital twins in healthcare market is expanding as Industry 4.0 technologies enable real-time data integration and virtual replication of healthcare assets, processes, and patient models. Growing pharmaceutical investment is strengthening adoption, while digital twins help accelerate clinical trials through virtual simulations and larger patient cohorts. Their applications in predictive maintenance, process simulation, and real-time monitoring are further increasing demand among pharmaceutical companies. Rising interest in personalized medicine is also creating new use cases across treatment planning and drug development. In addition, large-scale institutional and government initiatives are supporting technology validation and market expansion.
Market Challenges: Factors Impeding the Market Expansion
Despite strong growth prospects, the digital twins in healthcare market faces several adoption barriers. The fragmented and early-stage competitive landscape reflects limited standardization across solutions and applications. Data integration and interoperability challenges can make it difficult to connect real-time information from diverse healthcare systems and devices. High implementation costs for data infrastructure, simulation models, and specialized talent may further limit adoption. Regulatory uncertainty around the validation and clinical use of digital twin outputs also creates challenges for patient-facing applications.
Digital Twins in Healthcare Market: Key Insights
- The digital twins in healthcare industry features more than 90 solutions, over 40% of which are process digital twins.
- Around 50% of current solutions are intended for asset and process management applications, though a clear shift toward personalized treatment-focused twins is underway.
- More than 75 companies possess the expertise required to develop and manufacture digital twin solutions for healthcare, with the market dominated by small and mid-sized players, signaling a domain still in an early, innovation-driven growth phase.
Recent Developments Signaling Market Momentum
- Twin Health, developer of AI-powered metabolic digital twins for diabetes and obesity management, secured USD 53 million in a growth funding round led by Maj Invest, nearing a USD 1 billion valuation, with funds earmarked for expanding partnerships with health plans and Fortune 500 employers.
- India's Ministry of Health and Family Welfare launched the Smart Diagnostics Mission, allocating INR 1,200 crore to integrate digital twin technologies into public hospitals for early detection and personalized treatment of non-communicable diseases nationwide.
- Mayo Clinic launched what is described as the largest healthcare digital twin initiative to date, committing USD 1.2 billion to build a virtual model of its hospital system and patient groups aimed at streamlining operations and advancing personalized medicine.
- The European Commission unveiled its EU4Health Digital Horizon 2030 plan, providing EUR 500 million in funding to accelerate AI, simulation and digital twin platform integration across national health systems, with a focus on aging populations and chronic disease management.
Digital Twins in Healthcare Market Segments
The report segments the global digital twins in healthcare market across the following parameters:
By Therapeutic Area
- Cardiovascular Disorders
- Metabolic Disorders
- Orthopedic Disorders
- Other Disorders
By Type of Digital Twin
- Process Twins
- System Twins
- Whole Body Twins
- Body Part Twins
By Areas of Application
- Asset / Process Management
- Personalized Treatment
- Surgical Planning
- Diagnosis
- Other Applications
By End Users
- Pharmaceutical Companies
- Medical Device Manufacturers
- Healthcare Providers
- Patients
- Other End Users
By Key Geographical Regions
- North America
- Europe
- Asia
- Latin America
- Middle East and North Africa
- Rest of the World
Example Players in Digital Twins in Healthcare Market
- BigBear.ai
- Certara
- Dassault Systemes
- DEO
- Mesh Bio
- NavvTrack
- OnScale
- Phesi
- PrediSurge
- SingHealth
- Twin Health
- Unlearn
- Verto
- VictoryXR
- Virtonomy
DIGITAL TWINS IN HEALTHCARE MARKET RESEARCH COVERAGE
- Market Sizing and Opportunity Analysis: The report provides an in-depth assessment of the digital twins in healthcare market, covering historical trends and forecasted estimates across key segments, including therapeutic area, type of digital twin, area of application, end user, and geographical regions.
- Digital Twins in Healthcare Landscape: A detailed assessment of the overall digital twins in healthcare landscape, including analysis by development status, therapeutic area, area of application, technology type, end user, and type of digital twin. The report also evaluates digital twin developers based on year of establishment, company size, and location of headquarters.
- Key Market Insights: The study provides cross-segment analysis covering area of application and development status, type of technology and type of digital twin, end user and type of digital twin, headquarters location and application area, and company size and headquarters location.
- Company Competitiveness Analysis: A detailed benchmarking of companies based on portfolio strength, partnership activity, and funding activity, with additional regional analysis of players operating across North America, Europe, Asia, and other regions.
- Company Profiles: In-depth profiles of prominent digital twin developers, covering company overview, financial information where available, recent developments, future outlook, and relevant digital twin activities.
- Partnerships and Collaborations: An analysis of partnerships and collaborations in the digital twins in healthcare domain, including partnership models, types of agreements, geographic activity, local and international agreements, intercontinental and intracontinental collaborations, and the most active players.
- Funding and Investments Analysis: A comprehensive assessment of funding and investment activity, including funding types, number of funding instances, amount invested, geographical distribution, most active players, and leading investors.
- Berkus Start-up Valuation Analysis: A valuation assessment of emerging digital twin companies using the Berkus methodology, covering parameters such as sound idea, prototype, management experience, strategic relationships, and overall start-up valuation.
- Market Impact Analysis: The report evaluates the key factors influencing the evolution of the digital twins in healthcare market, including market drivers, restraints, opportunities, and challenges.
KEY QUESTIONS ANSWERED
- What is a digital twin in healthcare, and what are its main types?
- How big is the global digital twins in healthcare market today, and what is its projected size through 2035?
- What CAGR is the digital twins in healthcare market expected to register over the forecast period?
- What are the primary growth drivers and restraints shaping this industry?
- Which type of digital twin and application area hold the largest share today, and which are growing fastest?
- Which region leads the digital twins in healthcare market, and which is growing fastest?
- Who are the leading digital twin solution providers in healthcare?
REASONS TO BUY THIS REPORT
- Gain a comprehensive, ten-year forecast of the global digital twins in healthcare market segmented across five distinct parameters.
- Identify high-growth segments, including body part twins and personalized treatment applications, ahead of broader market recognition.
- Benchmark competitive positioning across more than 75 digital twin solution providers active in healthcare.
- Track recent partnerships, funding rounds and large-scale institutional initiatives shaping the competitive landscape.
- Support investment, partnership and business development decisions with region- and segment-level market sizing data.
ADDITIONAL BENEFITS
- Complementary PPT Insights Pack
- Complementary Excel Data Packs for all Analytical Modules in the Report
- 15% Free Content Customization
- Detailed Report Walkthrough Session with Research Team
- Free Updated Report if the Report is 6-12 Months Old or Older
TABLE OF CONTENTS
1. PREFACE
1.1. Digital Twins in Healthcare Market: Market Overview
- 1.2. Market Share Insights
- 1.3. Market Segmentation Overview
- 1.4. Key Market Insights
- 1.5. Report Coverage
- 1.6. Key Questions Answered
- 1.7. Chapter Outlines
2. RESEARCH METHODOLOGY
- 2.1. Chapter Overview
- 2.2. Research Assumptions
- 2.3. Project Methodology
- 2.4. Forecast Methodology
- 2.5. Robust Quality Control
- 2.6. Key Market Segmentations
- 2.7. Key Considerations
- 2.7.1. Demographics
- 2.7.2. Economic Factors
- 2.7.3. Government Regulations
- 2.7.4. Supply Chain
- 2.7.5. COVID Impact / Related Factors
- 2.7.6. Market Access
- 2.7.7. Healthcare Policies
- 2.7.8. Industry Consolidation
3. ECONOMIC AND OTHER PROJECT SPECIFIC CONSIDERATIONS
- 3.1. Chapter Overview
- 3.2. Market Dynamics
- 3.2.1. Time Period
- 3.2.1.1. Historical Trends
- 3.2.1.2. Current and Forecasted Estimates
- 3.2.2. Currency Coverage
- 3.2.2.1. Overview of Major Currencies Affecting the Market
- 3.2.2.2. Impact of Currency Fluctuations on the Industry
- 3.2.3. Foreign Exchange Impact
- 3.2.3.1. Evaluation of Foreign Exchange Rates and their Impact on Market
- 3.2.3.2. Strategies for Mitigating Foreign Exchange Risk
- 3.2.4. Recession
- 3.2.4.1. Historical Trends Analysis of Past Recessions and Lessons Learnt
- 3.2.4.2. Assessment of Current Economic Conditions and Potential Impact on the Market
- 3.2.5. Inflation
- 3.2.5.1. Measurement and Analysis of Inflationary Pressures in the Economy
- 3.2.5.2. Potential Impact of Inflation on the Market Evolution
- 3.2.1. Time Period
4. EXECUTIVE SUMMARY
5. INTRODUCTION
- 5.1. Chapter Overview
- 5.2. Overview of Digital Twins in Healthcare
- 5.3. Types of Digital Twins Used in Healthcare
- 5.3.1. System Twin
- 5.3.2. Process Twin
- 5.3.3. Human Digital Twin
- 5.4. Applications of Digital Twins in the Healthcare Domain
- 5.4.1. Asset / Process Management
- 5.4.2. Clinical Trial Evaluation
- 5.4.3. Personalized Medicine
- 5.4.4. Surgical Planning
- 5.5. Challenges Associated with the Adoption of Digital Twins
- 5.6. Concluding Remarks
6. MARKET LANDSCAPE
- 6.1. Chapter Overview
- 6.2. Digital Twins in Healthcare: Overall Market Landscape
- 6.2.1. Analysis by Development Status
- 6.2.2. Analysis by Therapeutic Area
- 6.2.3. Analysis by Area of Application
- 6.2.4. Analysis by Type of Technology Used
- 6.2.5. Analysis by End Users
- 6.2.6. Analysis by Type of Digital Twin
- 6.3. Digital Twins in Healthcare: Developer Landscape
- 6.3.1. Analysis by Year of Establishment
- 6.3.2. Analysis by Company Size
- 6.3.3. Analysis by Location of Headquarters
7. KEY INSIGHTS
- 7.1. Chapter Overview
- 7.2. Analysis by Area of Application and Development Status
- 7.3. Analysis by Type of Technology Used and Type of Digital Twin
- 7.4. Analysis by Type of End User and Type of Digital Twin
- 7.5. Analysis by Location of Headquarters and Area of Application
- 7.6. Analysis by Company Size and Location of Headquarters
8. COMPANY COMPETITIVENESS ANALYSIS
- 8.1. Chapter Overview
- 8.2. Assumptions and Key Parameters
- 8.3. Methodology
- 8.4. Digital Twins in Healthcare: Company Competitiveness Analysis
- 8.4.1. Company Competitiveness Analysis: Benchmarking of Portfolio Strength
- 8.4.2. Company Competitiveness Analysis: Benchmarking of Partnership Activity
- 8.4.3. Company Competitiveness Analysis: Benchmarking of Funding Activity
- 8.4.4. Company Competitiveness Analysis: Players Based in North America
- 8.4.5. Company Competitiveness Analysis: Players Based in Europe
- 8.4.6. Company Competitiveness Analysis: Players Based in Asia and Rest of the World
9. DETAILED COMPANY PROFILES
- 9.1. Chapter Overview
- 9.2. BigBear.ai
- 9.2.1. Company Overview
- 9.2.2. Financial Information
- 9.2.3. Recent Developments and Future Outlook
- 9.3. Certara
- 9.3.1. Company Overview
- 9.3.2. Financial Information
- 9.3.3. Recent Developments and Future Outlook
- 9.4. Dassault Systemes
- 9.4.1. Company Overview
- 9.4.2. Financial Information
- 9.4.3. Recent Developments and Future Outlook
- 9.5. NavvTrack
- 9.5.1. Company Overview
- 9.5.2. Recent Developments and Future Outlook
- 9.6. Unlearn.ai
- 9.6.1. Company Overview
- 9.6.2. Recent Developments and Future Outlook
10. TABULATED COMPANY PROFILES
- 10.1. Chapter Overview
- 10.2. Players Based in North America
- 10.2.1. OnScale
- 10.2.2. Phesi
- 10.2.3. Twin Health
- 10.2.4. Verto
- 10.2.5. VictoryXR
- 10.3. Players Based in Europe
- 10.3.1. DEO
- 10.3.2. PrediSurge
- 10.3.3. Virtonomy
- 10.4. Players Based in Asia
- 10.4.1. Mesh Bio
- 10.4.2. SingHealth
11. PARTNERSHIPS AND COLLABORATIONS
- 11.1. Chapter Overview
- 11.2. Digital Twins in Healthcare: Partnerships and Collaborations
- 11.2.1. Partnership Models
- 11.2.2. List of Partnerships and Collaborations
- 11.2.3. Analysis by Year of Partnership
- 11.2.4. Analysis by Type of Partnership
- 11.2.5. Analysis by Year and Type of Partnership
- 11.2.6. Analysis by Type of Partnership and Company Size
- 11.2.7. Most Active Players: Analysis by Number of Partnerships
- 11.2.8. Local and International Agreements
- 11.2.9. Intercontinental and Intracontinental Agreements
12. FUNDING AND INVESTMENTS ANALYSIS
- 12.1. Chapter Overview
- 12.2. Types of Funding
- 12.3. Digital Twins in Healthcare: List of Funding and Investments
- 12.3.1. Analysis by Number of Funding Instances
- 12.3.2. Analysis by Amount Invested
- 12.3.3. Analysis by Type of Funding
- 12.3.4. Analysis by Geography
- 12.3.5. Most Active Players: Analysis by Number of Funding Instances
- 12.3.6. Most Active Players: Analysis by Amount of Funding
- 12.3.7. Most Active Investors: Analysis by Number of Funding Instances
- 12.4. Concluding Remarks
13. BERKUS START-UP VALUATION ANALYSIS
- 13.1. Chapter Overview
- 13.2. Key Assumptions and Methodology
- 13.3. Berkus Start-Up Valuation: Total Valuation of Players
- 13.4. Digital Twins in Healthcare: Benchmarking of Berkus Start-Up Valuation Parameters
- 13.4.1. AI Body: Benchmarking of Berkus Start-Up Valuation Parameters
- 13.4.2. AnatoScope: Benchmarking of Berkus Start-Up Valuation Parameters
- 13.4.3. Antleron: Benchmarking of Berkus Start-Up Valuation Parameters
- 13.4.4. EmbodyBio: Benchmarking of Berkus Start-Up Valuation Parameters
- 13.4.5. Klinik Sankt Moritz: Benchmarking of Berkus Start-Up Valuation Parameters
- 13.4.6. KYDEA: Benchmarking of Berkus Start-Up Valuation Parameters
- 13.4.7. MAI: Benchmarking of Berkus Start-Up Valuation Parameters
- 13.4.8. Mindback AI: Benchmarking of Berkus Start-Up Valuation Parameters
- 13.4.9. Neo PLM: Benchmarking of Berkus Start-Up Valuation Parameters
- 13.4.10. Twinsight: Benchmarking of Berkus Start-Up Valuation Parameters
- 13.4.11. Yokogawa Insilico Biotechnology: Benchmarking of Berkus Start-Up Valuation Parameters
- 13.5. Digital Twins in Healthcare: Benchmarking of Players
- 13.5.1. Sound Idea: Benchmarking of Players
- 13.5.2. Prototype: Benchmarking of Players
- 13.5.3. Management Experience: Benchmarking of Players
- 13.5.4. Strategic Relationships: Benchmarking of Players
- 13.5.5. Total Valuation: Benchmarking of Players
14. MARKET IMPACT ANALYSIS: DRIVERS, RESTRAINTS, OPPORTUNITIES AND CHALLENGES
- 14.1. Chapter Overview
- 14.2. Market Drivers
- 14.3. Market Restraints
- 14.4. Market Opportunities
- 14.5. Market Challenges
- 14.6. Conclusion
15. GLOBAL DIGITAL TWIN IN HEALTHCARE MARKET
- 15.1. Chapter Overview
- 15.2. Assumptions and Methodology
- 15.3. Global Digital Twin in Healthcare Market, Historical Trends (Since 2018) and Forecasted Estimates (Till 2035)
- 15.3.1. Scenario Analysis
- 15.4. Key Market Segmentations
16. DIGITAL TWIN IN HEALTHCARE MARKET, BY THERAPEUTIC AREA
- 16.1. Chapter Overview
- 16.2. Key Assumptions and Methodology
- 16.3. Cardiovascular Disorders: Historical Trends (Since 2018) and Forecasted Estimates (Till 2035)
- 16.4. Metabolic Disorders: Historical Trends (Since 2018) and Forecasted Estimates (Till 2035)
- 16.5. Orthopedic Disorders: Historical Trends (Since 2018) and Forecasted Estimates (Till 2035)
- 16.6. Other Disorders: Historical Trends (Since 2018) and Forecasted Estimates (Till 2035)
- 16.7. Data Triangulation and Validation
17. DIGITAL TWIN IN HEALTHCARE MARKET, BY TYPE OF DIGITAL TWINS
- 17.1. Chapter Overview
- 17.2. Key Assumptions and Methodology
- 17.3. Process Twins: Historical Trends (Since 2018) and Forecasted Estimates (Till 2035)
- 17.4. System Twins: Historical Trends (Since 2018) and Forecasted Estimates (Till 2035)
- 17.5. Whole Body Twins: Historical Trends (Since 2018) and Forecasted Estimates (Till 2035)
- 17.6. Body Part Twins: Historical Trends (Since 2018) and Forecasted Estimates (Till 2035)
- 17.7. Data Triangulation and Validation
18. DIGITAL TWIN IN HEALTHCARE MARKET, BY AREA OF APPLICATION
- 18.1. Chapter Overview
- 18.2. Key Assumptions and Methodology
- 18.3. Asset / Process Management: Historical Trends (Since 2018) and Forecasted Estimates (Till 2035)
- 18.4. Personalized Treatment: Historical Trends (Since 2018) and Forecasted Estimates (Till 2035)
- 18.5. Surgical Planning: Historical Trends (Since 2018) and Forecasted Estimates (Till 2035)
- 18.6. Diagnosis: Historical Trends (Since 2018) and Forecasted Estimates (Till 2035)
- 18.7. Other Applications: Historical Trends (Since 2018) and Forecasted Estimates (Till 2035)
- 18.8. Data Triangulation and Validation
19. DIGITAL TWIN IN HEALTHCARE MARKET, BY END USERS
- 19.1. Chapter Overview
- 19.2. Key Assumptions and Methodology
- 19.3. Pharmaceutical Companies: Historical Trends (Since 2018) and Forecasted Estimates (Till 2035)
- 19.4. Medical Device Manufacturers: Historical Trends (Since 2018) and Forecasted Estimates (Till 2035)
- 19.5. Healthcare Providers: Historical Trends (Since 2018) and Forecasted Estimates (Till 2035)
- 19.6. Patients: Historical Trends (Since 2018) and Forecasted Estimates (Till 2035)
- 19.7. Other End Users: Historical Trends (Since 2018) and Forecasted Estimates (Till 2035)
- 19.8. Data Triangulation and Validation
20. DIGITAL TWIN IN HEALTHCARE MARKET, BY GEOGRAPHY
- 20.1. Chapter Overview
- 20.2. Key Assumptions and Methodology
- 20.3. North America: Historical Trends (Since 2018) and Forecasted Estimates (Till 2035)
- 20.3.1. US: Historical Trends (Since 2018) and Forecasted Estimates (Till 2035)
- 20.3.2. Canada: Historical Trends (Since 2018) and Forecasted Estimates (Till 2035)
- 20.4. Europe: Historical Trends (Since 2018) and Forecasted Estimates (Till 2035)
- 20.4.1. France: Historical Trends (Since 2018) and Forecasted Estimates (Till 2035)
- 20.4.2. Germany: Historical Trends (Since 2018) and Forecasted Estimates (Till 2035)
- 20.4.3. Italy: Historical Trends (Since 2018) and Forecasted Estimates (Till 2035)
- 20.4.4. Spain: Historical Trends (Since 2018) and Forecasted Estimates (Till 2035)
- 20.4.5. UK: Historical Trends (Since 2018) and Forecasted Estimates (Till 2035)
- 20.4.6. Rest of Europe: Historical Trends (Since 2018) and Forecasted Estimates (Till 2035)
- 20.5. Asia: Historical Trends (Since 2018) and Forecasted Estimates (Till 2035)
- 20.5.1. China: Historical Trends (Since 2018) and Forecasted Estimates (Till 2035)
- 20.5.2. India: Historical Trends (Since 2018) and Forecasted Estimates (Till 2035)
- 20.5.3. Japan: Historical Trends (Since 2018) and Forecasted Estimates (Till 2035)
- 20.5.4. Singapore: Historical Trends (Since 2018) and Forecasted Estimates (Till 2035)
- 20.5.5. South Korea: Historical Trends (Since 2018) and Forecasted Estimates (Till 2035)
- 20.5.6. Rest of Asia: Historical Trends (Since 2018) and Forecasted Estimates (Till 2035)
- 20.6. Latin America: Historical Trends (Since 2018) and Forecasted Estimates (Till 2035)
- 20.6.1. Brazil: Historical Trends (Since 2018) and Forecasted Estimates (Till 2035)
- 20.7. Middle East and North Africa: Historical Trends (Since 2018) and Forecasted Estimates (Till 2035)
- 20.7.1. UAE: Historical Trends (Since 2018) and Forecasted Estimates (Till 2035)
- 20.8. Rest of the World: Historical Trends (Since 2018) and Forecasted Estimates (Till 2035)
- 20.8.1. Australia: Historical Trends (Since 2018) and Forecasted Estimates (Till 2035)
- 20.8.2. New Zealand: Historical Trends (Since 2018) and Forecasted Estimates (Till 2035)
- 20.9. Data Triangulation and Validation
21. CONCLUSION
22. EXECUTIVE INSIGHTS
- 22.1. Chapter Overview
- 22.2. Dassault Systemes
- 22.2.1. Company Snapshot
- 22.2.2. Interview Transcript: Barbara Holtz, Business Consultant
- 22.3. TwInsight
- 22.3.1. Company Snapshot
- 22.3.2. Interview Transcript: Marek Bucki, Co-Founder and Chief Scientific Officer
- 22.4. Unlearn.AI
- 22.4.1. Company Snapshot
- 22.4.2. Interview Transcript: Andrew Stelzer, Business Development Executive
- 22.5. Yokogawa Insilico Biotechnology
- 22.5.1. Company Snapshot
- 22.5.2. Interview Transcript: Klaus Mauch, Managing Director and Chief Executive Officer
23. APPENDIX I: TABULATED DATA
24. APPENDIX II: LIST OF COMPANIES AND ORGANIZATIONS
List of Tables
- Table 6.1 Digital Twins in Healthcare: Information on Development Status
- Table 6.2 Digital Twins in Healthcare: Information on Therapeutic Area
- Table 6.3 Digital Twins in Healthcare: Information on Areas of Application
- Table 6.4 Digital Twins in Healthcare: Information on Type of Technology Used
- Table 6.5 Digital Twins in Healthcare: Information on End Users
- Table 6.6 Digital Twins in Healthcare: Information on Type of Digital Twin
- Table 6.7 Digital Twins Developers: Information on Year of Establishment, Company Size, Location of Headquarters, Region of Headquarters and Number of Products
- Table 9.1 List of Companies Profiled
- Table 9.2 BigBear.ai: Company Overview
- Table 9.3 BigBear.ai: Recent Developments and Future Outlook
- Table 9.4 Certara: Company Overview
- Table 9.5 Certara: Recent Developments and Future Outlook
- Table 9.6 Dassault Systemes: Company Overview
- Table 9.7 Dassault Systemes: Recent Developments and Future Outlook
- Table 9.8 NavvTrack: Company Overview
- Table 9.9 NavvTrack: Recent Developments and Future Outlook
- Table 9.10 Unlearn.ai: Company Overview
- Table 9.11 Unlearn.ai: Recent Developments and Future Outlook
- Table 10.1 List of Companies Profiled
- Table 10.2 OnScale: Company Overview
- Table 10.3 Phesi: Company Overview
- Table 10.4 Twin Health: Company Overview
- Table 10.5 Verto: Company Overview
- Table 10.6 VictoryXR: Recent Developments and Future Outlook
- Table 10.7 DEO: Company Overview
- Table 10.8 PrediSurge: Company Overview
- Table 10.9 Virtonomy: Company Overview
- Table 10.10 Mesh Bio: Company Overview
- Table 10.11 SingHealth: Company Overview
- Table 11.1 Digital Twins in Healthcare: List of Partnerships and Collaborations, 2018-2023
- Table 11.2 Partnerships and Collaborations: Information on Type of Agreement (Country-wise and Continent-wise), 2018-2023
- Table 12.1 Funding and Investments: Information on Year of Investment, Type of Funding, Amount and Investor, 2018-2023
- Table 12.2 Funding and Investment Analysis: Regional Distribution by Total Amount Invested, 2018-2023
- Table 13.1 Berkus Start-Up Valuation: Total Valuation of Players
- Table 22.1 Dassault Systemes: Company Snapshot
- Table 22.2 TwInsight: Company Snapshot
- Table 22.3 Unlearn.AI: Company Snapshot
- Table 22.4 Yokogawa Insilico Biotechnology: Company Snapshot
- Table 23.1 Digital Twins: Distribution by Development Status
- Table 23.2 Digital Twins: Distribution by Therapeutic Area
- Table 23.3 Digital Twins: Distribution by Areas of Application
- Table 23.4 Digital Twins: Distribution by Type of Technology Used
- Table 23.5 Digital Twins: Distribution by End Users
- Table 23.6 Digital Twins in Healthcare: Distribution by Type of Digital Twin
- Table 23.7 Digital Twin Developers: Distribution by Year of Establishment
- Table 23.8 Digital Twin Developers: Distribution by Company Size
- Table 23.9 Digital Twin Developers: Distribution by Location of Headquarters
- Table 23.10 BigBear.ai: Annual Revenues, 2021-Q3 2023 (USD Million)
- Table 23.11 Certara: Annual Revenues, 2020-Q3 2023 (USD Million)
- Table 23.12 Dassault Systemes: Annual Revenues, 2019-Q3 2023 (EUR Billion)
- Table 23.13 Partnerships and Collaborations: Cumulative Year-wise Trend, 2018-2023
- Table 23.14 Partnerships and Collaborations: Distribution by Type of Partnership
- Table 23.15 Partnerships and Collaborations: Distribution by Year and Type of Partnership
- Table 23.16 Partnerships and Collaborations: Distribution by Type of Partnership and Company Size
- Table 23.17 Most Active Players: Distribution by Number of Partnerships
- Table 23.18 Partnerships and Collaborations: Local and International Agreements
- Table 23.19 Partnerships and Collaborations: Intercontinental and Intracontinental Agreements
- Table 23.20 Funding and Investment Analysis: Cumulative Year-wise Trend, 2018-2023
- Table 23.21 Funding and Investment Analysis: Cumulative Amount Invested (USD Million), 2018-2023
- Table 23.22 Funding and Investment Analysis: Distribution of Instances by Type of Funding, 2018-2023
- Table 23.23 Funding and Investment Analysis: Year-Wise Distribution by Type of Funding, 2018-2023
- Table 23.24 Funding and Investment Analysis: Distribution of Total Amount Invested (USD Million) by Type of Funding, 2018-2023
- Table 23.25 Funding and Investment Analysis: Distribution by Geography
- Table 23.26 Most Active Players: Distribution by Number of Funding Instances, 2018-2023
- Table 23.27 Most Active Players: Distribution by Amount Raised (USD Million), 2018-2023
- Table 23.28 Global Digital Twins in Healthcare Market, Historical Trends, 2018-2023 (USD Billion)
- Table 23.29 Global Digital Twins in Healthcare Market, Forecasted Estimates, till 2035, Conservative, Base and Optimistic Scenario (USD Billion)
- Table 23.30 Global Digital Twins in Healthcare Market: Distribution by Therapeutic Area, 2018, 2024 and 2035
- Table 23.31 Digital Twins in Healthcare Market for Cardiovascular Disorders, Historical Trends, 2018-2023 (USD Billion)
- Table 23.32 Digital Twins in Healthcare Market for Cardiovascular Disorders, Conservative, Base and Optimistic Scenarios, till 2035 (USD Billion)
- Table 23.33 Digital Twins in Healthcare Market for Metabolic Disorders, Historical Trends, 2018-2023 (USD Billion)
- Table 23.34 Digital Twins in Healthcare Market for Metabolic Disorders, Conservative, Base and Optimistic Scenarios, till 2035 (USD Billion)
- Table 23.35 Digital Twins in Healthcare Market for Orthopedic Disorders, Historical Trends, 2018-2023 (USD Billion)
- Table 23.36 Digital Twins in Healthcare Market for Orthopedic Disorders, Conservative, Base and Optimistic Scenarios, till 2035 (USD Billion)
- Table 23.37 Digital Twins in Healthcare Market for Other Disorders, Historical Trends, 2018-2023 (USD Billion)
- Table 23.38 Digital Twins in Healthcare Market for Other Disorders, Conservative, Base and Optimistic Scenarios, till 2035 (USD Billion)
- Table 23.39 Global Digital Twins in Healthcare Market: Distribution by Type of Digital Twin, 2018, 2024 and 2035
- Table 23.40 Digital Twins in Healthcare Market for Process Twins, Historical Trends, 2018-2023 (USD Billion)
- Table 23.41 Digital Twins in Healthcare Market for Process Twins, Conservative, Base and Optimistic Scenarios, till 2035 (USD Billion)
- Table 23.42 Digital Twins in Healthcare Market for System Twins, Historical Trends, 2018-2023 (USD Billion)
- Table 23.43 Digital Twins in Healthcare Market for System Twins, Conservative, Base and Optimistic Scenarios, till 2035 (USD Billion)
- Table 23.44 Digital Twins in Healthcare Market for Whole Body Twins, Historical Trends, 2018-2023 (USD Billion)
- Table 23.45 Digital Twins in Healthcare Market for Whole Body Twins, Conservative, Base and Optimistic Scenarios, till 2035 (USD Billion)
- Table 23.46 Digital Twins in Healthcare Market for Body Part Twins, Historical Trends, 2018-2023 (USD Billion)
- Table 23.47 Digital Twins in Healthcare Market for Body Part Twins, Conservative, Base and Optimistic Scenarios, till 2035 (USD Billion)
- Table 23.48 Global Digital Twins in Healthcare Market: Distribution by Area of Application, 2018, 2024 and 2035
- Table 23.49 Digital Twins in Healthcare Market for Asset / Process Management, Historical Trends, 2018-2023 (USD Billion)
- Table 23.50 Digital Twins in Healthcare Market for Asset / Process Management, Conservative, Base and Optimistic Scenarios, till 2035 (USD Billion)
- Table 23.51 Digital Twins in Healthcare Market for Personalized Treatment, Historical Trends, 2018-2023 (USD Billion)
- Table 23.52 Digital Twins in Healthcare Market for Personalized Treatment, Conservative, Base and Optimistic Scenarios, till 2035 (USD Billion)
- Table 23.53 Digital Twins in Healthcare Market for Surgical Planning, Historical Trends, 2018-2023 (USD Billion)
- Table 23.54 Digital Twins in Healthcare Market for Surgical Planning, Conservative, Base and Optimistic Scenarios, till 2035 (USD Billion)
- Table 23.55 Digital Twins in Healthcare Market for Diagnosis, Historical Trends, 2018-2023 (USD Billion)
- Table 23.56 Digital Twins in Healthcare Market for Diagnosis, Conservative, Base and Optimistic Scenarios, till 2035 (USD Billion)
- Table 23.57 Digital Twins in Healthcare Market for Other Application Areas, Historical Trends, 2018-2023 (USD Billion)
- Table 23.58 Digital Twins in Healthcare Market for Other Application Areas, Conservative, Base and Optimistic Scenarios, till 2035 (USD Billion)
- Table 23.59 Global Digital Twins in Healthcare Market: Distribution by End Users, 2018, 2024 and 2035
- Table 23.60 Digital Twins in Healthcare Market for Pharmaceutical Companies, Historical Trends, 2018-2023 (USD Billion)
- Table 23.61 Digital Twins in Healthcare Market for Pharmaceutical Companies, Conservative, Base and Optimistic Scenarios, till 2035 (USD Billion)
- Table 23.62 Digital Twins in Healthcare Market for Medical Device Manufacturers, Historical Trends, 2018-2023 (USD Billion)
- Table 23.63 Digital Twins in Healthcare Market for Medical Device Manufacturers, Conservative, Base and Optimistic Scenarios, till 2035 (USD Billion)
- Table 23.64 Digital Twins in Healthcare Market for Healthcare Providers, Historical Trends, 2018-2023 (USD Billion)
- Table 23.65 Digital Twins in Healthcare Market for Healthcare Providers, Conservative, Base and Optimistic Scenarios, till 2035 (USD Billion)
- Table 23.66 Digital Twins in Healthcare Market for Patients, Historical Trends, 2018-2023 (USD Billion)
- Table 23.67 Digital Twins in Healthcare Market for Patients, Conservative, Base and Optimistic Scenarios, till 2035 (USD Billion)
- Table 23.68 Digital Twins in Healthcare Market for Other End Users, Historical Trends, 2018-2023 (USD Billion)
- Table 23.69 Digital Twins in Healthcare Market for Other End Users, Conservative, Base and Optimistic Scenarios, till 2035 (USD Billion)
- Table 23.70 Global Digital Twins in Healthcare Market: Distribution by Key Geographies, 2018, 2024 and 2035
- Table 23.71 Digital Twins in Healthcare Market in North America, Historical Trends, 2018-2023 (USD Billion)
- Table 23.72 Digital Twins in Healthcare Market in North America, Conservative, Base and Optimistic Scenarios, till 2035 (USD Billion)
- Table 23.73 Digital Twins in Healthcare Market in the US, Historical Trends, 2018-2023 (USD Billion)
- Table 23.74 Digital Twins in Healthcare Market in the US, Conservative, Base and Optimistic Scenarios, till 2035 (USD Billion)
- Table 23.75 Digital Twins in Healthcare Market in Canada, Historical Trends, 2018-2023 (USD Billion)
- Table 23.76 Digital Twins in Healthcare Market in Canada, Conservative, Base and Optimistic Scenarios, till 2035 (USD Billion)
- Table 23.77 Digital Twins in Healthcare Market in Europe, Historical Trends, 2018-2023 (USD Billion)
- Table 23.78 Digital Twins in Healthcare Market in Europe, Conservative, Base and Optimistic Scenarios, till 2035 (USD Billion)
- Table 23.79 Digital Twins in Healthcare Market in France, Historical Trends, 2018-2023 (USD Billion)
- Table 23.80 Digital Twins in Healthcare Market in France, Conservative, Base and Optimistic Scenarios, till 2035 (USD Billion)
- Table 23.81 Digital Twins in Healthcare Market in Germany, Historical Trends, 2018-2023 (USD Billion)
- Table 23.82 Digital Twins in Healthcare Market in Germany, Conservative, Base and Optimistic Scenarios, till 2035 (USD Billion)
- Table 23.83 Digital Twins in Healthcare Market in Italy, Historical Trends, 2018-2023 (USD Billion)
- Table 23.84 Digital Twins in Healthcare Market in Italy, Conservative, Base and Optimistic Scenarios, till 2035 (USD Billion)
- Table 23.85 Digital Twins in Healthcare Market in Spain, Historical Trends, 2018-2023 (USD Billion)
- Table 23.86 Digital Twins in Healthcare Market in Spain, Conservative, Base and Optimistic Scenarios, till 2035 (USD Billion)
- Table 23.87 Digital Twins in Healthcare Market in the UK, Historical Trends, 2018-2023 (USD Billion)
- Table 23.88 Digital Twins in Healthcare Market in the UK, Conservative, Base and Optimistic Scenarios, till 2035 (USD Billion)
- Table 23.89 Digital Twins in Healthcare Market in Rest of the Europe, Historical Trends, 2018-2023 (USD Billion)
- Table 23.90 Digital Twins in Healthcare Market in Rest of the Europe, Conservative, Base and Optimistic Scenarios, till 2035 (USD Billion)
- Table 23.91 Digital Twins in Healthcare Market in Asia, Historical Trends, 2018-2023 (USD Billion)
- Table 23.92 Digital Twins in Healthcare Market in Asia, Conservative, Base and Optimistic Scenarios, till 2035 (USD Billion)
- Table 23.93 Digital Twins in Healthcare Market in China, Historical Trends, 2018-2023 (USD Billion)
- Table 23.94 Digital Twins in Healthcare Market in China, Conservative, Base and Optimistic Scenarios, till 2035 (USD Billion)
- Table 23.95 Digital Twins in Healthcare Market in India, Historical Trends, 2018-2023 (USD Billion)
- Table 23.96 Digital Twins in Healthcare Market in India, Conservative, Base and Optimistic Scenarios, till 2035 (USD Billion)
- Table 23.97 Digital Twins in Healthcare Market in Japan, Historical Trends, 2018-2023 (USD Billion)
- Table 23.98 Digital Twins in Healthcare Market in Japan, Conservative, Base and Optimistic Scenarios, till 2035 (USD Billion)
- Table 23.99 Digital Twins in Healthcare Market in Singapore, Historical Trends, 2018-2023 (USD Billion)
- Table 23.100 Digital Twins in Healthcare Market in Singapore, Conservative, Base and Optimistic Scenarios, till 2035 (USD Billion)
- Table 23.101 Digital Twins in Healthcare Market in South Korea, Historical Trends, 2018-2023 (USD Billion)
- Table 23.102 Digital Twins in Healthcare Market in South Korea, Conservative, Base and Optimistic Scenarios, till 2035 (USD Billion)
- Table 23.103 Digital Twins in Healthcare Market in Rest of the Asia, Historical Trends, 2018-2023 (USD Billion)
- Table 23.104 Digital Twins in Healthcare Market in Rest of the Asia, Conservative, Base and Optimistic Scenarios, till 2035 (USD Billion)
- Table 23.105 Digital Twins in Healthcare Market in Latin America, Historical Trends, 2018-2023 (USD Billion)
- Table 23.106 Digital Twins in Healthcare Market in Latin America, Conservative, Base and Optimistic Scenarios, till 2035 (USD Billion)
- Table 23.107 Digital Twins in Healthcare Market in Brazil, Historical Trends, 2018-2023 (USD Billion)
- Table 23.108 Digital Twins in Healthcare Market in Brazil, Conservative, Base and Optimistic Scenarios, till 2035 (USD Billion)
- Table 23.109 Digital Twins in Healthcare Market in Middle East and North Africa, Historical Trends, 2018-2023 (USD Billion)
- Table 23.110 Digital Twins in Healthcare Market in Middle East and North Africa, Conservative, Base and Optimistic Scenarios, till 2035 (USD Billion)
- Table 23.111 Digital Twins in Healthcare Market in UAE, Historical Trends, 2018-2023 (USD Billion)
- Table 23.112 Digital Twins in Healthcare Market in UAE, Conservative, Base and Optimistic Scenarios, till 2035 (USD Billion)
- Table 23.113 Digital Twins in Healthcare Market in Rest of the World, Historical Trends, 2018-2023 (USD Billion)
- Table 23.114 Digital Twins in Healthcare Market in Rest of the World, Conservative, Base and Optimistic Scenarios, till 2035 (USD Billion)
- Table 23.115 Digital Twins in Healthcare Market in Australia, Historical Trends, 2018-2023 (USD Billion)
- Table 23.116 Digital Twins in Healthcare Market in Australia, Conservative, Base and Optimistic Scenarios, till 2035 (USD Billion)
- Table 23.117 Digital Twins in Healthcare Market in New Zealand, Historical Trends, 2018-2023 (USD Billion)
- Table 23.118 Digital Twins in Healthcare Market in New Zealand, Conservative, Base and Optimistic Scenarios, till 2035 (USD Billion)
List of Figures
- Figure 2.1 Research Methodology: Research Assumptions
- Figure 2.2 Research Methodology: Project Methodology
- Figure 2.3 Research Methodology: Forecast Methodology
- Figure 2.4 Research Methodology: Robust Quality Control
- Figure 2.5 Research Methodology: Key Market Segmentations
- Figure 4.1 Executive Summary: Market Landscape
- Figure 4.2 Executive Summary: Partnerships and Collaborations
- Figure 4.3 Executive Summary: Funding and Investment Analysis
- Figure 4.4 Executive Summary: Market Forecast and Opportunity Analysis (I / II)
- Figure 4.5 Executive Summary: Market Forecast and Opportunity Analysis (II / II)
- Figure 5.1 Types of Digital Twins Used in Healthcare
- Figure 5.2 Applications of Digital Twins in the Healthcare Domain
- Figure 6.1 Digital Twins: Distribution by Development Status
- Figure 6.2 Digital Twins: Distribution by Therapeutic Area
- Figure 6.3 Digital Twins: Distribution by Areas of Application
- Figure 6.4 Digital Twins: Distribution by Type of Technology Used
- Figure 6.5 Digital Twins: Distribution by End Users
- Figure 6.6 Digital Twins: Distribution by Type of Digital Twin
- Figure 6.7 Digital Twin Developers: Distribution by Year of Establishment
- Figure 6.8 Digital Twin Developers: Distribution by Company Size
- Figure 6.9 Digital Twin Developers: Distribution by Location of Headquarters
- Figure 7.1 Key Insights: Distribution by Area of Application and Development Status
- Figure 7.2 Key Insights: Distribution by Type of Technology Used and Type of Digital Twin
- Figure 7.3 Key Insights: Distribution by Type of End User and Type of Digital Twin
- Figure 7.4 Key Insights: Distribution by Location of Headquarters and Area of Application
- Figure 7.5 Key Insights: Distribution by Company Size and Location of Headquarters
- Figure 8.1 Company Competitiveness Analysis: Benchmarking of Portfolio Strength
- Figure 8.2 Company Competitiveness Analysis: Benchmarking of Partnership Activity
- Figure 8.3 Company Competitiveness Analysis: Benchmarking of Funding Activity
- Figure 8.4 Company Competitiveness Analysis: Dot-plot Analysis of Players Based in North America
- Figure 8.5 Company Competitiveness Analysis: 3-D Bubble Chart Analysis of Players Based in North America
- Figure 8.6 Company Competitiveness Analysis: Dot-plot Analysis of Players Based in Europe
- Figure 8.7 Company Competitiveness Analysis: 3-D Bubble Chart Analysis of Players Based in Europe
- Figure 8.8 Company Competitiveness Analysis: 3-D Bubble Chart Analysis of Players Based in Asia and Rest of the World
- Figure 9.1 BigBear.ai: Annual Revenues, 2021-Q3 2023 (USD Million)
- Figure 9.2 Certara: Annual Revenues, 2020-Q3 2023 (USD Million)
- Figure 9.3 Dassault Systemes: Annual Revenues, 2019-Q3 2023 (EUR Billion)
- Figure 11.1 Partnerships and Collaborations: Cumulative Year-wise Trend, 2018-2023
- Figure 11.2 Partnerships and Collaborations: Distribution by Type of Partnership
- Figure 11.3 Partnerships and Collaborations: Distribution by Year and Type of Partnership
- Figure 11.4 Partnerships and Collaborations: Distribution by Type of Partnership and Company Size
- Figure 11.5 Most Active Players: Distribution by Number of Partnerships
- Figure 11.6 Partnerships and Collaborations: Local and International Agreements
- Figure 11.7 Partnerships and Collaborations: Intercontinental and Intracontinental Agreements
- Figure 12.1 Funding and Investment Analysis: Cumulative Year-wise Trend, 2018-2023
- Figure 12.2 Funding and Investment Analysis: Cumulative Amount Invested (USD Million), 2018-2023
- Figure 12.3 Funding and Investment Analysis: Distribution of Instances by Type of Funding, 2018-2023
- Figure 12.4 Funding and Investment Analysis: Year-Wise Distribution by Type of Funding, 2018-2023
- Figure 12.5 Funding and Investment Analysis: Distribution of Total Amount Invested (USD Million) by Type of Funding, 2018-2023
- Figure 12.6 Funding and Investment Analysis: Distribution by Geography
- Figure 12.7 Most Active Players: Distribution by Number of Funding Instances, 2018-2023
- Figure 12.8 Most Active Players: Distribution by Amount Raised (USD Million), 2018-2023
- Figure 12.9 Funding and Investment Summary, 2018-2023 (USD Million)
- Figure 13.1 Berkus Start-Up Valuation: Total Valuation of Players (USD Million)
- Figure 13.2 AI Body: Benchmarking of Berkus Start-Up Valuation Parameters
- Figure 13.3 AnatoScope: Benchmarking of Berkus Start-Up Valuation Parameters
- Figure 13.4 Antleron: Benchmarking of Berkus Start-Up Valuation Parameters
- Figure 13.5 EmbodyBio: Benchmarking of Berkus Start-Up Valuation Parameters
- Figure 13.6 Klinik Sankt Moritz: Benchmarking of Berkus Start-Up Valuation Parameters
- Figure 13.7 MAI: Benchmarking of Berkus Start-Up Valuation Parameters
- Figure 13.8 Mindbank AI: Benchmarking of Berkus Start-Up Valuation Parameters
- Figure 13.9 Neo PLM: Benchmarking of Berkus Start-Up Valuation Parameters
- Figure 13.10 TwInsight: Benchmarking of Berkus Start-Up Valuation Parameters
- Figure 13.11 Sound Idea: Benchmarking of Players
- Figure 13.12 Prototype: Benchmarking of Players
- Figure 13.13 Management Experience: Benchmarking of Players
- Figure 13.14 Strategic Relationships: Benchmarking of Players
- Figure 13.15 Total Valuation: Benchmarking of Players
- Figure 14.1 Digital Twins in Healthcare: Market Drivers
- Figure 14.2 Digital Twins in Healthcare: Market Restraints
- Figure 14.3 Digital Twins in Healthcare: Market Opportunities
- Figure 14.4 Digital Twins in Healthcare: Market Challenges
- Figure 15.1 Global Digital Twins in Healthcare Market, Historical Trends (2018-2023) and Forecasted Estimates (till 2035) (USD Billion)
- Figure 15.2 Global Digital Twins in Healthcare Market, Forecasted Estimates (till 2035): Conservative Scenario (USD Billion)
- Figure 15.3 Global Digital Twins in Healthcare Market, Forecasted Estimates (till 2035): Optimistic Scenario (USD Billion)
- Figure 16.1 Digital Twins in Healthcare Market: Distribution by Therapeutic Area, 2018, 2024 And 2035
- Figure 16.2 Digital Twins in Healthcare Market for Cardiovascular Disorders, Historical Trends (2018-2023) and Forecasted Estimates (till 2035) (USD Billion)
- Figure 16.3 Digital Twins in Healthcare Market for Metabolic Disorders, Historical Trends (2018-2023) and Forecasted Estimates (till 2035) (USD Billion)
- Figure 16.4 Digital Twins in Healthcare Market for Orthopedic Disorders, Historical Trends (2018-2023) and Forecasted Estimates (till 2035) (USD Billion)
- Figure 16.5 Digital Twins in Healthcare Market for Other Disorders, Historical Trends (2018-2023) and Forecasted Estimates (till 2035) (USD Billion)
- Figure 17.1 Digital Twins in Healthcare Market: Distribution by Type of Digital Twin, 2018, 2024 And 2035
- Figure 17.2 Digital Twins in Healthcare Market for Process Twins, Historical Trends (2018-2023) and Forecasted Estimates (till 2035) (USD Billion)
- Figure 17.3 Digital Twins in Healthcare Market for System Twins, Historical Trends (2018-2023) and Forecasted Estimates (till 2035) (USD Billion)
- Figure 17.4 Digital Twins in Healthcare Market for Whole Body Twins, Historical Trends (2018-2023) and Forecasted Estimates (till 2035) (USD Billion)
- Figure 17.5 Digital Twins in Healthcare Market for Body Part Twins, Historical Trends (2018-2023) and Forecasted Estimates (till 2035) (USD Billion)
- Figure 18.1 Digital Twins in Healthcare Market: Distribution by Area of Application, 2018, 2024 And 2035
- Figure 18.2 Digital Twins in Healthcare Market for Asset / Process Management, Historical Trends (2018-2023) and Forecasted Estimates (till 2035) (USD Billion)
- Figure 18.3 Digital Twins in Healthcare Market for Personalized Treatment, Historical Trends (2018-2023) and Forecasted Estimates (till 2035) (USD Billion)
- Figure 18.4 Digital Twins in Healthcare Market for Surgical Planning, Historical Trends (2018-2023) and Forecasted Estimates (till 2035) (USD Billion)
- Figure 18.5 Digital Twins in Healthcare Market for Diagnosis, Historical Trends (2018-2023) and Forecasted Estimates (till 2035) (USD Billion)
- Figure 18.6 Digital Twins in Healthcare Market for Other Application Areas, Historical Trends (2018-2023) and Forecasted Estimates (till 2035) (USD Billion)
- Figure 19.1 Digital Twins in Healthcare Market: Distribution by End Users, 2018, 2024 And 2035
- Figure 19.2 Digital Twins in Healthcare Market for Pharmaceutical Companies, Historical Trends (2018-2023) and Forecasted Estimates (till 2035) (USD Billion)
- Figure 19.3 Digital Twins in Healthcare Market for Medical Device Manufacturers, Historical Trends (2018-2023) and Forecasted Estimates (till 2035) (USD Billion)
- Figure 19.4 Digital Twins in Healthcare Market for Healthcare Providers, Historical Trends (2018-2023) and Forecasted Estimates (till 2035) (USD Billion)
- Figure 19.5 Digital Twins in Healthcare Market for Patients, Historical Trends (2018-2023) and Forecasted Estimates (till 2035) (USD Billion)
- Figure 19.6 Digital Twins in Healthcare Market for Other End Users, Historical Trends (2018-2023) and Forecasted Estimates (till 2035) (USD Billion)
- Figure 20.1 Digital Twins in Healthcare Market: Distribution by Key Geographies, 2018, 2024 And 2035
- Figure 20.2 Digital Twins in Healthcare Market in North America, Historical Trends (2018-2023) and Forecasted Estimates (till 2035) (USD Billion)
- Figure 20.3 Digital Twins in Healthcare Market in the US, Historical Trends (2018-2023) and Forecasted Estimates (till 2035) (USD Billion)
- Figure 20.4 Digital Twins in Healthcare Market in Canada, Historical Trends (2018-2023) and Forecasted Estimates (till 2035) (USD Billion)
- Figure 20.5 Digital Twins in Healthcare Market in Europe, Historical Trends (2018-2023) and Forecasted Estimates (till 2035) (USD Billion)
- Figure 20.6 Digital Twins in Healthcare Market in France, Historical Trends (2018-2023) and Forecasted Estimates (till 2035) (USD Billion)
- Figure 20.7 Digital Twins in Healthcare Market in Germany, Historical Trends (2018-2023) and Forecasted Estimates (till 2035) (USD Billion)
- Figure 20.8 Digital Twins in Healthcare Market in Italy, Historical Trends (2018-2023) and Forecasted Estimates (till 2035) (USD Billion)
- Figure 20.9 Digital Twins in Healthcare Market in Spain, Historical Trends (2018-2023) and Forecasted Estimates (till 2035) (USD Billion)
- Figure 20.10 Digital Twins in Healthcare Market in the UK, Historical Trends (2018-2023) and Forecasted Estimates (till 2035) (USD Billion)
- Figure 20.11 Digital Twins in Healthcare Market in Rest of the Europe, Historical Trends (2018-2023) and Forecasted Estimates (till 2035) (USD Billion)
- Figure 20.12 Digital Twins in Healthcare Market in Asia, Historical Trends (2018-2023) and Forecasted Estimates (till 2035) (USD Billion)
- Figure 20.13 Digital Twins in Healthcare Market in China, Historical Trends (2018-2023) and Forecasted Estimates (till 2035) (USD Billion)
- Figure 20.14 Digital Twins in Healthcare Market in India, Historical Trends (2018-2023) and Forecasted Estimates (till 2035) (USD Billion)
- Figure 20.15 Digital Twins in Healthcare Market in Japan, Historical Trends (2018-2023) and Forecasted Estimates (till 2035) (USD Billion)
- Figure 20.16 Digital Twins in Healthcare Market in Singapore, Historical Trends (2018-2023) and Forecasted Estimates (till 2035) (USD Billion)
- Figure 20.17 Digital Twins in Healthcare Market in South Korea, Historical Trends (2018-2023) and Forecasted Estimates (till 2035) (USD Billion)
- Figure 20.18 Digital Twins in Healthcare Market in Rest of the Asia, Historical Trends (2018-2023) and Forecasted Estimates (till 2035) (USD Billion)
- Figure 20.19 Digital Twins in Healthcare Market in Latin America, Historical Trends (2018-2023) and Forecasted Estimates (till 2035) (USD Billion)
- Figure 20.20 Digital Twins in Healthcare Market in Brazil, Historical Trends (2018-2023) and Forecasted Estimates (till 2035) (USD Billion)
- Figure 20.21 Digital Twins in Healthcare Market in Middle East and North Africa, Historical Trends (2018-2023) and Forecasted Estimates (till 2035) (USD Billion)
- Figure 20.22 Digital Twins in Healthcare Market in UAE, Historical Trends (2018-2023) and Forecasted Estimates (till 2035) (USD Billion)
- Figure 20.23 Digital Twins in Healthcare Market in Rest of the World, Historical Trends (2018-2023) and Forecasted Estimates (till 2035) (USD Billion)
- Figure 20.24 Digital Twins in Healthcare Market in Australia, Historical Trends (2018-2023) and Forecasted Estimates (till 2035) (USD Billion)
- Figure 20.25 Digital Twins in Healthcare Market in New Zealand, Historical Trends (2018-2023) and Forecasted Estimates (till 2035) (USD Billion)
- Figure 21.1 Conclusion: Market Landscape
- Figure 21.2 Conclusion: Partnerships and Collaborations
- Figure 21.3 Conclusion: Funding and Investments
- Figure 21.4 Conclusion: Berkus Start-up Valuation Analysis
- Figure 21.5 Conclusion: Market Forecast (I / II)
- Figure 21.6 Conclusion: Market Forecast (II / II)

