PUBLISHER: Roots Analysis | PRODUCT CODE: 2161897

PUBLISHER: Roots Analysis | PRODUCT CODE: 2161897
Global DNA Encoded Library Market (2nd Edition) - Industry Trends and Global Forecast, Till 2035
GLOBAL DNA ENCODED LIBRARY MARKET OVERVIEW
As per Roots Analysis, the global DNA encoded library market is projected to grow from USD 1.3 billion in the current year to USD 5.0 billion by 2035, representing a CAGR of 16.3% during the forecast period.
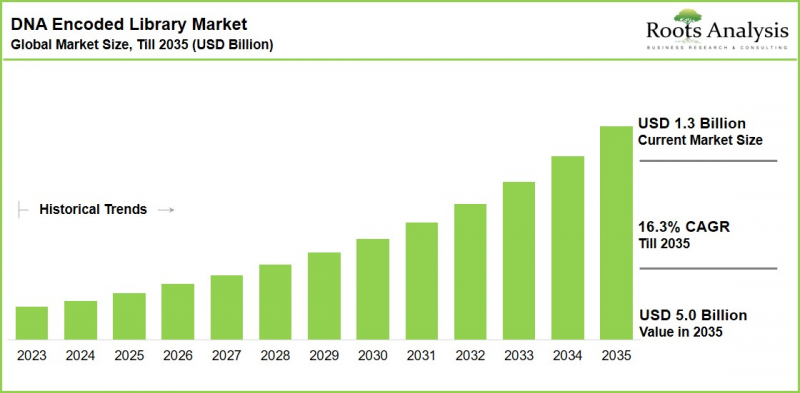
DNA Encoded Library Market: Growth and Trends
DNA encoded libraries (DELs) have emerged as an efficient drug discovery platform, enabling the synthesis and screening of millions to trillions of small molecule compounds in a single study. By using unique DNA sequences as molecular barcodes, DEL technology enables rapid compound identification following pooled screening, helping pharmaceutical and biotechnology companies accelerate discovery while reducing screening time and costs.
Growing demand for novel therapies for complex diseases, particularly oncology and neurological disorders, is driving investment in DEL platforms. Adoption has expanded across pharmaceutical and biotechnology companies, academic institutions, and contract research organizations, strengthening the role of DELs across the drug discovery value chain. Leading pharmaceutical companies, including Amgen, GSK, Pfizer, Roche, Novartis, AstraZeneca, Bristol Myers Squibb, Sanofi, and Janssen, have adopted DEL technology through internal programs or external collaborations.
Strategic partnerships, licensing agreements, and acquisitions continue to shape the competitive landscape. More than 175 strategic partnerships have been established in the DEL space since 2010, covering platform licensing, research and development, and product development. Recent activities include collaborations between Orbit Discovery and SanegeneBio and the acquisition of Glamorous.AI by X-Chem to strengthen artificial intelligence capabilities.
Investment activity has also increased, reflecting growing confidence in DEL-based drug discovery. DEL-focused companies have attracted substantial funding through venture financing and other investment rounds, while cumulative investment has expanded significantly in recent years. Patent activity has similarly increased, highlighting continued innovation across DEL technologies, screening platforms, and related applications.
The integration of artificial intelligence and machine learning is further expanding DEL capabilities by enabling more efficient analysis of large chemical spaces and improving hit identification and optimization. Strategic acquisitions and collaborations involving companies such as Insitro, X-Chem, and Relay Therapeutics demonstrate the growing convergence of DEL technology with AI-driven drug discovery.
Growth Drivers for the DNA Encoded Library Market
The global DNA encoded library market is driven by the technology's ability to accelerate drug discovery while reducing screening time and costs compared with traditional methods. Growing demand for innovative therapies targeting oncology, neurological disorders, and other complex diseases is further supporting adoption. Increasing integration of DEL platforms by pharmaceutical companies, clinical advancement of DEL-derived candidates, and growing applications of artificial intelligence and machine learning are strengthening market potential. Additionally, sustained venture capital investment and strategic partnerships are supporting platform innovation and commercialization.
Market Challenges: Factors Impeding Market Growth
The DNA encoded library market faces challenges related to a limited provider base, evolving commercial models, and the technical complexity of library design and screening. Limited availability of specialized providers may create capacity constraints as demand increases, while reliance on licensing and fee-for-service models can create revenue uncertainty for emerging companies. High technical requirements across library construction, DNA encoding, chemistry, and sequencing also increase development complexity. In addition, continued dependence on venture funding may create financial pressure for early-stage DEL companies.
Opportunity Areas in the DNA Encoded Library Market
Several emerging avenues offer meaningful upside across the DNA encoded library value chain:
- Screening Against Undruggable Targets: DEL's demonstrated ability to identify leads against previously undruggable and unique targets positions it as a differentiated tool for hard-to-treat disease areas.
- Advanced Peptide and Macrocycle Libraries: BioDuro's disclosure of a 108-channel automated synthesis platform capable of constructing billion-scale DNA-encoded peptide libraries with 10-mer-plus macrocycles at approximately 90% crude purity points to a widening application of DEL technology beyond small molecules.
- Antiviral and Non-Classical Target Discovery: Dual DEL selection strategy identified the first covalent allosteric inhibitors of SARS-CoV-2 RdRp, demonstrating DEL's capability to uncover non-classical druggable sites relevant to antiviral drug development.
- Expansion Beyond Drug Discovery: X-Chem's collaboration with Enko to enhance the Enkompass platform for crop protection illustrates how DEL technology is finding application outside conventional pharmaceutical discovery.
DNA Encoded Library Market: Key Insights
- Close to 50 large, mid-sized and small companies currently offer DNA encoded library services spanning hit identification, hit optimization and validation, and lead generation.
- Around 70% of these companies provide some form of library screening service.
- Nearly 403 patents have been filed in the field of DNA encoded libraries. Of these, 277 patents are patent applications, while 114 are granted patents. Of the total granted patents, around 65% patents have been filed in the US.
- Big pharma involvement remains a defining feature of the competitive landscape, with Amgen operating its DEL platform in-house following its acquisition of Nuevolution, alongside other major players engaging through collaboration models.
- As confidence in DEL-based drug discovery grows, these models are expected to become increasingly collaborative in nature.
Recent Developments Signaling Market Momentum
- BioDuro announced a 108-channel automated synthesis platform enabling construction of DNA-encoded peptide libraries with 10-mer-plus macrocycles, achieving approximately 90% crude purity and supporting billion-scale libraries.
- Researchers reported a dual DNA-encoded library selection strategy that identified the first covalent allosteric inhibitors of SARS-CoV-2 RdRp, with low-micromolar potency against a novel binding pocket.
- Orbit Discovery and SanegeneBio entered a research agreement to identify and optimize hits targeting a disease-causing gene.
DNA Encoded Library Market Segments
The report segments the global DNA encoded library market across the following parameters:
By Application Area
- Hit Generation / Identification
- Hit to Lead
- Hit Validation / Optimization
- Other Application Areas
By Therapeutic Area
- Oncological Disorders
- Immunological Disorders
- Neurological Disorders
- Respiratory Disorders
- Dermatological Disorders
- Cardiovascular Disorders
- Infectious Diseases
- Other Therapeutic Areas
By End-User
- Pharma / Biopharma Industry
- Academic / Research Institute
- Other End-Users
By Type of Payment Model Employed
- Upfront Payment
- Milestone Payment
By Key Geographical Regions
- North America (US)
- Europe (UK, Germany, Denmark, France, Switzerland, Rest of Europe)
- Asia-Pacific (China)
DNA Encoded Library Market: Key Segment Insights
Hit Discovery Drives DEL Adoption
Hit generation and identification holds the highest share of the market. This dominance is supported by the ability of DEL technology to screen extensive compound libraries efficiently and accelerate early-stage drug discovery.
Oncology Leads Therapeutic Applications
Oncology holds the highest share, driven by strong demand for novel small molecule and macrocycle candidates targeting cancer-related pathways. Growing applications in infectious diseases and other therapeutic areas are further broadening DEL adoption.
Pharma and Biotech Companies Lead End-User Demand
Pharmaceutical and biotechnology companies hold the highest share among end users, supported by increasing integration of DEL platforms into drug discovery programs. Providers are also adopting more collaborative and milestone-based payment models alongside traditional upfront and fee-based arrangements.
North America Leads the Global Market
North America holds the highest share, supported by the presence of established DEL providers, major pharmaceutical companies, strong research capabilities, and investment activity. Europe also represents a key regional market, supported by a growing concentration of DEL companies and research programs.
Example Players in DNA Encoded Library Market
- BOC Sciences
- DyNAbind
- Edelris
- GenScript
- HitGen
- NovAliX
- PROVendis
- SpiroChem
- Vipergen
- WuXi AppTec
- X-Chem
DNA ENCODED LIBRARY MARKET RESEARCH COVERAGE
- Market Forecast and Opportunity Analysis: Quantitative assessment of the global DNA encoded library market, including historical trends, future forecasts and scenario analysis across application areas, therapeutic areas, end users, payment models and key geographical regions.
- Competitive Landscape Analysis: Detailed evaluation of DNA encoded library platform and service providers based on company size, year of establishment, headquarters, organization type, library size, synthesis methods, screening methods, products, services, pharmacological leads, therapeutic targets, therapeutic areas and end users.
- Company Competitiveness Analysis: Comparative assessment of leading platform and service providers based on business models, product and service portfolios, platforms, pharmacological leads, therapeutic areas and therapeutic targets.
- Company Profiles: Detailed profiles of prominent DNA encoded library platform and service providers, covering company overview, management, platform and service portfolios, recent developments and future outlook.
- Partnerships and Collaborations: Analysis of strategic agreements across research, R&D, technology and product licensing, product development, commercialization, mergers and acquisitions, and other collaboration models.
- Funding and Investments: Evaluation of investments made in DNA encoded library companies, including venture capital financing, IPOs and subsequent offerings, grants and debt financing, with analysis of funding activity and investor participation.
- Patent Analysis: In-depth assessment of the DNA encoded library patent landscape, including patent applications and grants, publication and application years, jurisdictions, CPC classifications, leading patent holders, organization type, patent benchmarking and patent valuation.
- Big Pharma Initiatives: Assessment of DNA encoded library-related initiatives undertaken by leading pharmaceutical companies, including strategic adoption, collaborations and other activities across the industry.
- Supporting Ecosystem Analysis: Analysis of companies and organizations supporting DNA encoded library development through building blocks, oligos, scaffolds and other ancillary tools and services.
- Strategic Insights: Analysis of key winning strategies and the evolving commercial opportunities for DNA encoded library platform and service providers.
KEY QUESTIONS ANSWERED
- What is a DNA encoded library, and how does it accelerate drug discovery?
- How big is the global DNA encoded library market today, and what is its projected size through 2035?
- What CAGR is the DNA encoded library market expected to register over the forecast period?
- What are the primary growth drivers and restraints shaping the DNA encoded library industry?
- Which application area and therapeutic area hold the largest share of the market today?
- Which region leads the global DNA encoded library market, and which regions are expected to dominate by 2035?
- Who are the leading DNA encoded library platform and service providers?
REASONS TO BUY THIS REPORT
- Gain a comprehensive, ten-year forecast of the global DNA encoded library market segmented across five distinct parameters.
- Identify high-growth application and therapeutic areas, including infectious disease and non-classical target discovery, ahead of broader market recognition.
- Benchmark competitive positioning across close to 50 DEL platform and service providers and big pharma in-house programs.
- Track recent partnerships, acquisitions, funding rounds and patent activity shaping the competitive landscape.
- Support investment, partnership and business development decisions with region- and segment-level market sizing data.
ADDITIONAL BENEFITS
- Complementary PPT Insights Pack
- Complementary Excel Data Packs for all Analytical Modules in the Report
- 15% Free Content Customization
- Detailed Report Walkthrough Session with Research Team
- Free Updated Report if the Report is 6-12 Months Old or Older
TABLE OF CONTENTS
1. PREFACE
- 1.1. DNA Encoded Library Market Overview
- 1.2. Key Market Insights
- 1.3. Scope of the Report
- 1.4. Research Methodology
- 1.5. Frequently Asked Questions
- 1.6. Chapter Outlines
2. EXECUTIVE SUMMARY
3. INTRODUCTION
- 3.1. Chapter Overview
- 3.2. Overview of Drug Development
- 3.3. Drug Discovery Process
- 3.3.1. Target Identification
- 3.3.2. Target Validation
- 3.3.3. Hit Generation
- 3.3.3.1. High-throughput Screening
- 3.3.3.2. Fragment-based Screening
- 3.3.3.3. Virtual Screening
- 3.3.3.4. DNA Encoded Library Screening
- 3.3.4. Lead Generation
- 3.3.5. Lead Optimization
- 3.4. Overview of DNA Encoded Libraries
- 3.4.1. Encoding Strategies for Library Construction
- 3.4.2. Historical Evolution of DNA Encoded Libraries
- 3.4.3. Comparison of Traditional Libraries and DNA Encoded Libraries
- 3.4.4. Key Advantages of DNA Encoded Libraries
- 3.4.5. Challenges and Limitations Associated with DNA Encoded Libraries
- 3.5. Future Perspectives and Opportunity Areas
4. MARKET LANDSCAPE
- 4.1. Chapter Overview
- 4.2. DNA Encoded Library: Overall Market Landscape of Service Providers / Platform Providers / In-House Companies
- 4.2.1. Analysis by Year of Establishment
- 4.2.2. Analysis by Company Size
- 4.2.3. Analysis by Location of Headquarters
- 4.2.4. Analysis by Company Size and Location of Headquarters
- 4.2.5. Analysis by Type of Company / Organization
- 4.2.6. Analysis by Library Size
- 4.2.7. Analysis by Library Synthesis Method(s)
- 4.2.8. Analysis by Library Screening Method(s)
- 4.2.9. Analysis by Type of Product(s) Offered
- 4.2.10. Analysis by Type of Service(s) Offered
- 4.2.10.1. Analysis by Type of Library Design Service(s) Offered
- 4.2.10.2. Analysis by Type of Library Screening Service(s) Offered
- 4.2.11. Analysis by Type of Pharmacological Lead(s)
- 4.2.12. Analysis by Therapeutic Target(s)
- 4.2.13. Analysis by Therapeutic Area(s)
- 4.2.14. Analysis by End-user(s)
5. BUSINESS MODEL ANALYSIS
- 5.1. Chapter Overview
- 5.2. DNA Encoded Library Companies: Business Model Analysis
- 5.2.1. Analysis by Operational Model
- 5.2.1.1. Analysis by Company Size and Operational Model
- 5.2.1.2. Analysis by Location of Headquarters and Operational Model
- 5.2.2. Analysis by Business Model
- 5.2.2.1. Analysis by Service Centric Model
- 5.2.2.2. Analysis by Product Centric Model
- 5.2.1. Analysis by Operational Model
- 5.3. Concluding Remarks
6. COMPANY COMPETITIVENESS ANALYSIS
- 6.1. Chapter Overview
- 6.2. Assumptions and Key Parameters
- 6.3. Methodology
- 6.4. Company Competitiveness Analysis: DNA Encoded Library Service Providers / Platform Providers / In-House Companies
- 6.4.1. DNA Encoded Library Companies based in North America
- 6.4.2. DNA Encoded Library Companies based in Europe
- 6.4.3. DNA Encoded Library Companies based in Asia-Pacific
7. COMPANY PROFILES
- 7.1. Chapter Overview
- 7.2. AlphaMa
- 7.2.1. Company Overview
- 7.2.2. DNA Encoded Library Platform and Service Portfolio
- 7.2.3. Recent Developments and Future Outlook
- 7.3. DICE Therapeutics
- 7.3.1. Company Overview
- 7.3.2. DNA Encoded Library Platform and Service Portfolio
- 7.3.3. Recent Developments and Future Outlook
- 7.4. DyNAbind
- 7.4.1. Company Overview
- 7.4.2. DNA Encoded Library Platform and Service Portfolio
- 7.4.3. Recent Developments and Future Outlook
- 7.5. HitGen
- 7.5.1. Company Overview
- 7.5.2. DNA Encoded Library Platform and Service Portfolio
- 7.5.3. Recent Developments and Future Outlook
- 7.6. NovAliX
- 7.6.1. Company Overview
- 7.6.2. DNA Encoded Library Platform and Service Portfolio
- 7.6.3. Recent Developments and Future Outlook
- 7.7. Vipergen
- 7.7.1. Company Overview
- 7.7.2. DNA Encoded Library Platform and Service Portfolio
- 7.7.3. Recent Developments and Future Outlook
- 7.8. WuXi AppTec
- 7.8.1. Company Overview
- 7.8.2. DNA Encoded Library Platform and Service Portfolio
- 7.8.3. Recent Developments and Future Outlook
- 7.9. X-Chem
- 7.9.1. Company Overview
- 7.9.2. DNA Encoded Library Platform and Service Portfolio
- 7.9.3. Recent Developments and Future Outlook
8. PARTNERSHIPS AND COLLABORATIONS
- 8.1. Chapter Overview
- 8.2. Partnership Models
- 8.3. DNA Encoded Libraries: Partnerships and Collaborations
- 8.3.1. Analysis by Year of Partnership
- 8.3.2. Analysis by Type of Partnership
- 8.3.3. Analysis by Year and Type of Partnership
- 8.3.4. Analysis by Focus Area
- 8.3.5. Analysis by Therapeutic Area
- 8.3.6. Analysis by Type of Partner
- 8.3.6.1 Analysis by Partner Company Size
- 8.3.7. Most Active Players: Analysis by Number of Partnerships
- 8.3.8. Analysis by Geography
- 8.3.8.1. International and Local Agreements
- 8.3.8.2. Intercontinental and Intracontinental Agreements
9. FUNDING AND INVESTMENT ANALYSIS
- 9.1. Chapter Overview
- 9.2. Types of Funding
- 9.3. DNA Encoded Libraries: Funding and Investment Analysis
- 9.3.1. Analysis of Instances by Year of Funding
- 9.3.2. Analysis of Amount Invested by Year of Funding
- 9.3.3. Analysis of Instances by Type of Funding
- 9.3.4. Analysis of Amount Invested by Type of Funding
- 9.3.5. Most Active Players: Analysis by Number of Funding Instances
- 9.3.6. Most Active Players: Analysis by Amount Raised
- 9.3.7. Most Active Investors: Analysis by Number of Instances
- 9.3.8. Analysis by Geography
- 9.3.9. Concluding Remarks
10. PATENT ANALYSIS
- 10.1. Chapter Overview
- 10.2. Scope and Methodology
- 10.3. DNA Encoded Libraries: Patent Analysis
- 10.3.1. Analysis by Patent Publication Year
- 10.3.2. Analysis by Patent Application Year
- 10.3.3. Analysis by Type of Patent and Publication Year
- 10.3.4. Analysis by Patent Jurisdiction
- 10.3.5. Analysis by CPC Symbols
- 10.3.6. Analysis by Type of Applicant
- 10.3.7. Leading Industry Players: Analysis by Number of Patents
- 10.3.8. Leading Non-Industry Players: Analysis by Number of Patents
- 10.3.9. Leading Individual Assignees: Analysis by Number of Patents
- 10.4. DNA Encoded Libraries: Patent Benchmarking Analysis
- 10.4.1. Analysis by Patent Characteristics
- 10.5. DNA Encoded Libraries: Patent Valuation Analysis
- 10.6. Leading Patents by Number of Citations
11. BIG PHARMA INITIATIVES
- 11.1. Chapter Overview
- 11.2. Scope and Methodology
- 11.3. DNA Encoded Libraries Related Initiatives of Big Pharma Players
- 11.4. Benchmark Analysis of Big Pharma Players
- 11.4.1. Spider Web Analysis: AbbVie
- 11.4.2. Spider Web Analysis: Amgen
- 11.4.3. Spider Web Analysis: AstraZeneca
- 11.4.4. Spider Web Analysis: Bayer
- 11.4.5. Spider Web Analysis: Boehringer Ingelheim
- 11.4.6. Spider Web Analysis: Eli Lilly
- 11.4.7. Spider Web Analysis: GlaxoSmithKline (GSK)
- 11.4.8. Spider Web Analysis: Johnson & Johnson
- 11.4.9. Spider Web Analysis: Merck
- 11.4.10. Spider Web Analysis: Novartis
- 11.4.11. Spider Web Analysis: Pfizer
- 11.4.12. Spider Web Analysis: Sanofi
- 11.5. Concluding Remarks
12. CASE STUDY: COMPANIES / ORGANIZATIONS SUPPORTING THE DEVELOPMENT OF DNA ENCODED LIBRARIES
- 12.1. Chapter Overview
- 12.2. DNA Encoded Libraries: Overall Market Landscape of Supporting Companies / Organizations
- 12.2.1. Analysis by Year of Establishment
- 12.2.2. Analysis by Company Size
- 12.2.3. Analysis by Location of Headquarters
- 12.2.4. Analysis by Company Size and Location of Headquarters
- 12.2.5. Analysis by Type of Company / Organization
- 12.2.6. Analysis by Type of Support Services / Ancillary Tools Offered
- 12.2.7. Analysis by Location of Headquarters and Type of Support Services / Ancillary Tools Offered
13. MARKET FORECAST AND OPPORTUNITY ANALYSIS
- 13.1. Chapter Overview
- 13.2. Forecast Methodology and Key Assumptions
- 13.3. Global DNA Encoded Library Market (Platforms and Services): Historical, Base and Forecasted Scenario, 2017-2035
- 13.3.1. DNA Encoded Library Market (Platforms and Services): Distribution by Application Area, 2023 and 2035
- 13.3.1.1. DNA Encoded Library Market for Hit Generation / Identification, 2023-2035
- 13.3.1.2. DNA Encoded Library Market for Hit to Lead, 2023-2035
- 13.3.1.3. DNA Encoded Library Market for Hit Validation / Optimization, 2023-2035
- 13.3.1.4. DNA Encoded Library Market for Other Application Areas, 2023-2035
- 13.3.2. DNA Encoded Library Market (Platforms and Services): Distribution by Therapeutic Area, 2023 and 2035
- 13.3.2.1. DNA Encoded Library Market for Oncological Disorders, 2023-2035
- 13.3.2.2. DNA Encoded Library Market for Immunological Disorders, 2023-2035
- 13.3.2.3. DNA Encoded Library Market for Neurological Disorders, 2023-2035
- 13.3.2.4. DNA Encoded Library Market for Respiratory Disorders, 2023-2035
- 13.3.2.5. DNA Encoded Library Market for Dermatological Disorders, 2023-2035
- 13.3.2.6. DNA Encoded Library Market for Cardiovascular Disorders, 2023-2035
- 13.3.2.7. DNA Encoded Library Market for Infectious Diseases, 2023-2035
- 13.3.2.8. DNA Encoded Library Market for Other Therapeutic Areas, 2023-2035
- 13.3.3. DNA Encoded Library Market (Platforms and Services): Distribution by End-user, 2023 and 2035
- 13.3.3.1. DNA Encoded Library Market for Pharma / Biopharma Industry, 2023-2035
- 13.3.3.2. DNA Encoded Library Market for Academic / Research Institute, 2023-2035
- 13.3.3.3. DNA Encoded Library Market for Other End-users, 2023-2035
- 13.3.4. DNA Encoded Library Market (Platforms and Services): Distribution by Type of Payment Model Employed, 2023 and 2035
- 13.3.4.1. DNA Encoded Library Market: Upfront Payments, 2023-2035
- 13.3.4.2. DNA Encoded Library Market: Milestone Payments, 2023-2035
- 13.3.5. DNA Encoded Library Market (Platforms and Services): Distribution by Key Geographical Regions, 2023 and 2035
- 13.3.5.1. DNA Encoded Library Market in North America, 2023-2035
- 13.3.5.1.1. DNA Encoded Library Market in the US, 2023-2035
- 13.3.5.2. DNA Encoded Library Market in Europe, 2023-2035
- 13.3.5.2.1. DNA Encoded Library Market in Denmark, 2023-2035
- 13.3.5.2.2. DNA Encoded Library Market in Germany, 2023-2035
- 13.3.5.2.3. DNA Encoded Library Market in the UK, 2023-2035
- 13.3.5.2.4. DNA Encoded Library Market in Switzerland, 2023-2035
- 13.3.5.2.5. DNA Encoded Library Market in France, 2023-2035
- 13.3.5.2.6. DNA Encoded Library Market in Rest of the Europe, 2023-2035
- 13.3.5.3. DNA Encoded Library Market in Asia-Pacific, 2023-2035
- 13.3.5.3.1. DNA Encoded Library Market in China, 2023-2035
- 13.3.5.1. DNA Encoded Library Market in North America, 2023-2035
- 13.3.1. DNA Encoded Library Market (Platforms and Services): Distribution by Application Area, 2023 and 2035
14. CONCLUDING REMARKS
15. EXECUTIVE INSIGHTS
- 15.1. Chapter Overview
- 15.2. Vipergen
- 15.2.1. Company Snapshot
- 15.2.2. Interview Transcript: Nils Jakob Vest Hansen, Chief Executive Officer
- 15.3. Serengen
- 15.3.1. Company Snapshot
- 15.3.2. Interview Transcript: Thorsten Genski, Chief Executive Officer
- 15.4. Deluge Biotechnologies
- 15.4.1. Company Snapshot
- 15.4.2. Interview Transcript: Thomas Kodadek, Co-Founder and Ofelia Utset, President
- 15.5. NovAliX
- 15.5.1. Company Snapshot
- 15.5.2. Interview Transcript: Frank Moffatt, Director of Business Development
- 15.6. Orbit Discovery
- 15.6.1. Company Snapshot
- 15.6.2. Interview Transcript: Christos Tsiamantas, Senior Scientist
- 15.7. Anonymous
16. APPENDIX 1: TABULATED DATA
17. APPENDIX 2: LIST OF COMPANIES AND ORGANIZATIONS
List of Tables
- Table 4.1 DNA Encoded Libraries: List of Service Providers / Platform Providers / In-House Companies
- Table 4.2 DNA Encoded Libraries: Information on Library Size, Library Synthesis Method(s) and Library Screening Method(s)
- Table 4.3 DNA Encoded Libraries: Information on Type of Product(s) and Service(s) Offered
- Table 4.4 DNA Encoded Libraries: Information on Type of Pharmacological Lead(s) and Therapeutic Target(s)
- Table 4.5 DNA Encoded Libraries: Information on Therapeutic Area(s) and End-user(s)
- Table 5.1 DNA Encoded Libraries: Information on Company Size, Location of Headquarters and Operational Model
- Table 5.2 DNA Encoded Libraries: Information on Business Model
- Table 7.1 DNA Encoded Libraries: List of Companies Profiled
- Table 7.2 AlphaMa: Company Snapshot
- Table 7.3 AlphaMa: DNA Encoded Library Platform and Service Portfolio
- Table 7.4 AlphaMa: Recent Developments and Future Outlook
- Table 7.5 DICE Therapeutics: Company Snapshot
- Table 7.6 DICE Therapeutics: DNA Encoded Library Platform and Service Portfolio
- Table 7.7 DICE Therapeutics: Recent Developments and Future Outlook
- Table 7.8 DyNAbind: Company Snapshot
- Table 7.9 DyNAbind: DNA Encoded Library Platform and Service Portfolio
- Table 7.10 DyNAbind: Recent Developments and Future Outlook
- Table 7.11 HitGen: Company Snapshot
- Table 7.12 HitGen: DNA Encoded Library Platform and Service Portfolio
- Table 7.13 HitGen: Recent Developments and Future Outlook
- Table 7.14 NovAliX: Company Snapshot
- Table 7.15 NovAliX: DNA Encoded Library Platform and Service Portfolio
- Table 7.16 NovAliX: Recent Developments and Future Outlook
- Table 7.17 Vipergen: Company Snapshot
- Table 7.18 Vipergen: DNA Encoded Library Platform and Service Portfolio
- Table 7.19 Vipergen: Recent Developments and Future Outlook
- Table 7.20 WuXi AppTec: Company Snapshot
- Table 7.21 WuXi AppTec: DNA Encoded Library Platform and Service Portfolio
- Table 7.22 X-Chem: Company Snapshot
- Table 7.23 X-Chem: DNA Encoded Library Platform and Service Portfolio
- Table 7.24 X-Chem: Recent Developments and Future Outlook
- Table 8.1 DNA Encoded Libraries: List of Partnerships and Collaborations, 2010-2023
- Table 9.1 DNA Encoded Libraries: List of Funding and Investments, 2018-2023
- Table 10.1 Patent Analysis: Top CPC Sections
- Table 10.2 Patent Analysis: Top CPC Symbols
- Table 10.3 Patent Analysis: Top CPC Codes
- Table 10.4 Patent Analysis: Summary of Benchmarking Analysis
- Table 10.5 Patent Analysis: Categorization based on Weighted Valuation Scores
- Table 10.6 Patent Portfolio: List of Leading Patents (by Highest Relative Valuation)
- Table 10.7 Patent Portfolio: List of Leading Patents (by Number of Citations)
- Table 12.1 DNA Encoded Libraries: List of Supporting Companies / Organizations
- Table 12.2 DNA Encoded Libraries: Information on Type of Support Services / Ancillary Tools Offered
- Table 13.1 DNA Encoded Libraries: Average Upfront Payment and Average Milestone Payment, 2016-2022 (USD Million)
- Table 13.2 Library Licensing Deals: Tranches of Milestone Payments
- Table 15.1 Vipergen: Company Key Highlights
- Table 15.2 Serengen: Company Key Highlights
- Table 15.3 Deluge Biotechnologies: Company Key Highlights
- Table 15.4 NovAliX: Company Key Highlights
- Table 15.5 Orbit Discovery: Company Key Highlights
- Table 16.1 DNA Encoded Libraries: Distribution by Year of Establishment
- Table 16.2 DNA Encoded Libraries: Distribution by Company Size
- Table 16.3 DNA Encoded Libraries: Distribution by Location of Headquarters (Region-wise)
- Table 16.4 DNA Encoded Libraries: Distribution by Location of Headquarters (Country-wise)
- Table 16.5 DNA Encoded Libraries: Distribution by Company Size and Location of Headquarters
- Table 16.6 DNA Encoded Libraries: Distribution by Type of Company / Organization
- Table 16.7 DNA Encoded Libraries: Distribution by Library Size
- Table 16.8 DNA Encoded Libraries: Distribution by Library Synthesis Method(s)
- Table 16.9 DNA Encoded Libraries: Distribution by Library Screening Method(s)
- Table 16.10 DNA Encoded Libraries: Distribution by Type of Product(s) Offered
- Table 16.11 DNA Encoded Libraries: Distribution by Type of Library Design Service(s) Offered
- Table 16.12 DNA Encoded Libraries: Distribution by Type of Library Screening Service(s) Offered
- Table 16.13 DNA Encoded Libraries: Distribution by Type of Pharmacological Lead(s)
- Table 16.14 DNA Encoded Libraries: Distribution by Therapeutic Target(s)
- Table 16.15 DNA Encoded Libraries: Distribution by Therapeutic Area(s)
- Table 16.16 DNA Encoded Libraries: Distribution by End-user(s)
- Table 16.17 DNA Encoded Libraries: Distribution by Operational Model
- Table 16.18 DNA Encoded Libraries: Distribution by Company Size and Operational Model
- Table 16.19 DNA Encoded Libraries: Distribution by Location of Headquarters and Operational Model
- Table 16.20 DNA Encoded Libraries: Distribution by Business Model
- Table 16.21 DNA Encoded Libraries: Distribution by Service Centric Model
- Table 16.22 DNA Encoded Libraries: Distribution by Product Centric Model
- Table 16.23 Partnerships and Collaborations: Cumulative Year-wise Trend, 2010-2023
- Table 16.24 Partnerships and Collaborations: Distribution by Type of Partnership
- Table 16.25 Partnerships and Collaborations: Distribution by Year and Type of Partnership
- Table 16.26 Partnerships and Collaborations: Distribution by Type of Partnership, Pre-2018 and Post-2018
- Table 16.27 Partnerships and Collaborations: Distribution by Focus Area
- Table 16.28 Partnerships and Collaborations: Distribution by Therapeutic Area
- Table 16.29 Partnerships and Collaborations: Distribution by Type of Partner
- Table 16.30 Partnerships and Collaborations: Distribution by Partner Company Size
- Table 16.31 Most Active Players: Distribution by Number of Partnerships
- Table 16.32 Partnerships and Collaborations: International and Local Agreements
- Table 16.33 Partnerships and Collaborations: Intercontinental and Intracontinental Agreements
- Table 16.34 Funding and Investment: Distribution by Year, Type of Funding and Amount Invested, 2018-2023 (USD Million)
- Table 16.35 Funding and Investment: Distribution of Instances by Year of Funding, 2018-2023
- Table 16.36 Funding and Investment: Distribution of Amount Invested by Year of Funding, 2018-2023 (USD Million)
- Table 16.37 Funding and Investment: Distribution of Instances by Type of Funding
- Table 16.38 Funding and Investment: Distribution of Amount Invested by Type of Funding (USD Million)
- Table 16.39 Most Active Players: Distribution by Number of Funding Instances
- Table 16.40 Most Active Players: Distribution by Amount Raised (USD Million)
- Table 16.41 Most Active Investors: Distribution by Number of Instances
- Table 16.42 Funding and Investment Analysis: Distribution of Number of Instances and Amount Invested by Geography (Region-wise) (USD Million)
- Table 16.43 Funding and Investment Analysis: Distribution of Number of Instances by Geography (Country-wise)
- Table 16.44 Funding and Investment Analysis: Summary of Investments by Number of Instances and Amount Invested (USD Million)
- Table 16.45 Patent Analysis: Distribution by Type of Patent
- Table 16.46 Patent Analysis: Distribution by Patent Publication Year, Pre-2010-2023
- Table 16.47 Patent Analysis: Distribution by Patent Application Year, Pre-2010-2022
- Table 16.48 Patent Analysis: Distribution by Type of Patent and Publication Year, Pre-2010-2023
- Table 16.49 Patent Analysis: Distribution by Patent Jurisdiction (Region-wise)
- Table 16.50 Patent Analysis: Distribution by Patent Jurisdiction (Country-wise)
- Table 16.51 Patent Analysis: Distribution by CPC Symbols
- Table 16.52 Patent Analysis: Cumulative Year-wise Distribution by Type of Applicant
- Table 16.53 Leading Industry Players: Distribution by Number of Patents
- Table 16.54 Leading Non-Industry Players: Distribution by Number of Patents
- Table 16.55 Leading Individual Assignees: Distribution by Number of Patents
- Table 16.56 Patent Benchmarking Analysis: Distribution of Patent Characteristics (CPC Codes) by Leading Industry Players
- Table 16.57 Patent Analysis: Distribution by Patent Age
- Table 16.58 Patent Analysis: Distribution by Relative Patent Valuation
- Table 16.59 Big Pharma Players: Heat Map Analysis of Top Pharma Companies
- Table 16.60 DNA Encoded Libraries Supporting Companies / Organizations: Distribution by Year of Establishment
- Table 16.61 DNA Encoded Libraries Supporting Companies / Organizations: Distribution by Company Size
- Table 16.62 DNA Encoded Libraries Supporting Companies / Organizations: Distribution by Location of Headquarters
- Table 16.63 DNA Encoded Libraries Supporting Companies / Organizations: Distribution by Company Size and Location of Headquarters
- Table 16.64 DNA Encoded Libraries Supporting Companies / Organizations: Distribution by Type of Company / Organization
- Table 16.65 DNA Encoded Libraries Supporting Companies / Organizations: Distribution by Type of Support Services / Ancillary Tools Offered
- Table 16.66 DNA Encoded Libraries Supporting Companies / Organizations: Distribution by Location of Headquarters and Type of Support Services / Ancillary Tools Offered
- Table 16.67 Global DNA Encoded Library Market (Platforms and Services): Historical, Base and Forecasted Opportunity, Conservative, Base and Optimistic Scenarios, 2017-2035 (USD Million)
- Table 16.68 DNA Encoded Library Market (Platforms and Services): Distribution by Application Area, 2023 and 2035 (USD Million)
- Table 16.69 DNA Encoded Library Market for Hit Generation / Identification, Conservative, Base and Optimistic Scenarios, 2023-2035 (USD Million)
- Table 16.70 DNA Encoded Library Market for Hit to Lead, Conservative, Base and Optimistic Scenarios, 2023-2035(USD Million)
- Table 16.71 DNA Encoded Library Market for Hit Validation / Optimization, Conservative, Base and Optimistic Scenarios, 2023-2035 (USD Million)
- Table 16.72 DNA Encoded Library Market for Other Application Areas, Conservative, Base and Optimistic Scenarios, 2023-2035 (USD Million)
- Table 16.73 DNA Encoded Library Market (Platforms and Services): Distribution by Therapeutic Area, 2023 and 2035 (USD Million)
- Table 16.74 DNA Encoded Library Market for Oncological Disorders, Conservative, Base and Optimistic Scenarios, 2023-2035 (USD Million)
- Table 16.75 DNA Encoded Library Market for Immunological Disorders, Conservative, Base and Optimistic Scenarios, 2023-2035 (USD Million)
- Table 16.76 DNA Encoded Library Market for Neurological Disorders, Conservative, Base and Optimistic Scenarios, 2023-2035 (USD Million)
- Table 16.77 DNA Encoded Library Market for Respiratory Disorders, Conservative, Base and Optimistic Scenarios, 2023-2035 (USD Million)
- Table 16.78 DNA Encoded Library Market for Dermatological Disorders, Conservative, Base and Optimistic Scenarios, 2023-2035 (USD Million)
- Table 16.79 DNA Encoded Library Market for Cardiovascular Disorders, Conservative, Base and Optimistic Scenarios, 2023-2035 (USD Million)
- Table 16.80 DNA Encoded Library Market for Infectious Diseases, Conservative, Base and Optimistic Scenarios, 2023-2035 (USD Million)
- Table 16.81 DNA Encoded Library Market for Other Therapeutic Areas, Conservative, Base and Optimistic Scenarios, 2023-2035 (USD Million)
- Table 16.82 DNA Encoded Library Market (Platforms and Services): Distribution by End-user, 2023 and 2035 (USD Million)
- Table 16.83 DNA Encoded Library Market for Pharma / Biopharma Industry, Conservative, Base and Optimistic Scenarios, 2023-2035 (USD Million)
- Table 16.84 DNA Encoded Library Market for Academic / Research Institute, Conservative, Base and Optimistic Scenarios, 2023-2035 (USD Million)
- Table 16.85 DNA Encoded Library Market for Other End-users, Conservative, Base and Optimistic Scenarios, 2023-2035 (USD Million)
- Table 16.86 DNA Encoded Library Market (Platforms and Services): Distribution by Type of Payment Model Employed, 2023 and 2035 (USD Million)
- Table 16.87 DNA Encoded Library Market: Upfront Payments, Conservative, Base and Optimistic Scenarios, 2023-2035 (USD Million)
- Table 16.88 DNA Encoded Library Market: Milestone Payments, Conservative, Base and Optimistic Scenarios, 2023-2035 (USD Million)
- Table 16.89 DNA Encoded Library Market (Platforms and Services): Distribution by Key Geographical Regions, 2023 and 2035 (USD Million)
- Table 16.90 DNA Encoded Library Market in the US, Conservative, Base and Optimistic Scenarios, 2023-2035 (USD Million)
- Table 16.91 DNA Encoded Library Market in Europe, Conservative, Base and Optimistic Scenarios, 2023-2035 (USD Million)
- Table 16.92 DNA Encoded Library Market in Denmark, Conservative, Base and Optimistic Scenarios, 2023-2035 (USD Million)
- Table 16.93 DNA Encoded Library Market in Germany, Conservative, Base and Optimistic Scenarios, 2023-2035 (USD Million)
- Table 16.94 DNA Encoded Library Market in UK, Conservative, Base and Optimistic Scenarios, 2023-2035 (USD Million)
- Table 16.95 DNA Encoded Library Market in Switzerland, Conservative, Base and Optimistic Scenarios, 2023-2035 (USD Million)
- Table 16.96 DNA Encoded Library Market in France, Conservative, Base and Optimistic Scenarios, 2023-2035 (USD Million)
- Table 16.97 DNA Encoded Library Market in Rest of the Europe, Conservative, Base and Optimistic Scenarios, 2023-2035 (USD Million)
- Table 16.98 DNA Encoded Library Market in China, Conservative, Base and Optimistic Scenarios, 2023-2035 (USD Million)
List of Figures
- Figure 2.1 Executive Summary: Market Landscape
- Figure 2.2 Executive Summary: Business Model Analysis
- Figure 2.3 Executive Summary: Partnerships and Collaborations
- Figure 2.4 Executive Summary: Funding and Investment Analysis
- Figure 2.5 Executive Summary: Patent Analysis
- Figure 2.6 Executive Summary: Market Forecast and Opportunity Analysis
- Figure 3.1 Drug Discovery and Development Timeline
- Figure 3.2 Drug Discovery Process
- Figure 3.3 Construction Process of a DNA Encoded Library
- Figure 3.4 Encoding Strategies for Constructing DNA Encoded Libraries
- Figure 3.5 Historical Evolution of DNA Encoded Libraries
- Figure 3.6 Comparison of Traditional Libraries and DNA Encoded Libraries
- Figure 3.7 Key Advantages of DNA Encoded Libraries
- Figure 3.8 Challenges and Limitations Associated with DNA Encoded Libraries
- Figure 4.1 DNA Encoded Libraries: Distribution by Year of Establishment
- Figure 4.2 DNA Encoded Libraries: Distribution by Company Size
- Figure 4.3 DNA Encoded Libraries: Distribution by Location of Headquarters (Region-wise)
- Figure 4.4 DNA Encoded Libraries: Distribution by Location of Headquarters (Country-wise)
- Figure 4.5 DNA Encoded Libraries: Distribution by Company Size and Location of Headquarters
- Figure 4.6 DNA Encoded Libraries: Distribution by Type of Company / Organization
- Figure 4.7 DNA Encoded Libraries: Distribution by Library Size
- Figure 4.8 DNA Encoded Libraries: Distribution by Library Synthesis Method(s)
- Figure 4.9 DNA Encoded Libraries: Distribution by Library Screening Method(s)
- Figure 4.10 DNA Encoded Libraries: Distribution by Type of Product(s) Offered
- Figure 4.11 DNA Encoded Libraries: Distribution by Type of Library Design Service(s) Offered
- Figure 4.12 DNA Encoded Libraries: Distribution by Type of Library Screening Service(s) Offered
- Figure 4.13 DNA Encoded Libraries: Distribution by Type of Pharmacological Lead(s)
- Figure 4.14 DNA Encoded Libraries: Distribution by Therapeutic Target(s)
- Figure 4.15 DNA Encoded Libraries: Distribution by Therapeutic Area(s)
- Figure 4.16 DNA Encoded Libraries: Distribution by End-user(s)
- Figure 5.1 DNA Encoded Libraries: Distribution by Operational Model
- Figure 5.2 DNA Encoded Libraries: Distribution by Company Size and Operational Model
- Figure 5.3 DNA Encoded Libraries: Distribution by Location of Headquarters and Operational Model
- Figure 5.4 DNA Encoded Libraries: Distribution by Business Model
- Figure 5.5 DNA Encoded Libraries: Distribution by Service Centric Model
- Figure 5.6 DNA Encoded Libraries: Distribution by Product Centric Model
- Figure 6.1 Company Competitiveness Analysis: DNA Encoded Library Companies based in North America
- Figure 6.2 Company Competitiveness Analysis: DNA Encoded Library Companies based in Europe
- Figure 6.3 Company Competitiveness Analysis: DNA Encoded Library Companies based in Asia-Pacific
- Figure 8.1 Partnerships and Collaborations: Cumulative Year-wise Trend, 2010-2023
- Figure 8.2 Partnerships and Collaborations: Distribution by Type of Partnership
- Figure 8.3 Partnerships and Collaborations: Distribution by Year and Type of Partnership
- Figure 8.4 Partnerships and Collaborations: Distribution by Type of Partnership, Pre-2018 and Post-2018
- Figure 8.5 Partnerships and Collaborations: Distribution by Focus Area
- Figure 8.6 Partnerships and Collaborations: Distribution by Therapeutic Area
- Figure 8.7 Partnerships and Collaborations: Distribution by Type of Partner
- Figure 8.8 Partnerships and Collaborations: Distribution by Partner Company Size
- Figure 8.9 Most Active Players: Distribution by Number of Partnerships
- Figure 8.10 Partnerships and Collaborations: International and Local Agreements
- Figure 8.11 Partnerships and Collaborations: Intercontinental and Intracontinental Agreements
- Figure 9.1 Funding and Investment: Distribution by Year, Type of Funding and Amount Invested, 2018-2023 (USD Million)
- Figure 9.2 Funding and Investment: Distribution of Instances by Year of Funding, 2018-2023
- Figure 9.3 Funding and Investment: Distribution of Amount Invested by Year of Funding, 2018-2023 (USD Million)
- Figure 9.4 Funding and Investment : Distribution of Instances by Type of Funding
- Figure 9.5 Funding and Investment: Distribution of Amount Invested by Type of Funding (USD Million)
- Figure 9.6 Most Active Players: Distribution by Number of Funding Instances
- Figure 9.7 Most Active Players: Distribution by Amount Raised (USD Million)
- Figure 9.8 Most Active Investors: Distribution by Number of Instances
- Figure 9.9 Funding and Investment: Distribution of Number of Instances and Amount Invested by Geography (Region-wise) (USD Million)
- Figure 9.10 Funding and Investment: Distribution of Number of Instances by Geography (Country-wise)
- Figure 9.11 Funding and Investment: Summary of Investments by Number of Instances and Amount Invested (USD Million)
- Figure 10.1 Patent Analysis: Distribution by Type of Patent
- Figure 10.2 Patent Analysis: Distribution by Patent Publication Year, Pre-2010-2023
- Figure 10.3 Patent Analysis: Distribution by Patent Application Year, Pre-2010-2022
- Figure 10.4 Patent Analysis: Distribution by Type of Patent and Publication Year, Pre-2010-2023
- Figure 10.5 Patent Analysis: Distribution by Patent Jurisdiction (Region-wise)
- Figure 10.6 Patent Analysis: Distribution by Patent Jurisdiction (Country-wise)
- Figure 10.7 Patent Analysis: Distribution by CPC Symbols
- Figure 10.8 Patent Analysis: Cumulative Year-wise Distribution by Type of Applicant
- Figure 10.9 Leading Industry Players: Distribution by Number of Patents
- Figure 10.10 Leading Non-Industry Players: Distribution by Number of Patents
- Figure 10.11 Leading Individual Assignees: Distribution by Number of Patents
- Figure 10.12 Patent Benchmarking Analysis: Distribution of Patent Characteristics (CPC Codes) by Leading Industry Players
- Figure 10.13 Patent Analysis: Distribution by Patent Age
- Figure 10.14 Patent Analysis: Distribution by Relative Patent Valuation
- Figure 11.1 Big Pharma Initiatives: Heat Map Analysis of Top Pharma Companies
- Figure 11.2 Spider Web Analysis: AbbVie
- Figure 11.3 Spider Web Analysis: Amgen
- Figure 11.4 Spider Web Analysis: AstraZeneca
- Figure 11.5 Spider Web Analysis: Bayer
- Figure 11.6 Spider Web Analysis: Boehringer Ingelheim
- Figure 11.7 Spider Web Analysis: Eli Lilly
- Figure 11.8 Spider Web Analysis: GlaxoSmithKline (GSK)
- Figure 11.9 Spider Web Analysis: Johnson & Johnson
- Figure 11.10 Spider Web Analysis: Merck
- Figure 11.11 Spider Web Analysis: Novartis
- Figure 11.12 Spider Web Analysis: Pfizer
- Figure 11.13 Spider Web Analysis: Sanofi
- Figure 12.1 DNA Encoded Libraries Supporting Companies / Organizations: Distribution by Year of Establishment
- Figure 12.2 DNA Encoded Libraries Supporting Companies / Organizations: Distribution by Company Size
- Figure 12.3 DNA Encoded Libraries Supporting Companies / Organizations: Distribution by Location of Headquarters
- Figure 12.4 DNA Encoded Libraries Supporting Companies / Organizations: Distribution by Company Size and Location of Headquarters
- Figure 12.5 DNA Encoded Libraries Supporting Companies / Organizations: Distribution by Type of Company / Organization
- Figure 12.6 DNA Encoded Libraries Supporting Companies / Organizations: Distribution by Type of Support Services / Ancillary Tools Offered
- Figure 12.7 DNA Encoded Libraries Supporting Companies / Organizations: Distribution by Location of Headquarters and Type of Support Services / Ancillary Tools Offered
- Figure 13.1 Licensing Agreements: Distribution of Financial Components
- Figure 13.2 Licensing Agreements: Illustrative Scenario based Opportunity Estimation
- Figure 13.3 Global DNA Encoded Library Market (Platforms and Services): Historical, Base and Forecasted Scenario, 2017-2035 (USD Billion)
- Figure 13.4 DNA Encoded Library Market (Platforms and Services): Distribution by Application Area, 2023 and 2035 (USD Million)
- Figure 13.5 DNA Encoded Library Market for Hit Generation / Identification, 2023-2035 (USD Million)
- Figure 13.6 DNA Encoded Library Market for Hit to Lead, 2023-2035(USD Million)
- Figure 13.7 DNA Encoded Library Market for Hit Validation / Optimization, 2023-2035 (USD Million)
- Figure 13.8 DNA Encoded Library Market for Other Application Areas, 2023-2035 (USD Million)
- Figure 13.9 DNA Encoded Library Market (Platforms and Services): Distribution by Therapeutic Area, 2023 and 2035 (USD Million)
- Figure 13.10 DNA Encoded Library Market for Oncological Disorders, 2023-2035 (USD Million)
- Figure 13.11 DNA Encoded Library Market for Immunological Disorders, 2023-2035 (USD Million)
- Figure 13.12 DNA Encoded Library Market for Neurological Disorders, 2023-2035 (USD Million)
- Figure 13.13 DNA Encoded Library Market for Respiratory Disorders, 2023-2035 (USD Million)
- Figure 13.14 DNA Encoded Library Market for Dermatological Disorders, 2023-2035 (USD Million)
- Figure 13.15 DNA Encoded Library Market for Cardiovascular Disorders, 2023-2035 (USD Million)
- Figure 13.16 DNA Encoded Library Market for Infectious Diseases, 2023-2035 (USD Million)
- Figure 13.17 DNA Encoded Library Market for Other Therapeutic Areas, 2023-2035 (USD Million)
- Figure 13.18 DNA Encoded Library Market (Platforms and Services): Distribution by End-user, 2023 and 2035 (USD Million)
- Figure 13.19 DNA Encoded Library Market for Pharma / Biopharma Industry, 2023-2035 (USD Million)
- Figure 13.20 DNA Encoded Library Market for Academic / Research Institute, 2023-2035 (USD Million)
- Figure 13.21 DNA Encoded Library Market for Other End-users, 2023-2035 (USD Million)
- Figure 13.22 DNA Encoded Library Market (Platforms and Services): Distribution by Type of Payment Model Employed, 2023 and 2035 (USD Million)
- Figure 13.23 DNA Encoded Library Market: Upfront Payments, 2023-2035 (USD Million)
- Figure 13.24 DNA Encoded Library Market: Milestone Payments, 2023-2035 (USD Million)
- Figure 10.25 DNA Encoded Library Market (Platforms and Services): Distribution by Key Geographical Regions, 2023 and 2035 (USD Million)
- Figure 13.26 DNA Encoded Library Market in the US, 2023-2035 (USD Million)
- Figure 13.27 DNA Encoded Library Market in Europe, 2023-2035 (USD Million)
- Figure 13.28 DNA Encoded Library Market in Denmark, 2023-2035 (USD Million)
- Figure 13.29 DNA Encoded Library Market in Germany, 2023-2035 (USD Million)
- Figure 10.30 DNA Encoded Library Market in UK, 2023-2035 (USD Million)
- Figure 13.31 DNA Encoded Library Market in Switzerland, 2023-2035 (USD Million)
- Figure 13.32 DNA Encoded Library Market in France, 2023-2035 (USD Million)
- Figure 13.33 DNA Encoded Library Market in Rest of the Europe, 2023-2035 (USD Million)
- Figure 13.34 DNA Encoded Library Market in China, 2023-2035 (USD Million)
- Figure 14.1 Concluding Remarks: Market Landscape
- Figure 14.2 Concluding Remarks: Business Model Analysis
- Figure 14.3 Concluding Remarks: Partnerships and Collaborations
- Figure 14.4 Concluding Remarks: Funding and Investment Analysis
- Figure 14.5 Concluding Remarks: Patent Analysis
- Figure 14.6 Concluding Remarks: Market Forecast and Opportunity Analysis

