PUBLISHER: Roots Analysis | PRODUCT CODE: 2161898

PUBLISHER: Roots Analysis | PRODUCT CODE: 2161898
Global Spatial Biology Market - Trends and Forecast Till 2035
GLOBAL SPATIAL BIOLOGY MARKET: OVERVIEW
As per Roots Analysis, the global spatial biology market is estimated to grow from USD 1.40 billion in the current year to USD 5.14 billion by 2035, at a CAGR of 15.5% during the forecast period, till 2035.
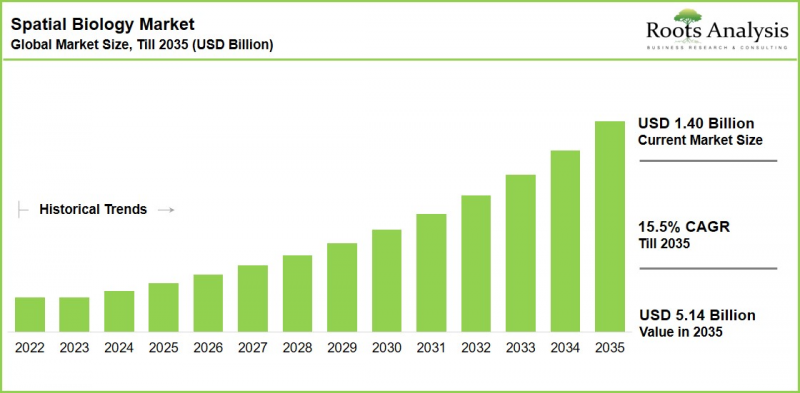
Spatial Biology Market: Growth and Trends
Spatial biology maps molecular profiles onto the cellular and structural setting of tissue. Bulk assays average signals across a whole sample. Dissociative single-cell methods strip cells from their native surroundings. Spatial genomics, transcriptomics, proteomics, metabolomics, and multi-omics approaches keep that context intact. Researchers can read molecular states alongside cellular neighborhoods, tissue architecture, and disease pathology. This matters most where the position of a target, immune population, or stromal barrier shapes biological function or treatment response.
Demand for context-rich tissue analysis is reshaping competition. The contest is moving from stand-alone instruments toward integrated workflows that link sample processing, molecular profiling, and interpretation. Market players are adding molecular plex, extending FFPE compatibility, automating assay steps, and connecting instruments to spatial informatics, AI-based segmentation, and service-based access. Bruker's portfolio now spans transcriptomics, proteomics, 3D genome visualization, and spatial informatics. 10x Genomics' Atera combines imaging, liquid handling, and onboard analysis for high-throughput whole-transcriptome measurement. Suppliers are shifting from selling instruments to offering complete sample-to-insight workflows. As studies move into larger translational cohorts and multi-omic designs, adoption will hinge on richer biological data, reproducible workflows, manageable experimental costs, and scalable analysis.
Spatial Biology Market: Growth Drivers
Drug developers need to know how therapeutic activity varies across intact tissue, not only whether a target is present. Spatial analysis shows where drugs reach, how target engagement differs across microenvironments, and which immune or stromal structures shape response.
Spatial biology is spreading from its strong oncology base into inflammatory, neurological, and infectious-disease research. According to the Nature Communications study built an inflammatory bowel disease atlas from more than 100 tissue sections and over three million cells. Each new disease area adds requirements for tissue profiling, assay content, and data interpretation. Demand therefore broadens across platforms, consumables, software, and services.
Spatial Biology Market Challenges: Factors Impeding Market Growth
Large spatial studies are expensive and resource intensive. According to Nature Communications study on spatial transcriptomics in inflammatory bowel disease reported two to three days of preparation, up to two weeks of instrument time, and costs of several thousand dollars per slide for the workflows assessed. Costs rise with every added specimen. Labs may cut sample numbers, reduce replication, or delay expansion.
Further, Spatial studies produce molecular measurements, images, cell boundaries, and physical coordinates. Multi-omic designs add more layers, often from different platforms. Aligning them takes heavy computing and specialist bioinformatics. Nature Computational Science benchmark of 295 spatial-alignment tasks found continuing limits in cross-platform, multi-slice, and large-scale analysis.
Spatial Biology Market: Recent Developments
Some of the recent initiatives in this industry are listed below:
- 10x Genomics and Cleveland Clinic: The organizations announced a research collaboration on diagnostic applications of single-cell and spatial technologies in patients with bladder cancer.
- Vizgen: The company released volumetric MERFISH datasets in mouse brain and human neurodegenerative brain tissue. It also launched Volumetric Tissue Mapping services and a Cell Atlasing Hub.
- PreludeDx and Quanterix: The companies highlighted AidaBREAST, developed on the Akoya PhenoImager HT platform with Opal chemistry. It was validated across 922 patients at four academic and clinical centers in the US and Sweden.
- Bio-Techne: The company expanded COMET with SPYRE panels, amplification kits, and HORIZON analytics.
Spatial Biology Market Segments
The market sizing and opportunity analysis is segmented across the following parameters:
By Product and Service
- Instruments and Platforms
- Consumables and Reagents
- Software and Analytics
- Services
By Molecular Technology
- Spatial Transcriptomics and Genomics
- Spatial Proteomics
- Spatial Metabolomics
- Spatial Multi-Omics
By Workflow
- Sample Preparation
- Instrumental Analysis
- Data Analysis and Interpretation
By Type of Sample
- Formalin-Fixed, Paraffin-Embedded (FFPE) Tissue
- Fresh Frozen Tissue
- Fixed Frozen Tissue
By Application
- Fundamental and Exploratory Research
- Drug Discovery and Development
- Translational Research
- Clinical Diagnostics
By Research Area
- Oncology and Immuno-Oncology
- Immunology
- Neuroscience
- Infectious Diseases
- Other Research Areas
By End User
- Pharmaceutical and Biotechnology Companies
- Academic and Research Institutions
- Contract Research Organizations
- Hospitals and Other Clinical Facilities
By Geographical Regions
- North America
- Europe
- Asia-Pacific
- Latin America
- Middle East and Africa
Spatial Biology Market: Key Segmentation Insights
Consumables and Reagents Lead as Software and Analytics Set the Pace
Consumables and reagents hold the largest product and service share. Every tissue run needs assay kits, panels, and probes, so each installed or accessed platform keeps generating demand. Instrument revenue depends on less frequent capital placements. Bio-Techne's expansion of SPYRE panels shows suppliers widening assay choice.
Software and analytics is projected to grow faster at a higher CAGR through 2035. Higher plex, larger cohorts, and multi-omic designs add work in cell segmentation, image interpretation, and multimodal integration. Bruker's AtoMx, with AI-based segmentation, is an example of analysis becoming central to platform value.
Spatial Transcriptomics and Genomics Lead, While Multi-Omics Grows Faster
Spatial transcriptomics and genomics hold the largest share among molecular technologies. Researchers can choose sequencing- or imaging-based approaches and whole-transcriptome or targeted workflows. The commercial ecosystem is more mature than for proteomics or metabolomics, which depend on validated antibody content or specialized instrumentation. 10x Genomics anchors this segment with its Xenium and Visium platforms.
Spatial multi-omics is expected to grow at a higher CAGR during the forecast period. Researchers want to see how complementary molecular layers interact within one tissue environment. Bruker's same-cell CosMx transcriptome and protein workflows illustrate the direction. Cost, assay design, and cross-modal analysis still limit routine use.
Instrumental Analysis Leads the Workflow, While Data Interpretation Gains Ground
Instrumental analysis represents the largest workflow share, since imaging and sequencing measurements sit at the core of every spatial study. Data analysis and interpretation is projected to grow faster. As studies scale, the analytical burden grows with experiment volume and data complexity.
FFPE Tissue Leads the Market
FFPE tissue holds the highest share of the spatial biology market. Routine pathology has created large archives linked to clinical history and outcomes. Fresh frozen and fixed frozen samples can offer strong molecular quality but depend on prospective collection and controlled storage.
FFPE is also expected to register a higher CAGR during the forecast period till 2035. Newer workflows recover more spatial information from fixed tissue despite fragmentation and variable block quality. More clinically annotated cohorts can now enter spatial studies. Tissue age, fixation conditions, and platform sensitivity remain important limits.
Translational Research Leads as Clinical Diagnostics Gains Momentum
Translational research accounts for the largest market share. Spatial profiling links mechanistic discovery with intact patient tissue before a workflow must meet diagnostic validation, regulatory, and reimbursement demands. University Hospital Schleswig-Holstein has analyzed more than 1,000 clinically annotated samples on the CellScape platform.
Clinical diagnostics is projected to grow at a higher CAGR during the forecast period. Signatures are moving toward assays tested across defined cohorts, as shown by the AidaBREAST validation from PreludeDx and Quanterix. Broader adoption will still depend on demonstrated utility, regulatory acceptance, and reimbursement.
Oncology and Immuno-Oncology Lead Among Research Areas
Oncology and immuno-oncology account for the largest research area share. Tumor microenvironments, immune infiltration, and drug distribution are natural fits for spatial analysis. Neuroscience and infectious diseases are jointly the fastest-growing categories, as spatial multi-
omics work extends into neurodegenerative tissue and host-pathogen responses.
Biopharma Leads End-User Demand, While Clinical Institutions Grow at Higher CAGR
Pharmaceutical and biotechnology companies dominate the current market. This dominance is driven due to the repeated high-dimensional studies across target discovery, mechanism-of-action work, biomarker development, and treatment-response profiling that demand spatial biology. Further, pharmaceutical companies are driving partnerships and collaborations to expand their global reach. Noetik and Bruker expanded a collaboration built on spatial data from more than 3,500 patient samples.
Hospitals and other clinical facilities are projected to grow at a higher CAGR during the forecast period. FFPE-compatible platforms, higher-throughput workflows, and pathology-linked spatial cores let hospitals use existing archives in larger translational programs.
North America Leads the Regional Market, While Asia-Pacific Grow at Higher CAGR
North America holds the highest share of the market. This dominance is driven by increasing research initiatives for advanced drugs, biopharma demand, and commercial access. The Human Tumor Atlas Network of the US National Cancer Institute sustains multi-institutional spatial cancer research. Leading providers such as 10x Genomics, Bruker, and Quanterix are headquartered in the region.
Asia-Pacific is projected to register the higher CAGR during the forecast period. This lucrative growth is supported by expanding spatial-omics infrastructure, growing research capacity and increasing access to advanced spatial profiling technologies. Initiatives such as the University of Sydney's Spatial Pan-Omics Initiative are strengthening shared research infrastructure, while the commercialization of Stereo-seq by STOmics in China is helping expand access to high-resolution spatial transcriptomics capabilities.
Example Players in the Spatial Biology Market
- 10x Genomics
- Akoya (acquired by Quanterix)
- Bruker Spatial Biology
- Lunaphore Technologies (acquired by Bio-Techne Spatial)
- Leica Microsystems
- NeoGenomics
- Resolve BioSciences
- STOmics
- Standard BioTools
- Vizgen
Industry Experts on Spatial Biology Market
Primary research discussions with multiple stakeholders in this domain influenced the opinions and insights presented in this study. The spatial biology market report includes transcripts of the following discussions:
- Co-founder, Small Company, US
- Senior Vice President of Marketing, Small Company, US
- Senior Director, Mid-sized Company, US
In addition, the spatial biology market report includes transcripts of the following third-party discussions:
- Founder and Owner, Small Company, Germany
- Chief Executive Officer and Managing Director, Large Company, India
- Chief Executive Officer and Chief Discovery Officer, Mid-sized Company, US
- Chief Scientific Officer, Co-Founder, Small Company, India
- Chief Scientific Officer, Large Company, UK
- Chief Scientific Officer, Small Company, China
- Senior Vice President and Global Head of Sales, Large Company, Switzerland
- Vice President, Large Company, Ireland
- Senior Director of Scientific Affairs and Technical Marketing, Small Company, US
- Senior Scientist, Large Institute, South Africa
SPATIAL BIOLOGY MARKET: RESEARCH COVERAGE
- Market Sizing and Opportunity Analysis: Annual market estimates, distributed across product and service, molecular technology, workflow, type of sample, application, research area, end user, and geography.
- Market Landscape: An assessment of spatial biology product and service providers by year of establishment, headquarters, spatial-omics solutions, and molecular technology.
- Company Competitiveness Analysis: An evaluation of providers by platform portfolio, molecular technology, assay content, software, analytical capabilities, and service participation.
- Company Profiles: In-depth profiles of key players, including 10x Genomics, Bruker Spatial Biology, Akoya (acquired by Quanterix), Lunaphore Technologies (acquired by Bio-Techne Spatial), Vizgen, Resolve BioSciences, STOmics, Standard BioTools, Leica Microsystems, and NeoGenomics.
- Partnerships and Collaborations: An analysis of partnerships and collaborations signed by providers, and their role in building integrated spatial workflows.
- Mergers and Acquisitions Analysis: A review of consolidation activity, such as the acquisitions of Akoya by Quanterix and Lunaphore Technologies by Bio-Techne Spatial.
- Funding and Investment Analysis: An analysis of financing and investment flowing into spatial biology companies.
- Publication Analysis: An analysis of scientific publications on spatial biology technologies and applications.
- Market Impact Analysis: An assessment of the drivers, restraints, and opportunity areas that shape market growth.
KEY QUESTIONS ANSWERED IN THIS REPORT
- How big is the spatial biology market, and what is its expected CAGR?
- Which are the leading companies in the spatial biology market?
- Which product and service categories drive demand, and which is growing fastest?
- Which molecular technologies are most widely used, and which will grow fastest?
- Why is FFPE tissue becoming more important for spatial workflows?
- Which region leads the market, and why is Asia-Pacific expected to grow fastest?
- How is spatial biology used in drug discovery, translational research, and diagnostic development?
- What are the main barriers to broader adoption?
- What should organizations evaluate when choosing a spatial biology platform or service provider?
- How is the current and future market opportunity distributed across key segments?
REASONS TO BUY THIS REPORT
The report provides detailed revenue projections for the overall market and its sub-segments. Both established leaders and new entrants can use it.
- It gives stakeholders a full view of drivers, restraints, and opportunity areas, so decisions can rest on data.
- It helps companies identify future opportunities and judge which are worth pursuing.
- It clarifies provider positioning across platforms, assay content, software, and service models.
- It equips new entrants with the information needed to build a sound market strategy.
- It supports partnership, investment, and business development decisions through a detailed view of alliances, funding, and consolidation.
ADDITIONAL BENEFITS
- Complimentary PowerPoint presentation
- Complimentary Excel data packs for all analytical modules in the report
- Up to 15% free content customization
- In-depth report walkthrough with the research team
- Complimentary report update if the report is 6+ months older
TABLE OF CONTENTS
1. PREFACE
- 1.1. Introduction
- 1.2. Market Key Insights
- 1.3. Market Segmentation
- 1.4. Market Share Insights
- 1.5. Key Questions Answered
2. RESEARCH METHODOLOGY
- 2.1. Chapter Overview
- 2.2. Research Assumptions
- 2.2.1. Market Landscape and Market Trends
- 2.2.2. Market Forecast and Opportunity Analysis
- 2.2.3. Comparative Analysis
- 2.3. Database Building
- 2.3.1. Data Collection
- 2.3.2. Data Validation
- 2.3.3. Data Analysis
- 2.4. Project Methodology
- 2.4.1. Secondary Research
- 2.4.1.1. Annual Reports
- 2.4.1.2. Academic Research Papers
- 2.4.1.3. Company Websites
- 2.4.1.4. Investor Presentations
- 2.4.1.5. Regulatory Filings
- 2.4.1.6. White Papers
- 2.4.1.7. Industry Publications
- 2.4.1.8. Conferences and Seminars
- 2.4.1.9. Government Portals
- 2.4.1.10. Media and Press Releases
- 2.4.1.11. Newsletters
- 2.4.1.12. Industry Databases
- 2.4.1.13. Roots Proprietary Databases
- 2.4.1.14. Paid Databases and Sources
- 2.4.1.15. Social Media Portals
- 2.4.1.16. Other Secondary Sources
- 2.4.2. Primary Research
- 2.4.2.1. Types of Primary Research
- 2.4.2.1.1. Qualitative Research
- 2.4.2.1.2. Quantitative Research
- 2.4.2.1.3. Hybrid Approach
- 2.4.2.2. Advantages of Primary Research
- 2.4.2.3. Techniques for Primary Research
- 2.4.2.3.1. Interviews
- 2.4.2.3.2. Surveys
- 2.4.2.3.3. Focus Groups
- 2.4.2.3.4. Observational Research
- 2.4.2.3.5. Social Media Interactions
- 2.4.2.4. Key Opinion Leaders Considered in Primary Research
- 2.4.2.4.1. Company Executives (CXOs)
- 2.4.2.4.2. Board of Directors
- 2.4.2.4.3. Company Presidents and Vice Presidents
- 2.4.2.4.4. Research and Development Heads
- 2.4.2.4.5. Technical Experts
- 2.4.2.4.6. Subject Matter Experts
- 2.4.2.4.7. Scientists
- 2.4.2.4.8. Doctors and Other Healthcare Providers
- 2.4.2.5. Ethics and Integrity
- 2.4.2.5.1. Research Ethics
- 2.4.2.5.2. Data Integrity
- 2.4.2.1. Types of Primary Research
- 2.4.3. Analytical Tools and Databases
- 2.4.1. Secondary Research
- 2.5. Robust Quality Control
3. MARKET DYNAMICS
- 3.1. Chapter Overview
- 3.2. Forecast Methodology
- 3.2.1. Top-down Approach
- 3.2.2. Bottom-up Approach
- 3.2.3. Hybrid Approach
- 3.3. Market Assessment Framework
- 3.3.1. Total Addressable Market (TAM)
- 3.3.2. Serviceable Addressable Market (SAM)
- 3.3.3. Serviceable Obtainable Market (SOM)
- 3.3.4. Currently Acquired Market (CAM)
- 3.4. Forecasting Tools and Techniques
- 3.4.1. Qualitative Forecasting
- 3.4.2. Correlation
- 3.4.3. Regression
- 3.4.4. Extrapolation
- 3.4.5. Convergence
- 3.4.6. Sensitivity Analysis
- 3.4.7. Scenario Planning
- 3.4.8. Data Visualization
- 3.4.9. Time Series Analysis
- 3.4.10. Forecast Error Analysis
- 3.5. Key Considerations
- 3.5.1. Demographics
- 3.5.2. Government Regulations
- 3.5.3. Reimbursement Scenarios
- 3.5.4. Market Access
- 3.5.5. Supply Chain
- 3.5.6. Industry Consolidation
- 3.5.7. Pandemic / Unforeseen Disruptions Impact
- 3.6. Limitations
4. MACRO-ECONOMIC INDICATORS
- 4.1. Chapter Overview
- 4.2. Market Dynamics
- 4.2.1. Time Period
- 4.2.1.1. Historical Trends
- 4.2.1.2. Current and Forecasted Estimates
- 4.2.2. Currency Coverage
- 4.2.2.1. Major Currencies Affecting the Market
- 4.2.2.2. Factors Affecting Currency Fluctuations on the Industry
- 4.2.2.3. Impact of Currency Fluctuations on the Industry
- 4.2.3. Foreign Currency Exchange Rate
- 4.2.3.1. Impact of Foreign Exchange Rate Volatility on the Market
- 4.2.3.2. Strategies for Mitigating Foreign Exchange Risk
- 4.2.4. Recession
- 4.2.4.1. Assessment of Current Economic Conditions and Potential Impact on the Market
- 4.2.4.2. Historical Analysis of Past Recessions and Lessons Learnt
- 4.2.5. Inflation
- 4.2.5.1. Measurement and Analysis of Inflationary Pressures in the Economy
- 4.2.5.2. Potential Impact of Inflation on the Market Evolution
- 4.2.6. Interest Rates
- 4.2.6.1. Interest Rates and Their Impact on the Market
- 4.2.6.2. Strategies for Managing Interest Rate Risk
- 4.2.7. Commodity Flow Analysis
- 4.2.7.1. Type of Commodity
- 4.2.7.2. Origins and Destinations
- 4.2.7.3. Values and Weights
- 4.2.7.4. Modes of Transportation
- 4.2.8. Global Trade Dynamics
- 4.2.8.1. Import Scenario
- 4.2.8.2. Export Scenario
- 4.2.8.3. Trade Policies
- 4.2.8.4. Strategies for Mitigating the Risks Associated with Trade Barriers
- 4.2.8.5. Impact of Trade Barriers on the Market
- 4.2.9. War Impact Analysis
- 4.2.9.1. Russian-Ukraine War
- 4.2.9.2. Israel-Hamas War
- 4.2.10. COVID Impact / Related Factors
- 4.2.10.1. Global Economic Impact
- 4.2.10.2. Industry-specific Impact
- 4.2.10.3. Government Response and Stimulus Measures
- 4.2.10.4. Future Outlook and Adaptation Strategies
- 4.2.11. Other Indicators
- 4.2.11.1. Fiscal Policy
- 4.2.11.2. Consumer Spending
- 4.2.11.3. Gross Domestic Product
- 4.2.11.4. Employment
- 4.2.11.5. Taxes
- 4.2.11.6. Stock Market Performance
- 4.2.11.7. Cross Border Dynamics
- 4.2.1. Time Period
- 4.3. Conclusion
5. EXECUTIVE SUMMARY
- 5.1. Chapter Overview
- 5.2. Executive Summary: Spatial Biology Market Landscape
- 5.3. Executive Summary: Spatial Biology Market Trends
- 5.4. Executive Summary: Market Forecast and Opportunity Analysis
6. INTRODUCTION
- 6.1. Chapter Overview
- 6.2. Spatial Biology: An Introduction
- 6.2.1. Evolution of Spatial Biology
- 6.2.2. Spatially Resolved Molecular Profiling
- 6.2.3. Spatial Biology Workflow
- 6.2.4. Molecular Technologies in Spatial Biology
- 6.2.4.1. Spatial Transcriptomics / Genomics
- 6.2.4.2. Spatial Proteomics
- 6.2.4.3. Spatial Metabolomics
- 6.2.4.4. Spatial Multi-omics
- 6.3. Applications of Spatial Biology
- 6.4. Advantages and Limitations
- 6.5. Future Perspectives
7. SPATIAL BIOLOGY MARKET LANDSCAPE
- 7.1. Chapter Overview
- 7.2. Spatial Biology Product and Service Providers: Overall Market Landscape
- 7.3. Analysis by Year of Establishment
- 7.4. Analysis by Company Size
- 7.5. Analysis by Headquarters
- 7.6. Analysis by Product and Service
- 7.7. Analysis by Molecular Technology
- 7.8. Analysis by Operating Footprint
8. COMPANY COMPETITIVENESS ANALYSIS
- 8.1. Chapter Overview
- 8.2. Methodology and Key Parameters
- 8.3. Spatial Biology Product and Service Providers: Company Competitiveness Analysis
9. COMPANY PROFILES
- 9.1. Chapter Overview
- 9.2. 10x Genomics
- 9.2.1. Company Overview
- 9.2.2. Financial Information
- 9.2.3. Spatial Biology Product / Service / Technology Portfolio
- 9.2.4. Recent Developments and Future Outlook
- 9.3. Akoya (acquired by Quanterix)
- 9.3.1. Company Overview
- 9.3.2. Spatial Biology Product / Service / Technology Portfolio
- 9.3.3. Recent Developments and Future Outlook
- 9.4. Bruker Spatial Biology
- 9.4.1. Company Overview
- 9.4.2. Spatial Biology Product / Service / Technology Portfolio
- 9.4.3. Recent Developments and Future Outlook
- 9.5. Leica Microsystems
- 9.5.1. Company Overview
- 9.5.2. Spatial Biology Product / Service / Technology Portfolio
- 9.5.3. Recent Developments and Future Outlook
- 9.6. Lunaphore Technologies (acquired by Bio-Techne Spatial)
- 9.6.1. Company Overview
- 9.6.2. Spatial Biology Product / Service / Technology Portfolio
- 9.6.3. Recent Developments and Future Outlook
- 9.7. NeoGenomics
- 9.7.1. Company Overview
- 9.7.2. Financial Information
- 9.7.3. Spatial Biology Product / Service / Technology Portfolio
- 9.7.4. Recent Developments and Future Outlook
- 9.8. Resolve BioSciences
- 9.8.1. Company Overview
- 9.8.2. Spatial Biology Product / Service / Technology Portfolio
- 9.8.3. Recent Developments and Future Outlook
- 9.9. Standard BioTools
- 9.9.1. Company Overview
- 9.9.2. Financial Information
- 9.9.3. Spatial Biology Product / Service / Technology Portfolio
- 9.9.4. Recent Developments and Future Outlook
- 9.10. STOmics
- 9.10.1. Company Overview
- 9.10.2. Spatial Biology Product / Service / Technology Portfolio
- 9.10.3. Recent Developments and Future Outlook
- 9.11. Vizgen
- 9.11.1. Company Overview
- 9.11.2. Spatial Biology Product / Service / Technology Portfolio
- 9.11.3. Recent Developments and Future Outlook
10. PUBLICATIONS ANALYSIS
- 10.1. Spatial Biology Market: Publications Analysis
- 10.1.1. Analysis Methodology
- 10.1.2. Key Parameters
- 10.2. Analysis by Year of Publication
- 10.3. Analysis by Type of Publication
- 10.4. Key Journals based on Publications Count
- 10.5. Analysis by Primary Author
- 10.6. Analysis by Publisher
- 10.7. Analysis by Primary Funding Body
- 10.8. Analysis by Journal Impact Factor
- 10.9. Analysis by Key Journals and Journal Impact Factor
11. PARTNERSHIPS AND COLLABORATIONS
- 11.1. Chapter Overview
- 11.2. Spatial Biology Market: Partnerships and Collaborations
- 11.3. Analysis by Year of Partnership
- 11.4. Analysis by Type of Partnership
- 11.5. Analysis by Type of Partner
- 11.6. Analysis by Geography
- 11.7. Most Active Players: Analysis by Number of Partnerships and Collaborations
12. MERGERS AND ACQUISITIONS
- 12.1. Chapter Overview
- 12.2. Types of Mergers and Acquisitions
- 12.3. Spatial Biology Market: Mergers and Acquisitions
- 12.3.1. Cumulative Trend of Mergers and Acquisitions
- 12.3.2. Analysis by Type of Agreement
- 12.3.3. Analysis by Geography
- 12.3.3.1. Local and International Agreements
- 12.3.3.2. Intracontinental and Intercontinental Agreements
- 12.3.4. Most Active Players: Analysis by Number of Agreements
- 12.3.5. Ownership Change Matrix
- 12.3.6. Analysis by Key Value Drivers
13. FUNDING AND INVESTMENT ANALYSIS
- 13.1. Chapter Overview
- 13.2. Funding Models
- 13.3. Spatial Biology Market: Funding and Investment Analysis
- 13.3.1. Analysis by Year of Funding
- 13.3.1.1. Cumulative Year-wise Trend of Funding Instances
- 13.3.1.2. Cumulative Year-wise Trend of Amount Invested
- 13.3.2. Analysis by Type of Funding
- 13.3.2.1. Analysis of Funding Instances
- 13.3.2.2. Analysis of Amount Invested
- 13.3.3. Analysis of Amount Invested by Year and Type of Funding
- 13.3.4. Analysis by Geography
- 13.3.5. Most Active Players
- 13.3.5.1. Analysis by Number of Funding Instances
- 13.3.5.2. Analysis by Amount Raised
- 13.3.1. Analysis by Year of Funding
14. VENDOR SELECTION FRAMEWORK
15. CASE STUDY I: TECHNOLOGY ADVANCEMENT IN SPATIAL BIOLOGY
16. MARKET IMPACT ANALYSIS
- 16.1. Chapter Overview
- 16.2. Market Drivers
- 16.3. Market Restraints
- 16.4. Market Challenges
- 16.5. Market Opportunities
- 16.6. Conclusion
17. GLOBAL SPATIAL BIOLOGY MARKET
- 17.1. Chapter Overview
- 17.2. Key Assumptions and Methodology
- 17.3. Global Spatial Biology Market: Historical Trends (since 2022) and Forecasted Estimates (till 2035)
- 17.4. Key Market Segmentations
18. SPATIAL BIOLOGY MARKET, BY PRODUCT AND SERVICE
- 18.1. Chapter Overview
- 18.2. Key Assumptions and Methodology
- 18.3. Spatial Biology Market: Distribution by Product and Service
- 18.4. Spatial Biology Market for Instruments and Platforms: Historical Trends (since 2022) and Forecasted Estimates (till 2035)
- 18.5. Spatial Biology Market for Consumables and Reagents: Historical Trends (since 2022) and Forecasted Estimates (till 2035)
- 18.6. Spatial Biology Market for Software and Analytics: Historical Trends (since 2022) and Forecasted Estimates (till 2035)
- 18.7. Spatial Biology Market for Services: Historical Trends (since 2022) and Forecasted Estimates (till 2035)
- 18.8. Data Triangulation and Validation
19. SPATIAL BIOLOGY MARKET, BY MOLECULAR TECHNOLOGY
- 19.1. Chapter Overview
- 19.2. Key Assumptions and Methodology
- 19.3. Spatial Biology Market: Distribution by Molecular Technology
- 19.4. Spatial Biology Market for Spatial Transcriptomics / Genomics: Historical Trends (since 2022) and Forecasted Estimates (till 2035)
- 19.5. Spatial Biology Market for Spatial Proteomics: Historical Trends (since 2022) and Forecasted Estimates (till 2035)
- 19.6. Spatial Biology Market for Spatial Metabolomics: Historical Trends (since 2022) and Forecasted Estimates (till 2035)
- 19.7. Spatial Biology Market for Spatial Multi-omics: Historical Trends (since 2022) and Forecasted Estimates (till 2035)
- 19.8. Data Triangulation and Validation
20. SPATIAL BIOLOGY MARKET, BY WORKFLOW
- 20.1. Chapter Overview
- 20.2. Key Assumptions and Methodology
- 20.3. Spatial Biology Market: Distribution by Workflow
- 20.4. Spatial Biology Market for Sample Preparation: Historical Trends (since 2022) and Forecasted Estimates (till 2035)
- 20.5. Spatial Biology Market for Instrumental Analysis: Historical Trends (since 2022) and Forecasted Estimates (till 2035)
- 20.6. Spatial Biology Market for Data Analysis and Interpretation: Historical Trends (since 2022) and Forecasted Estimates (till 2035)
- 20.7. Data Triangulation and Validation
21. SPATIAL BIOLOGY MARKET, BY TYPE OF SAMPLE
- 21.1. Chapter Overview
- 21.2. Key Assumptions and Methodology
- 21.3. Spatial Biology Market: Distribution by Type of Sample
- 21.4. Spatial Biology Market for Formalin-Fixed, Paraffin-Embedded Tissue: Historical Trends (since 2022) and Forecasted Estimates (till 2035)
- 21.5. Spatial Biology Market for Fresh Frozen Tissue: Historical Trends (since 2022) and Forecasted Estimates (till 2035)
- 21.6. Spatial Biology Market for Fixed Frozen Tissue: Historical Trends (since 2022) and Forecasted Estimates (till 2035)
- 21.7. Data Triangulation and Validation
22. SPATIAL BIOLOGY MARKET, BY APPLICATION
- 22.1. Chapter Overview
- 22.2. Key Assumptions and Methodology
- 22.3. Spatial Biology Market: Distribution by Application
- 22.4. Spatial Biology Market for Fundamental and Exploratory Research: Historical Trends (since 2022) and Forecasted Estimates (till 2035)
- 22.5. Spatial Biology Market for Drug Discovery and Development: Historical Trends (since 2022) and Forecasted Estimates (till 2035)
- 22.6. Spatial Biology Market for Translational Research: Historical Trends (since 2022) and Forecasted Estimates (till 2035)
- 22.7. Spatial Biology Market for Clinical Diagnostics: Historical Trends (since 2022) and Forecasted Estimates (till 2035)
- 22.8. Data Triangulation and Validation
23. SPATIAL BIOLOGY MARKET, BY RESEARCH AREA
- 23.1. Chapter Overview
- 23.2. Key Assumptions and Methodology
- 23.3. Spatial Biology Market: Distribution by Research Area
- 23.4. Spatial Biology Market for Oncology and Immuno-Oncology: Historical Trends (since 2022) and Forecasted Estimates (till 2035)
- 23.5. Spatial Biology Market for Immunology: Historical Trends (since 2022) and Forecasted Estimates (till 2035)
- 23.6. Spatial Biology Market for Neuroscience: Historical Trends (since 2022) and Forecasted Estimates (till 2035)
- 23.7. Spatial Biology Market for Infectious Diseases: Historical Trends (since 2022) and Forecasted Estimates (till 2035)
- 23.8. Spatial Biology Market for Other Research Areas: Historical Trends (since 2022) and Forecasted Estimates (till 2035)
- 23.9. Data Triangulation and Validation
24. SPATIAL BIOLOGY MARKET, BY END USER
- 24.1. Chapter Overview
- 24.2. Key Assumptions and Methodology
- 24.3. Spatial Biology Market: Distribution by End User
- 24.4. Spatial Biology Market for Pharmaceutical and Biotechnology Companies: Historical Trends (since 2022) and Forecasted Estimates (till 2035)
- 24.5. Spatial Biology Market for Academic and Research Institutions: Historical Trends (since 2022) and Forecasted Estimates (till 2035)
- 24.6. Spatial Biology Market for Contract Research Organizations: Historical Trends (since 2022) and Forecasted Estimates (till 2035)
- 24.7. Spatial Biology Market for Hospitals and Other Clinical Facilities: Historical Trends (since 2022) and Forecasted Estimates (till 2035)
- 24.8. Data Triangulation and Validation
25. SPATIAL BIOLOGY MARKET, BY GEOGRAPHY
- 25.1. Chapter Overview
- 25.2. Key Assumptions and Methodology
- 25.3. Spatial Biology Market: Distribution by Geography
- 25.4. North America Spatial Biology Market: Historical Trends (since 2022) and Forecasted Estimates (till 2035)
- 25.4.1. US Spatial Biology Market: Historical Trends (since 2022) and Forecasted Estimates (till 2035)
- 25.4.2. Canada Spatial Biology Market: Historical Trends (since 2022) and Forecasted Estimates (till 2035)
- 25.4.3. Mexico Spatial Biology Market: Historical Trends (since 2022) and Forecasted Estimates (till 2035)
- 25.4.4. Rest of North America Spatial Biology Market: Historical Trends (since 2022) and Forecasted Estimates (till 2035)
- 25.5. Europe Spatial Biology Market: Historical Trends (since 2022) and Forecasted Estimates (till 2035)
- 25.5.1. Germany Spatial Biology Market: Historical Trends (since 2022) and Forecasted Estimates (till 2035)
- 25.5.2. UK Spatial Biology Market: Historical Trends (since 2022) and Forecasted Estimates (till 2035)
- 25.5.3. Italy Spatial Biology Market: Historical Trends (since 2022) and Forecasted Estimates (till 2035)
- 25.5.4. Spain Spatial Biology Market: Historical Trends (since 2022) and Forecasted Estimates (till 2035)
- 25.5.5. France Spatial Biology Market: Historical Trends (since 2022) and Forecasted Estimates (till 2035)
- 25.5.6. Netherlands Spatial Biology Market: Historical Trends (since 2022) and Forecasted Estimates (till 2035)
- 25.5.7. Rest of Europe Spatial Biology Market: Historical Trends (since 2022) and Forecasted Estimates (till 2035)
- 25.6. Asia-Pacific Spatial Biology Market: Historical Trends (since 2022) and Forecasted Estimates (till 2035)
- 25.6.1. China Spatial Biology Market: Historical Trends (since 2022) and Forecasted Estimates (till 2035)
- 25.6.2. India Spatial Biology Market: Historical Trends (since 2022) and Forecasted Estimates (till 2035)
- 25.6.3. Japan Spatial Biology Market: Historical Trends (since 2022) and Forecasted Estimates (till 2035)
- 25.6.4. South Korea Spatial Biology Market: Historical Trends (since 2022) and Forecasted Estimates (till 2035)
- 25.6.5. Singapore Spatial Biology Market: Historical Trends (since 2022) and Forecasted Estimates (till 2035)
- 25.6.6. Rest of Asia Spatial Biology Market: Historical Trends (since 2022) and Forecasted Estimates (till 2035)
- 25.7. Latin America Spatial Biology Market: Historical Trends (since 2022) and Forecasted Estimates (till 2035)
- 25.7.1. Brazil Spatial Biology Market: Historical Trends (since 2022) and Forecasted Estimates (till 2035)
- 25.7.2. Argentina Spatial Biology Market: Historical Trends (since 2022) and Forecasted Estimates (till 2035)
- 25.7.3. Rest of Latin America Spatial Biology Market: Historical Trends (since 2022) and Forecasted Estimates (till 2035)
- 25.8. Middle East and Africa Spatial Biology Market: Historical Trends (since 2022) and Forecasted Estimates (till 2035)
- 25.8.1. Saudi Arabia Spatial Biology Market: Historical Trends (since 2022) and Forecasted Estimates (till 2035)
- 25.8.2. UAE Spatial Biology Market: Historical Trends (since 2022) and Forecasted Estimates (till 2035)
- 25.8.3. Iran Spatial Biology Market: Historical Trends (since 2022) and Forecasted Estimates (till 2035)
- 25.8.4. Egypt Spatial Biology Market: Historical Trends (since 2022) and Forecasted Estimates (till 2035)
- 25.8.5. Rest of Middle East and Africa Spatial Biology Market: Historical Trends (since 2022) and Forecasted Estimates (till 2035)
- 25.9. Penetration Growth (P-G) Matrix
- 25.10. Data Triangulation and Validation
26. CONCLUDING INSIGHTS
27. INSIGHTS FROM PRIMARY RESEARCH
28. APPENDIX I: TABULATED DATA
29. APPENDIX II: LIST OF COMPANIES AND ORGANIZATIONS

