
PUBLISHER: TECHCET | PRODUCT CODE: 1567377

PUBLISHER: TECHCET | PRODUCT CODE: 1567377
Ceramics / SiC Market Report 2024-2025 (Critical Materials Report)
This report is focused on technical ceramic materials market and supply-chain which includes SiC/ CVD SiC, AlN, Al2O3, Y2O3, and BN used in the production of components and assemblies for use in semiconductor process equipment. SiC is frequently used for both carriers (boats, gas injectors, and fabware) and components for OEMs where high temperature or specific thermal packages are required, while traditional Al2O3 and AlN ceramics are normally used for lower temperature / etch applications. The machines/tools manufacturers that use these components are referred to as OEMs (Original Equipment Manufacturers). This report targets ceramics used in the manufacture of semiconductors, only.
INFOGRAPHICS
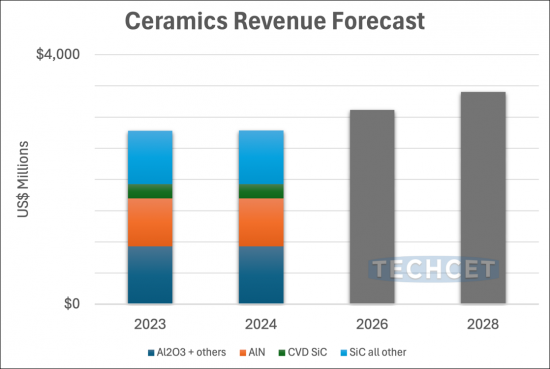
TABLE OF CONTENTS
1 EXECUTIVE SUMMARY
- 1.1 CERAMICS BUSINESS - MARKET OVERVIEW
- 1.2 MARKET TRENDS IMPACTING 2024 OUTLOOK
- 1.3 CERAMICS 5-YEAR REVENUE FORECAST BY SEGMENT
- 1.4 CERAMICS SEGMENT TRENDS
- 1.5 CERAMICS TECHNOLOGY TRENDS
- 1.6 COMPETITIVE LANDSCAPE
- 1.7 TOP-4 SUPPLIERS' ACTIVITIES & REPORTED REVENUES
- 1.8 EHS, TRADE, AND/OR LOGISTICS ISSUES/CONCERNS
- 1.9 ANALYST ASSESSMENT OF CERAMICS
2 SCOPE, PURPOSE, AND METHODOLOGY
- 2.1 SCOPE
- 2.2 PURPOSE & METHODOLOGY
- 2.3 OVERVIEW OF OTHER TECHCET CMRTM OFFERINGS
3 SEMICONDUCTOR INDUSTRY MARKET STATUS & OUTLOOK
- 3.1 WORLDWIDE ECONOMY AND OVERALL INDUSTRY OUTLOOK
- 3.1.1 SEMICONDUCTOR INDUSTRIES TIES TO THE GLOBAL ECONOMY
- 3.1.2 SEMICONDUCTOR SALES GROWTH
- 3.1.3 TAIWAN OUTSOURCE MANUFACTURER MONTHLY SALES TRENDS
- 3.2 CHIPS SALES BY ELECTRONIC GOODS SEGMENT
- 3.2.1 ELECTRONICS OUTLOOK
- 3.2.2 AUTOMOTIVE INDUSTRY OUTLOOK
- 3.2.2.1 ELECTRIC VEHICLE (EV) MARKET TRENDS
- 3.2.2.2 INCREASE IN SEMICONDUCTOR CONTENT FOR AUTOS
- 3.2.3 SMARTPHONE OUTLOOK
- 3.2.4 PC OUTLOOK
- 3.2.5 SERVERS / IT MARKET
- 3.3 SEMICONDUCTOR FABRICATION GROWTH & EXPANSION
- 3.3.1 IN THE MIDST OF HUGE INVESTMENT IN CHIP EXPANSIONS
- 3.3.2 NEW FABS IN THE US
- 3.3.3 WW FAB EXPANSION DRIVING GROWTH
- 3.3.4 EQUIPMENT SPENDING TRENDS
- 3.3.5 ADVANCED LOGIC TECHNOLOGY ROADMAPS
- 3.3.5.1 DRAM TECHNOLOGY ROADMAPS
- 3.3.5.2 3D NAND TECHNOLOGY ROADMAPS
- 3.3.6 FAB INVESTMENT ASSESSMENT
- 3.4 POLICY & TRADE TRENDS AND IMPACT
- 3.5 SEMICONDUCTOR MATERIALS OVERVIEW
- 3.5.1 TECHCET WAFER STARTS FORECAST THROUGH 2028
- 3.5.2 TECHCET MATERIALS MARKET FORECAST THROUGH 2028
4 CERAMICS MARKET TRENDS
- 4.1 CERAMICS MARKET TRENDS - OUTLINE
- 4.1.1 2023 CERAMICS MARKET LEADING INTO 2024
- 4.1.2 CERAMICS LANDSCAPE
- 4.1.3 CERAMICS MARKET OUTLOOK
- 4.2 CERAMICS 5-YEAR REVENUE FORECAST BY SEGMENT
- 4.2.1 CERAMICS PRODUCTION CAPACITY OF TOP SUPPLIERS - (NO ELECTROSTATIC CHUCKS)
- 4.3 ALUMINUM NITRIDE (ALN) MARKET SEGMENT
- 4.4 AL2O3 + OTHER COMPONENTS MARKET SEGMENT
- 4.4.1 AL2O3 + OTHER COMPONENTS MARKET SEGMENT, CONTINUED
- 4.5 HPA AL2O3
- 4.6 SIC (ALL AND CVD) COMPONENTS MARKET SEGMENT
- 4.6.1 SIC (ALL AND CVD) COMPONENTS MARKET SEGMENT, CONTINUED
- 4.6.2 CVD-SIC COMPONENTS- 5-YEAR FORECAST
- 4.6.3 CVD-SIC COST COMPONENTS MARKET SHARES
- 4.6.4 CVD-SIC COST CONSIDERATIONS AND ALTERNATIVES
- 4.7 CERAMICS PRODUCTION BY REGION
- 4.8 CERAMICS PRODUCTION CAPACITY EXPANSIONS
- 4.8.1 CAPACITY EXPANSIONS & INVESTMENT ANNOUNCEMENTS
- 4.8.2 INVESTMENT ACTIVITY ADDITIONAL COMMENTS
- 4.9 CERAMICS SUPPLY VS. DEMAND BALANCE - OVERVIEW
- 4.10 PRICING TRENDS
- 4.11 TECHNOLOGY TRENDS/TECHNICAL DRIVERS - OUTLINE
- 4.11.1 CERAMICS GENERAL TECHNOLOGY OVERVIEW
- 4.12 CERAMICS PRODUCTION CAPACITY OF TOP SUPPLIERS - INCLUDES ELECTROSTATIC CHUCKS
- 4.12.1 GENERAL TECHNOLOGY OVERVIEW - ELECTROSTATIC CHUCKS
- 4.12.2 CERAMICS GENERAL TECHNOLOGY OVERVIEW - ELECTROSTATIC CHUCKS
- 4.12.3 ELECTROSTATIC CHUCK REVENUE TREND AND FORECAST
- 4.13 CERAMICS TECHNOLOGY TRENDS
- 4.13.1 CERAMICS TECHNOLOGY TRENDS, CONTINUED
- 4.14 REGIONAL CONSIDERATIONS
- 4.14.1 REGIONAL CONSIDERATIONS - FABRICATORS' REVENUES BY COUNTRY
- 4.14.2 REGIONAL ASPECTS AND DRIVERS
- 4.15 EHS AND TRADE/LOGISTIC ISSUES
- 4.15.1 EHS AND TRADE/LOGISTIC ISSUES- TRANSPORTATION
- 4.15.2 EHS ISSUES - ENVIRONMENTAL IMPACT
- 4.15.3 TRADE/LOGISTICS ISSUES- SUMMARY
- 4.16 ANALYST ASSESSMENT OF CERAMICS MARKET TRENDS
5 SUPPLY-SIDE MARKET LANDSCAPE
- 5.1 CERAMICS MARKET SHARE
- 5.1.1 CERAMICS FABRICATORS OFFERINGS
- 5.1.2 TOP-4 SUPPLIERS' ACTIVITIES & REPORTED REVENUES
- 5.1.3 ACTIVITY - NGK INSULATORS
- 5.1.4 ACTIVITY - COORSTEK
- 5.1.5 ACTIVITY - KYOCERA
- 5.1.6 ACTIVITY - AGC (ASAHI GLASS)
- 5.1.7 ACTIVITY - MARUWA
- 5.1.8 ACTIVITY - FERROTEC
- 5.2 M&A ACTIVITY AND PARTNERSHIPS
- 5.3 PLANT CLOSURES
- 5.4 NEW ENTRANTS
- 5.5 TECHCET ANALYST ASSESSMENT OF CERAMICS SUPPLIERS
6 SUB-TIER SUPPLY-CHAIN, CERAMICS
- 6.1 SUB-TIER SUPPLY CHAIN: SOURCES & MARKETS OVERVIEW
- 6.2 SUB-TIER SUPPLY CHAIN: ALUMINA (AL2O3) - ORES AND POWDERS
- 6.2.1 SUB-TIER SUPPLY CHAIN: ALUMINA (AL2O3) PROCESSING BY REGION
- 6.2.2 SUB-TIER SUPPLY CHAIN: ALUMINA (AL2O3) BY SUPPLIER
- 6.2.3 SUB-TIER SUPPLY CHAIN: ALUMINA (AL2O3) - SUPPLIER PRODUCTS AND GRADES
- 6.3 SUB-TIER SUPPLY CHAIN: SILICON CARBIDE (SIC) - ORES AND POWDERS
- 6.4 SUB-TIER SUPPLY CHAIN: BLANKS
- 6.5 SUB-TIER SUPPLY-CHAIN M&A OR PARTNERSHIP ACTIVITY
- 6.6 SUB-TIER SUPPLY-CHAIN EHS AND LOGISTICS ISSUES
- 6.7 SUB-TIER SUPPLY-CHAIN PLANT UPDATES
- 6.8 SUB-TIER SUPPLY-CHAIN PLANT CLOSURES
- 6.9 SUB-TIER SUPPLY-CHAIN TECHCET ANALYST ASSESSMENT
7 PROFILES
- 3M COMPANY
- AGC INC.
- APPLIED CERAMICS, INC.
- ASUZAC INC., FINE CERAMICS DIVISION
- CARBORUNDUM UNIVERSAL LTD (CUMI)
- ...AND 30+ MORE
8 APPENDIX
- 8.1 RAW MATERIAL PRODUCTION DETAILS
- 8.2 ALUMINA PRODUCTION
- 8.3 RAW MATERIAL PRODUCTION PROCESSES - ALUMINIUM NITRIDE AND BORON NITRIDE
- 8.4 ALUMINUM NITRIDE PRODUCTION PROCESS
FIGURES
- FIGURE 1.1: CERAMICS REVENUE FORECAST BY SEGMENT
- FIGURE 1.2: CERAMICS MARKET SHARE % BY SUPPLIER
- FIGURE 1.3: MOST RECENT QUARTERLY CERAMICS SUPPLIER SALES
- FIGURE 3.1: GLOBAL ECONOMY AND THE ELECTRONICS SUPPLY CHAIN (2023)
- FIGURE 3.2: WORLDWIDE SEMICONDUCTOR SALES
- FIGURE 3.3: TECHCET'S TAIWAN SEMICONDUCTOR INDUSTRY INDEX (TTSII) IN 000'S OF NTD
- FIGURE 3.4: 2023 SEMICONDUCTOR CHIP APPLICATIONS
- FIGURE 3.5: GLOBAL LIGHT VEHICLE UNIT SALES
- FIGURE 3.6: ELECTRIFICATION TREND BY WORLD REGION
- FIGURE 3.7: AUTOMOTIVE SEMICONDUCTOR PRODUCTION
- FIGURE 3.8: MOBILE PHONE SHIPMENTS, WW ESTIMATES
- FIGURE 3.9: WORLDWIDE PC AND TABLET FORECAST
- FIGURE 3.10: TSMC PHOENIX CAMPUS WITH THE 2ND FAB VISIBLE IN THE BACKGROUND
- FIGURE 3.11: ESTIMATED GLOBAL FAB SPENDING 2023-2028
- FIGURE 3.12: FAB EXPANSIONS WITHIN THE US
- FIGURE 3.13: SEMICONDUCTOR CHIP MANUFACTURING REGIONS OF THE WORLD
- FIGURE 3.14: GLOBAL TOTAL EQUIPMENT SPENDING (US$ M) AND Y-O-Y CHANGE
- FIGURE 3.15: ADVANCED LOGIC DEVICE TECHNOLOGY ROADMAP OVERVIEW
- FIGURE 3.16: DRAM TECHNOLOGY ROADMAP OVERVIEW
- FIGURE 3.17: 3D NAND TECHNOLOGY ROADMAP OVERVIEW
- FIGURE 3.18: INTEL OHIO PLANT SITE AS OF FEB. 2024
- FIGURE 3.19: TECHCET WAFER START FORECAST BYNODE SEGMENTS
- FIGURE 3.20: TECHCET WORLDWIDE MATERIALS FORECAST
- FIGURE 4.1: TECHCET WAFER START FORECAST BY NODE SEGMENTS
- FIGURE 4.2: CERAMICS REVENUE FORECAST BY SEGMENT
- FIGURE 4.3: CERAMICS MARKET SHARE % BY SUPPLIER
- FIGURE 4.4: ALUMINUM NITRIDE (ALN) COMPONENTS FORECAST
- FIGURE 4.5: ALUMINUM NITRIDE (ALN) PARTS MARKET SHARE ESTIMATE
- FIGURE 4.6: AL2O3 & ALL OTHER COMPONENTS FORECAST
- FIGURE 4.7: AL2O3 & ALL OTHER PARTS MARKET SHARE ESTIMATE
- FIGURE 4.8: 99.8% AND HPA (99.99) ALUMINA COMPONENTS FORECAST
- FIGURE 4.9: SIC (ALL INCLUDING CVD) COMPONENTS FORECAST
- FIGURE 4.10: SIC (ALL INCLUDING CVD) PARTS MARKET SHARE ESTIMATE
- FIGURE 4.11: CVD-SIC COMPONENTS FORECAST
- FIGURE 4.12: CVD-SIC PARTS MARKET SHARE ESTIMATE
- FIGURE 4.13: CVD-SIC PARTS RELATIVE PRICING
- FIGURE 4.14: CERAMICS BY REGION (CORP HEADQUARTERS)
- FIGURE 4.15: CERAMICS SUPPLY CHAIN AND APPLICATION
- FIGURE 4.16: EXAMPLES OF CERAMICS USED FOR THERMAL PROCESSES
- FIGURE 4.17: EXAMPLES OF CERAMICS USED FOR DRY ETCHING
- FIGURE 4.18: EXAMPLE OF CERAMICS USED FOR CVD & EPI
- FIGURE 4.19: CERAMICS MARKET SHARE % BY SUPPLIER WITH ECHUCKS
- FIGURE 4.20: OVERVIEW OF ELECTROSTATIC CHUCK TECHNOLOGIES
- FIGURE 4.21: ELECTROSTATIC CHUCK MARKET SHARE
- FIGURE 4.22: ELECTROSTATIC CHUCK REVENUE TREND AND FORECAST
- FIGURE 4.23: 2023 CERAMICS REVENUE SHARE BY REGION
- FIGURE 4.24: 2023/2022 CHANGE IN REVENUES FOR SPECIFIC CERAMICS FABRICATORS BY HEADQUARTER COUNTRY BY REGION
- FIGURE 4.25: GLOBAL CONTAINER FREIGHT RATE INDEX
- FIGURE 4.26: ASSESSED CONTROL OF TERRAIN AROUND DONETSK
- FIGURE 4.27: YEMEN'S HOUTHI ATTACKS DISRUPTING GLOBAL SHIPPING
- FIGURE 4.28: MIDDLE EAST CONFLICT
- FIGURE 4.29: PANAMA CANAL SHIPPING
- FIGURE 4.30: GREENHOUSE GAS PROTOCOL, DETAILED CATEGORIES
- FIGURE 4.31: SCOPE 3 EMISSIONS FOR SEMICONDUCTOR COMPANIES
- FIGURE 5.1: 2023 CERAMICS SUPPLIER MARKET SHARE BY REVENUE
- FIGURE 5.2: MOST RECENT QUARTERLY CERAMICS SUPPLIER SALES
- FIGURE 5.3: MARUWA CURRENT QUARTER FINANCIALS
- FIGURE 6.1: 2023 ALUMINA ORES AND POWDERS BY REGION
- FIGURE 6.2: 2023 ALUMINA PRODUCTION BY REGION
- FIGURE 6.3: SPECIALTY ALUMINA POWDER BY SUPPLIER
TABLES
- TABLE 1.1: ELECTRONIC CERAMICS GROWTH OVERVIEW
- TABLE 1.2: ESTIMATED MARKET SHARE BY SUPPLIER
- TABLE 3.1: GLOBAL GDP AND SEMICONDUCTOR REVENUES
- TABLE 3.2: BATTERY ELECTRIC VEHICLE (BEV) REGIONAL TRENDS
- TABLE 3.3: DATA CENTER SYSTEMS AND COMMUNICATION SERVICES MARKET SPENDING 2023
- TABLE 4.1: ESTIMATED MARKET SHARE BY SUPPLIER
- TABLE 4.2: CERAMICS SUPPLIER LOCATIONS
- TABLE 4.3: OVERVIEW OF ANNOUNCED 2023/2024 CERAMIC SUPPLIER INVESTMENTS
- TABLE 4.4: ESTIMATED CERAMICS SHARE BY SUPPLIER
- TABLE 4.5: REGIONAL CERAMICS FOR SEMICONDUCTOR MANUFACTURING MARKETS
- TABLE 4.6: REGIONAL CERAMICS FOR SEMICONDUCTOR MANUFACTURING MARKETS , CONTINUED
- TABLE 5.1: 2023 CERAMICS OFFERINGS BY MATERIAL
- TABLE 5.2: NGK INSULATORS CURRENT QUARTER FINANCIALS
- TABLE 5.3: #2 KYOCERA CURRENT QUARTER FINANCIALS
- TABLE 5.4: AGC CURRENT QUARTER FINANCIALS
- TABLE 5.5: FERROTEC FINANCIALS, SEMI
- TABLE 5.6: FERROTEC CURRENT QUARTER FINANCIALS
- TABLE 6.1: PRODUCT OFFERINGS AND PURITY OF LEADING ALUMINA POWDER PRODUCERS
- TABLE 6.2: HIGH PURITY SILICON CARBIDE POWDER PRODUCERS RANKING
- TABLE 6.3: RANKING OF CERAMIC BLANK MANUFACTURERS
- TABLE 8.1: HIGH PURITY ALUMINA NITRIDE POWDER PRODUCERS RANKING

