
PUBLISHER: VDC Research Group, Inc. | PRODUCT CODE: 1927575

PUBLISHER: VDC Research Group, Inc. | PRODUCT CODE: 1927575
Automated Testing, Software Composition Analysis & SBOM Tools: AI-Augmented Analysis Takes Hold
Inside this Report
AI's impact on software development is reshaping how engineering organizations design, build, and maintain code. Generative AI and copilots effectively accelerate software development, but they also introduce novel sources of vulnerability and project risk. As a result, demand for automated testing and analysis tools with effective security and quality enforcement has grown significantly. Software composition analysis (SCA), static analysis, and dynamic testing solutions now function as critical guardrails that help engineering organizations safely access AI-enabled productivity gains without sacrificing reliability, safety, or standards compliance.
Several factors are shaping demand for automated test tools, all of which must be closely monitored and understood by tool vendors. Regulatory pressures, evolving industry standards, shifting software development philosophies, artificial intelligence, and software's growing role in safety-critical functions are all influencing the market for software verification and validation in different ways, necessitating adaptive product design and R&D investment.
This report includes an in-depth analysis of the tools, trends, and strategic considerations relevant to the market for both automated software and security testing tools as well as SCA tools. It includes market sizing and forecasts from 2024 to 2029 with segmentations by tool type (static analysis, dynamic and model-based testing, SCA), region (Americas, EMEA, APAC), enterprise versus embedded use, and individual vertical markets. To better inform strategic decisions that will yield long-term growth, this report also includes end-user insights from VDC's Voice of the Engineer survey and an analysis of the competitive landscape, which includes vendor market shares.
What Questions are Addressed?
- What factors are driving demand for AI-accelerated software testing and analysis?
- How has AI code generation changed software development and what risks does it introduce?
- Which vertical markets present the best opportunity for tool growth?
- When are changes to key coding standards taking place?
- Why are engineering organizations changing their testing strategies based on their AI usage?
- Which coding languages are growing and what is the true adoption rate of Rust in embedded?
- How have recent acquisitions shaped the competitive landscape for test and SCA tools?
Who Should Read this Report?
This report should be read by individuals making strategic decisions for marketing, product development, or competitive tactics. It is intended for senior decision makers who influence the development, sales, and use of test automation tools, including:
- CEO or other C-level executives
- Corporate development and M&A teams
- Marketing executives
- Business development and sales leaders
- Product development and product strategy leaders
- Channel management and channel strategy leaders
Organizations Listed in this Report
- AdaCore
- ANSYS
- Battery Ventures
- Black Duck Software
- Checkmarx
- Cursor
- DeepCode AI
- DXC Technology
- Eggplant
- ESI Group
- Finite State
- GitHub
- GitLab
- Hugging Face
- IBM
- JFrog
- Keysight
- LDRA
- MathWorks
- Mend
- MergeBase
- Microsoft
- NVIDIA
- OpenText
- Parasoft
- Perforce
- Phylum
- QA Systems
- Snyk
- Sonatype
- Tasking
- TrustInSoft
- Veracode
- Windsurf
- and others
Executive Summary
AI is transforming the software development lifecycle (SDLC) and the tools that developers need throughout it. Engineering organizations across vertical markets have adopted copilot-style coding assistants to automate coding tasks and help developers accelerate releases. Automated software development introduces risk, however. AI code generation engineers use several different codebases (most of which are open source), creating code fragments that may introduce license compliance or security risk. In response, demand for security-focused SCA and automated testing solutions is rising. Engineering organizations are actively counterbalancing AI-generated risk with security-oriented software testing, making software analysis and testing key components of the AI-augmented SDLC.
Test and SCA vendors have also capitalized on AI-powered productivity gains. Automatic triaging, hotspot analysis, test case generation, and remediation are points of parity in the enterprise/IT software tooling market. Embedded systems engineers have historically resisted heavy AI augmentations within testing tools. As solution vendors increasingly add predictable AI features and functionality, however, demand for AI-augmented solutions has grown across organization types. Tool vendors must continue to invest in AI features that accelerate the testing process, going beyond the shift left paradigm.
AI-enabled solutions that are deeply integrated with other tool types and platforms will lead the SCA and automated software testing market throughout the duration of the forecast. Leading vendors have made significant investments in creating solutions behind a single pane of glass that combines static analysis, dynamic test, and SCA. As a result, the market is ripe for consolidation and partnership. Single-solution vendors must seek strong technical partners in SBOM management and static analysis to fill emerging gaps in regulatory compliance and security. The SCA and test market has evolved rapidly over the past three years, necessitating aggressive R&D and partnership efforts from solution vendors as they hope to capture a larger piece of the expanding market.
Key Findings
- Global revenue for SCA and automated software and security testing tools will surpass $4.9B in 2029.
- Aerospace and defense passed automotive as the largest vertical market due to significant increases in defense spending across the globe and a slowdown in the European automotive industry.
- The EU Cyber Resilience Act enforcement will continue to drive demand for SCA tools that offer SBOM generation and management across engineering teams.
- Demand for platform offerings and deep integrations with other tool types is growing as DevOps continues to reshape software development.
- Organizations using AI-generated code place significantly higher value on security features in testing tools than organizations that have not yet considered or integrated AI code generation.
- Vendor satisfaction ratings continue to change as end-user needs evolve alongside software development practices.
Report Excerpt
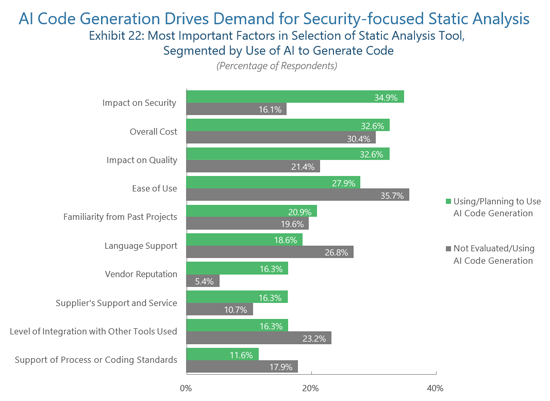
Engineers who are currently using AI to generate code in their projects evaluate static analysis tools through a different lens than their counterparts, placing proportionally higher value on security and quality assurance. Since AI-generated code can introduce new and potentially complex vulnerabilities, engineering organizations using AI to generate code prioritize tools that can effectively vet machine-generated software. Conversely, engineering organizations not using AI code generation agree with their AI-accelerated peers about cost but favored ease of use, language support, and level of integration with other tools. This data reflects a more conventional development approach where teams rely on in-house code and use less automation across the toolchain, but it also demonstrates the caution toward AI-generated code across software development organizations. Furthermore, organizations using AI code generation valued vendor brand reputation significantly more. To counterbalance AI-introduced risk, engineering organizations prefer proven solutions from organizations with a history of delivering high quality tools.
As AI adoption increases, security-focused tooling will hold greater importance. Static analysis tools specially designed to identify AI-generated vulnerabilities or risks early in the development cycle will gain market share over the forecast period.
Table of Contents
Inside this Report
What Questions are Addressed?
Who Should Read this Report?
Organizations Mentioned in this Report
Executive Summary
- Key Findings
Global Market Overview
- Static Analysis Tools
- Dynamic/Model-based Testing
- Security-focused Static Analysis
- Software Composition Analysis
- Platform Solutions
- Mergers & Acquisitions
- Language Usage
- Generative AI for Software Testing
Regional Trends & Forecast
Vertical Market Trends & Forecast
End-User Insights
- Most Important Factors in Selection of Static Analysis Tool Segmented by Use of AI to Generate Code
- Most Important Factors in Selection of Dynamic Testing Tools Segmented by Use of AI to Generate Code
- Typical Decision Maker for Purchase of Static Analysis & Dynamic Test Tools
- Usage Rates of Static Analysis, Dynamic Test & SCA in the Cloud
- Static Analysis Vendor Performance Ratings
- Dynamic/Model-based Test Vendor Performance Ratings
- SCA Vendor Performance Ratings
Competitive Landscape
Vendor & Technology Provider Profiles
- AdaCore
- Black Duck
- Checkmarx
- IBM
- Keysight
- LDRA
- MathWorks
- Mend
- OpenText
- Parasoft
- Perforce
- QA Systems
- Snyk
- Sonatype
- TrustInSoft
About the
Authors About
VDC Research
List of Exhibits
- Exhibit 1 Global Software and Security Testing Tools Revenue Segmented by Market Type
- Exhibit 2 Global Static Analysis Tools Revenue Segmented by Market Type
- Exhibit 3 Global Dynamic and Model-Based Test Tools Revenue Segmented by Market Type
- Exhibit 4 Global Market for Security-focused Static Analysis Tools Segmented by Market
- Exhibit 5 Global Revenue of Software Composition Analysis Tools & Related Services Segmented by Market Type
- Exhibit 6 Current State of AI and Automation in the SCA Market
- Exhibit 7 Usage of C, Ada, and Rust Code
- Exhibit 8 Current AI/Automation Capabilities and Features of Leading Test Tool Vendors
- Exhibit 9 Americas Market for SCA and Testing Tools Segmented by Tool Type
- Exhibit 10 Europe, Middle East, and Africa Market for SCA and Testing Tools Segmented by Tool Type
- Exhibit 11 Asia-Pacific Market for SCA and Testing Tools Segmented by Tool Type
- Exhibit 12 Worldwide Shipments of Software and Security Testing Tools Segmented by Customer Type
- Exhibit 13 IoT/Embedded Static Analysis Tools Market Segmented by Vertical
- Exhibit 14 IoT/Embedded Dynamic and Model-Based Testing Tools Market Segmented by Vertical
- Exhibit 15 IoT/Embedded SCA Tools Segmented by Vertical
- Exhibit 16 IoT/Embedded Static Analysis Tools, 2024 Market Share
- Exhibit 17 Enterprise/IT Static Analysis Tools, 2024 Market Share
- Exhibit 18 IoT/Embedded Dynamic and Model-based Testing Tools, 2024 Market Share
- Exhibit 19 Enterprise/IT Dynamic and Model-based Testing Tools, 2024 Market Share
- Exhibit 20 IoT/Embedded SCA Tools, 2024 Market Share
- Exhibit 21 Enterprise/IT SCA Tools, 2024 Market Share
- Exhibit 22 Most Important Factors in Selection of Static Analysis Tool Segmented by AI-generated Code Usage
- Exhibit 23 Most Important Factors in Selection of Dynamic Testing Tools Segmented by AI-generated Code Usage
- Exhibit 24 Most Important Factors in Selection of SCA Tool Segmented by AI-generated Code Usage
- Exhibit 25 Typical Decision Maker for Purchase of Static Analysis and Dynamic Test Tools
- Exhibit 26 Usage Rates of Static Analysis, Dynamic Test, and SCA in the Cloud
- Exhibit 27 Static Analysis Vendor Performance Ratings
- Exhibit 28 Dynamic/Model-based Test Vendor Performance Ratings
- Exhibit 29 SCA Vendor Performance Ratings
IoT & Embedded Engineering Survey
- Exhibit 244 Types of Tools Used in Current/Most Recently Completed Project
- Exhibit 254 Types of Static Analysis or SAST Being Used on Current Project
- Exhibit 305 Perceived Investment Value of Dynamic Analysis or DAST Product Used
- Exhibit 309 Perceived Difficulty to Learn the Use of Dynamic Analysis or DAST Product
- Exhibit 340 Perceived Investment Value of Software Composition Analysis or IP Compliance Tool Used
- Exhibit 341 Perceived Impact on the Quality of the End Product Being Engineered from SCA or IP Compliance Tool Used
- Exhibit 343 Perceived Likeliness to Use the Same Brand of SCA or IP Compliance Tool For the Next Project of Similar Type
- Exhibit 385 Consideration/Use of AI-generated Software/Code (e.g., Use of Copilot and/or Prompt-based Code Creation)
- Exhibit 386 Expected Changes in Use of AI-generated Software in the Next Three years
- Exhibit 387 Amount of Trust in AI-generated Software Code (Functionality, Security, IP, etc.)
- Exhibit 388 Current Concerns About AI-generated Software Code
- Exhibit 405 IoT Cloud Platforms-as-a-Service (PaaS) Being Used on Current or Most Recent Project

