
PUBLISHER: 360iResearch | PRODUCT CODE: 1413855

PUBLISHER: 360iResearch | PRODUCT CODE: 1413855
Asparagine Market by Type (Asparagine Anhydrous, Asparagine Monohydrate), Application (Food & Beverage, Pharmaceutical) - Global Forecast 2024-2030
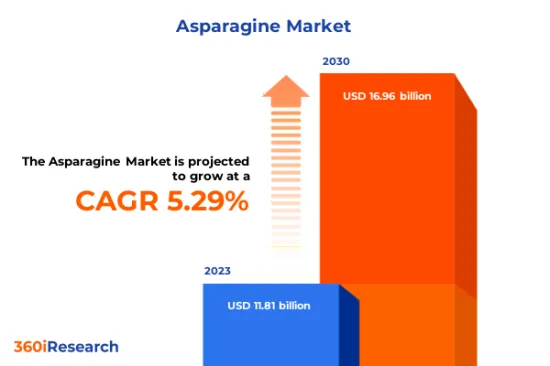
[183 Pages Report] The Asparagine Market size was estimated at USD 11.81 billion in 2023 and expected to reach USD 12.40 billion in 2024, at a CAGR 5.29% to reach USD 16.96 billion by 2030.
Global Asparagine Market
| KEY MARKET STATISTICS | |
|---|---|
| Base Year [2023] | USD 11.81 billion |
| Estimated Year [2024] | USD 12.40 billion |
| Forecast Year [2030] | USD 16.96 billion |
| CAGR (%) | 5.29% |
Asparagine, an amino acid, plays a fundamental role in the biosynthesis of proteins. It is an essential component required for the development and functioning of the brain and is a precursor to neurotransmitters. The asparagine market spans various industries, including biotechnology, food and beverage, pharmaceuticals, and animal feed, showcasing its broad spectrum of utilizations. Analyzing the market requires insights into its applications, end-uses, market scope, growth opportunity factors, limitations, and potential areas of innovation. Rising health consciousness for dietary supplements and increased investment in R&D in the pharmaceutical industry are driving the market growth. Ongoing innovations in the food and beverage industry are also propelling the market. Fluctuations in the prices of raw materials and stringent regulations and standards regarding the use of asparagine are restricting market growth. The development of novel pharmaceutical formulations containing asparagine and the rise in precision medicine and targeted therapies are expected to create opportunities in the market.
Regional Insights
The Asparagine market in the Americas is characterized by advanced biotechnology sectors, particularly in North America. The United States produces and consumes Asparagine, predominantly for the pharmaceuticals and food industries. South America's market is emerging, with Brazil showing increasing demand for Asparagine in food additive applications and research. Stringent regulations on North American food additives and clinical nutrition bolster the demand for high-purity Asparagine. The Asia-Pacific, led by China, Japan, and India, has a rapidly expanding asparagine market due to its growing pharmaceutical, food, and beverage industries. China's large-scale manufacturing capabilities make it a significant supplier of Asparagine domestically and globally. The region is witnessing growth in nutrition and health supplement sectors, driving the need for amino acids such as Asparagine. The evolving regulatory landscape and increasing consumer health consciousness further shape the market dynamics. In EMEA, Europe leads with a mature market for Asparagine, particularly within the pharmaceutical and nutraceutical industries. The steadily aging population contributes to the region's significant demand for dietary supplements and parenteral nutrition, which includes Asparagine. The market needs to be developed in the Middle East and Africa but presents potential for growth with rising health awareness and changing dietary habits.
FPNV Positioning Matrix
The FPNV Positioning Matrix is pivotal in evaluating the Asparagine Market. It offers a comprehensive assessment of vendors, examining key metrics related to Business Strategy and Product Satisfaction. This in-depth analysis empowers users to make well-informed decisions aligned with their requirements. Based on the evaluation, the vendors are then categorized into four distinct quadrants representing varying levels of success: Forefront (F), Pathfinder (P), Niche (N), or Vital (V).
Market Share Analysis
The Market Share Analysis is a comprehensive tool that provides an insightful and in-depth examination of the current state of vendors in the Asparagine Market. By meticulously comparing and analyzing vendor contributions in terms of overall revenue, customer base, and other key metrics, we can offer companies a greater understanding of their performance and the challenges they face when competing for market share. Additionally, this analysis provides valuable insights into the competitive nature of the sector, including factors such as accumulation, fragmentation dominance, and amalgamation traits observed over the base year period studied. With this expanded level of detail, vendors can make more informed decisions and devise effective strategies to gain a competitive edge in the market.
Key Company Profiles
The report delves into recent significant developments in the Asparagine Market, highlighting leading vendors and their innovative profiles. These include BioVendor Group, Creative Enzymes, Duchefa Biochemie B.V., Jazz Pharmaceuticals, Inc., LGC Limited, medac GmbH, Merck KGaA, MP Biomedicals, LLC, Porton Biopharma Limited, Taj Pharmaceuticals Ltd., Tokyo Chemical Industry (India) Pvt. Ltd., and VWR International, LLC.
Market Segmentation & Coverage
This research report categorizes the Asparagine Market to forecast the revenues and analyze trends in each of the following sub-markets:
- Type
- Asparagine Anhydrous
- Asparagine Monohydrate
- Application
- Food & Beverage
- Pharmaceutical
- Region
- Americas
- Argentina
- Brazil
- Canada
- Mexico
- United States
- California
- Florida
- Illinois
- New York
- Ohio
- Pennsylvania
- Texas
- Asia-Pacific
- Australia
- China
- India
- Indonesia
- Japan
- Malaysia
- Philippines
- Singapore
- South Korea
- Taiwan
- Thailand
- Vietnam
- Europe, Middle East & Africa
- Denmark
- Egypt
- Finland
- France
- Germany
- Israel
- Italy
- Netherlands
- Nigeria
- Norway
- Poland
- Qatar
- Russia
- Saudi Arabia
- South Africa
- Spain
- Sweden
- Switzerland
- Turkey
- United Arab Emirates
- United Kingdom
- Americas
The report offers valuable insights on the following aspects:
1. Market Penetration: It presents comprehensive information on the market provided by key players.
2. Market Development: It delves deep into lucrative emerging markets and analyzes the penetration across mature market segments.
3. Market Diversification: It provides detailed information on new product launches, untapped geographic regions, recent developments, and investments.
4. Competitive Assessment & Intelligence: It conducts an exhaustive assessment of market shares, strategies, products, certifications, regulatory approvals, patent landscape, and manufacturing capabilities of the leading players.
5. Product Development & Innovation: It offers intelligent insights on future technologies, R&D activities, and breakthrough product developments.
The report addresses key questions such as:
1. What is the market size and forecast of the Asparagine Market?
2. Which products, segments, applications, and areas should one consider investing in over the forecast period in the Asparagine Market?
3. What are the technology trends and regulatory frameworks in the Asparagine Market?
4. What is the market share of the leading vendors in the Asparagine Market?
5. Which modes and strategic moves are suitable for entering the Asparagine Market?
Table of Contents
1. Preface
- 1.1. Objectives of the Study
- 1.2. Market Segmentation & Coverage
- 1.3. Years Considered for the Study
- 1.4. Currency & Pricing
- 1.5. Language
- 1.6. Limitations
- 1.7. Assumptions
- 1.8. Stakeholders
2. Research Methodology
- 2.1. Define: Research Objective
- 2.2. Determine: Research Design
- 2.3. Prepare: Research Instrument
- 2.4. Collect: Data Source
- 2.5. Analyze: Data Interpretation
- 2.6. Formulate: Data Verification
- 2.7. Publish: Research Report
- 2.8. Repeat: Report Update
3. Executive Summary
4. Market Overview
- 4.1. Introduction
- 4.2. Asparagine Market, by Region
5. Market Insights
- 5.1. Market Dynamics
- 5.1.1. Drivers
- 5.1.1.1. Rising health consciousness and demand for dietary supplements
- 5.1.1.2. Increased investment for R&D in pharmaceutical industry
- 5.1.1.3. Ongoing innovations in the food and beverage industry
- 5.1.2. Restraints
- 5.1.2.1. Fluctuations in prices of raw materials
- 5.1.3. Opportunities
- 5.1.3.1. Development of novel pharmaceutical formulations containing asparagine.
- 5.1.3.2. Rise in precision medicine and targeted therapies
- 5.1.4. Challenges
- 5.1.4.1. Stringent regulations and standards regarding the use of asparagine
- 5.1.1. Drivers
- 5.2. Market Segmentation Analysis
- 5.2.1. Type:Growing demand for Anhydrous asparagine in dry-blending nutritional formulations
- 5.2.2. Application: Rising usage of Asparagine for enhancing nutritional value and flavor profiles of products
- 5.3. Market Trend Analysis
- 5.4. Cumulative Impact of High Inflation
- 5.5. Porter's Five Forces Analysis
- 5.5.1. Threat of New Entrants
- 5.5.2. Threat of Substitutes
- 5.5.3. Bargaining Power of Customers
- 5.5.4. Bargaining Power of Suppliers
- 5.5.5. Industry Rivalry
- 5.6. Value Chain & Critical Path Analysis
- 5.7. Regulatory Framework
6. Asparagine Market, by Type
- 6.1. Introduction
- 6.2. Asparagine Anhydrous
- 6.3. Asparagine Monohydrate
7. Asparagine Market, by Application
- 7.1. Introduction
- 7.2. Food & Beverage
- 7.3. Pharmaceutical
8. Americas Asparagine Market
- 8.1. Introduction
- 8.2. Argentina
- 8.3. Brazil
- 8.4. Canada
- 8.5. Mexico
- 8.6. United States
9. Asia-Pacific Asparagine Market
- 9.1. Introduction
- 9.2. Australia
- 9.3. China
- 9.4. India
- 9.5. Indonesia
- 9.6. Japan
- 9.7. Malaysia
- 9.8. Philippines
- 9.9. Singapore
- 9.10. South Korea
- 9.11. Taiwan
- 9.12. Thailand
- 9.13. Vietnam
10. Europe, Middle East & Africa Asparagine Market
- 10.1. Introduction
- 10.2. Denmark
- 10.3. Egypt
- 10.4. Finland
- 10.5. France
- 10.6. Germany
- 10.7. Israel
- 10.8. Italy
- 10.9. Netherlands
- 10.10. Nigeria
- 10.11. Norway
- 10.12. Poland
- 10.13. Qatar
- 10.14. Russia
- 10.15. Saudi Arabia
- 10.16. South Africa
- 10.17. Spain
- 10.18. Sweden
- 10.19. Switzerland
- 10.20. Turkey
- 10.21. United Arab Emirates
- 10.22. United Kingdom
11. Competitive Landscape
- 11.1. FPNV Positioning Matrix
- 11.2. Market Share Analysis, By Key Player
- 11.3. Competitive Scenario Analysis, By Key Player
- 11.3.1. Agreement, Collaboration, & Partnership
- 11.3.1.1. Kaimisi New Material and Bicells to build 2,000 t per year L-asparagine project and 100 t per year GABA project
- 11.3.2. Award, Recognition, & Expansion
- 11.3.2.1. Jazz Pharmaceuticals Receives European Commission Approval for Enrylaze (a recombinant Erwinia asparaginase or crisantaspase) for the Treatment of Acute Lymphoblastic Leukemia and Lymphoblastic Lymphoma
- 11.3.1. Agreement, Collaboration, & Partnership
12. Competitive Portfolio
- 12.1. Key Company Profiles
- 12.1.1. BioVendor Group
- 12.1.2. Creative Enzymes
- 12.1.3. Duchefa Biochemie B.V.
- 12.1.4. Jazz Pharmaceuticals, Inc.
- 12.1.5. LGC Limited
- 12.1.6. medac GmbH
- 12.1.7. Merck KGaA
- 12.1.8. MP Biomedicals, LLC
- 12.1.9. Porton Biopharma Limited
- 12.1.10. Taj Pharmaceuticals Ltd.
- 12.1.11. Tokyo Chemical Industry (India) Pvt. Ltd.
- 12.1.12. VWR International, LLC
- 12.2. Key Product Portfolio
13. Appendix
- 13.1. Discussion Guide
- 13.2. License & Pricing
LIST OF FIGURES
- FIGURE 1. ASPARAGINE MARKET RESEARCH PROCESS
- FIGURE 2. ASPARAGINE MARKET SIZE, 2023 VS 2030
- FIGURE 3. ASPARAGINE MARKET SIZE, 2018-2030 (USD MILLION)
- FIGURE 4. ASPARAGINE MARKET SIZE, BY REGION, 2023 VS 2030 (%)
- FIGURE 5. ASPARAGINE MARKET SIZE, BY REGION, 2023 VS 2024 VS 2030 (USD MILLION)
- FIGURE 6. ASPARAGINE MARKET DYNAMICS
- FIGURE 7. ASPARAGINE MARKET SIZE, BY TYPE, 2023 VS 2030 (%)
- FIGURE 8. ASPARAGINE MARKET SIZE, BY TYPE, 2023 VS 2024 VS 2030 (USD MILLION)
- FIGURE 9. ASPARAGINE MARKET SIZE, BY APPLICATION, 2023 VS 2030 (%)
- FIGURE 10. ASPARAGINE MARKET SIZE, BY APPLICATION, 2023 VS 2024 VS 2030 (USD MILLION)
- FIGURE 11. AMERICAS ASPARAGINE MARKET SIZE, BY COUNTRY, 2023 VS 2030 (%)
- FIGURE 12. AMERICAS ASPARAGINE MARKET SIZE, BY COUNTRY, 2023 VS 2024 VS 2030 (USD MILLION)
- FIGURE 13. UNITED STATES ASPARAGINE MARKET SIZE, BY STATE, 2023 VS 2030 (%)
- FIGURE 14. UNITED STATES ASPARAGINE MARKET SIZE, BY STATE, 2023 VS 2024 VS 2030 (USD MILLION)
- FIGURE 15. ASIA-PACIFIC ASPARAGINE MARKET SIZE, BY COUNTRY, 2023 VS 2030 (%)
- FIGURE 16. ASIA-PACIFIC ASPARAGINE MARKET SIZE, BY COUNTRY, 2023 VS 2024 VS 2030 (USD MILLION)
- FIGURE 17. EUROPE, MIDDLE EAST & AFRICA ASPARAGINE MARKET SIZE, BY COUNTRY, 2023 VS 2030 (%)
- FIGURE 18. EUROPE, MIDDLE EAST & AFRICA ASPARAGINE MARKET SIZE, BY COUNTRY, 2023 VS 2024 VS 2030 (USD MILLION)
- FIGURE 19. ASPARAGINE MARKET, FPNV POSITIONING MATRIX, 2023
- FIGURE 20. ASPARAGINE MARKET SHARE, BY KEY PLAYER, 2023
LIST OF TABLES
- TABLE 1. ASPARAGINE MARKET SEGMENTATION & COVERAGE
- TABLE 2. UNITED STATES DOLLAR EXCHANGE RATE, 2018-2023
- TABLE 3. ASPARAGINE MARKET SIZE, 2018-2030 (USD MILLION)
- TABLE 4. GLOBAL ASPARAGINE MARKET SIZE, BY REGION, 2018-2030 (USD MILLION)
- TABLE 5. ASPARAGINE MARKET SIZE, BY TYPE, 2018-2030 (USD MILLION)
- TABLE 6. ASPARAGINE MARKET SIZE, BY ASPARAGINE ANHYDROUS, BY REGION, 2018-2030 (USD MILLION)
- TABLE 7. ASPARAGINE MARKET SIZE, BY ASPARAGINE MONOHYDRATE, BY REGION, 2018-2030 (USD MILLION)
- TABLE 8. ASPARAGINE MARKET SIZE, BY APPLICATION, 2018-2030 (USD MILLION)
- TABLE 9. ASPARAGINE MARKET SIZE, BY FOOD & BEVERAGE, BY REGION, 2018-2030 (USD MILLION)
- TABLE 10. ASPARAGINE MARKET SIZE, BY PHARMACEUTICAL, BY REGION, 2018-2030 (USD MILLION)
- TABLE 11. AMERICAS ASPARAGINE MARKET SIZE, BY TYPE, 2018-2030 (USD MILLION)
- TABLE 12. AMERICAS ASPARAGINE MARKET SIZE, BY APPLICATION, 2018-2030 (USD MILLION)
- TABLE 13. AMERICAS ASPARAGINE MARKET SIZE, BY COUNTRY, 2018-2030 (USD MILLION)
- TABLE 14. ARGENTINA ASPARAGINE MARKET SIZE, BY TYPE, 2018-2030 (USD MILLION)
- TABLE 15. ARGENTINA ASPARAGINE MARKET SIZE, BY APPLICATION, 2018-2030 (USD MILLION)
- TABLE 16. BRAZIL ASPARAGINE MARKET SIZE, BY TYPE, 2018-2030 (USD MILLION)
- TABLE 17. BRAZIL ASPARAGINE MARKET SIZE, BY APPLICATION, 2018-2030 (USD MILLION)
- TABLE 18. CANADA ASPARAGINE MARKET SIZE, BY TYPE, 2018-2030 (USD MILLION)
- TABLE 19. CANADA ASPARAGINE MARKET SIZE, BY APPLICATION, 2018-2030 (USD MILLION)
- TABLE 20. MEXICO ASPARAGINE MARKET SIZE, BY TYPE, 2018-2030 (USD MILLION)
- TABLE 21. MEXICO ASPARAGINE MARKET SIZE, BY APPLICATION, 2018-2030 (USD MILLION)
- TABLE 22. UNITED STATES ASPARAGINE MARKET SIZE, BY TYPE, 2018-2030 (USD MILLION)
- TABLE 23. UNITED STATES ASPARAGINE MARKET SIZE, BY APPLICATION, 2018-2030 (USD MILLION)
- TABLE 24. UNITED STATES ASPARAGINE MARKET SIZE, BY STATE, 2018-2030 (USD MILLION)
- TABLE 25. ASIA-PACIFIC ASPARAGINE MARKET SIZE, BY TYPE, 2018-2030 (USD MILLION)
- TABLE 26. ASIA-PACIFIC ASPARAGINE MARKET SIZE, BY APPLICATION, 2018-2030 (USD MILLION)
- TABLE 27. ASIA-PACIFIC ASPARAGINE MARKET SIZE, BY COUNTRY, 2018-2030 (USD MILLION)
- TABLE 28. AUSTRALIA ASPARAGINE MARKET SIZE, BY TYPE, 2018-2030 (USD MILLION)
- TABLE 29. AUSTRALIA ASPARAGINE MARKET SIZE, BY APPLICATION, 2018-2030 (USD MILLION)
- TABLE 30. CHINA ASPARAGINE MARKET SIZE, BY TYPE, 2018-2030 (USD MILLION)
- TABLE 31. CHINA ASPARAGINE MARKET SIZE, BY APPLICATION, 2018-2030 (USD MILLION)
- TABLE 32. INDIA ASPARAGINE MARKET SIZE, BY TYPE, 2018-2030 (USD MILLION)
- TABLE 33. INDIA ASPARAGINE MARKET SIZE, BY APPLICATION, 2018-2030 (USD MILLION)
- TABLE 34. INDONESIA ASPARAGINE MARKET SIZE, BY TYPE, 2018-2030 (USD MILLION)
- TABLE 35. INDONESIA ASPARAGINE MARKET SIZE, BY APPLICATION, 2018-2030 (USD MILLION)
- TABLE 36. JAPAN ASPARAGINE MARKET SIZE, BY TYPE, 2018-2030 (USD MILLION)
- TABLE 37. JAPAN ASPARAGINE MARKET SIZE, BY APPLICATION, 2018-2030 (USD MILLION)
- TABLE 38. MALAYSIA ASPARAGINE MARKET SIZE, BY TYPE, 2018-2030 (USD MILLION)
- TABLE 39. MALAYSIA ASPARAGINE MARKET SIZE, BY APPLICATION, 2018-2030 (USD MILLION)
- TABLE 40. PHILIPPINES ASPARAGINE MARKET SIZE, BY TYPE, 2018-2030 (USD MILLION)
- TABLE 41. PHILIPPINES ASPARAGINE MARKET SIZE, BY APPLICATION, 2018-2030 (USD MILLION)
- TABLE 42. SINGAPORE ASPARAGINE MARKET SIZE, BY TYPE, 2018-2030 (USD MILLION)
- TABLE 43. SINGAPORE ASPARAGINE MARKET SIZE, BY APPLICATION, 2018-2030 (USD MILLION)
- TABLE 44. SOUTH KOREA ASPARAGINE MARKET SIZE, BY TYPE, 2018-2030 (USD MILLION)
- TABLE 45. SOUTH KOREA ASPARAGINE MARKET SIZE, BY APPLICATION, 2018-2030 (USD MILLION)
- TABLE 46. TAIWAN ASPARAGINE MARKET SIZE, BY TYPE, 2018-2030 (USD MILLION)
- TABLE 47. TAIWAN ASPARAGINE MARKET SIZE, BY APPLICATION, 2018-2030 (USD MILLION)
- TABLE 48. THAILAND ASPARAGINE MARKET SIZE, BY TYPE, 2018-2030 (USD MILLION)
- TABLE 49. THAILAND ASPARAGINE MARKET SIZE, BY APPLICATION, 2018-2030 (USD MILLION)
- TABLE 50. VIETNAM ASPARAGINE MARKET SIZE, BY TYPE, 2018-2030 (USD MILLION)
- TABLE 51. VIETNAM ASPARAGINE MARKET SIZE, BY APPLICATION, 2018-2030 (USD MILLION)
- TABLE 52. EUROPE, MIDDLE EAST & AFRICA ASPARAGINE MARKET SIZE, BY TYPE, 2018-2030 (USD MILLION)
- TABLE 53. EUROPE, MIDDLE EAST & AFRICA ASPARAGINE MARKET SIZE, BY APPLICATION, 2018-2030 (USD MILLION)
- TABLE 54. EUROPE, MIDDLE EAST & AFRICA ASPARAGINE MARKET SIZE, BY COUNTRY, 2018-2030 (USD MILLION)
- TABLE 55. DENMARK ASPARAGINE MARKET SIZE, BY TYPE, 2018-2030 (USD MILLION)
- TABLE 56. DENMARK ASPARAGINE MARKET SIZE, BY APPLICATION, 2018-2030 (USD MILLION)
- TABLE 57. EGYPT ASPARAGINE MARKET SIZE, BY TYPE, 2018-2030 (USD MILLION)
- TABLE 58. EGYPT ASPARAGINE MARKET SIZE, BY APPLICATION, 2018-2030 (USD MILLION)
- TABLE 59. FINLAND ASPARAGINE MARKET SIZE, BY TYPE, 2018-2030 (USD MILLION)
- TABLE 60. FINLAND ASPARAGINE MARKET SIZE, BY APPLICATION, 2018-2030 (USD MILLION)
- TABLE 61. FRANCE ASPARAGINE MARKET SIZE, BY TYPE, 2018-2030 (USD MILLION)
- TABLE 62. FRANCE ASPARAGINE MARKET SIZE, BY APPLICATION, 2018-2030 (USD MILLION)
- TABLE 63. GERMANY ASPARAGINE MARKET SIZE, BY TYPE, 2018-2030 (USD MILLION)
- TABLE 64. GERMANY ASPARAGINE MARKET SIZE, BY APPLICATION, 2018-2030 (USD MILLION)
- TABLE 65. ISRAEL ASPARAGINE MARKET SIZE, BY TYPE, 2018-2030 (USD MILLION)
- TABLE 66. ISRAEL ASPARAGINE MARKET SIZE, BY APPLICATION, 2018-2030 (USD MILLION)
- TABLE 67. ITALY ASPARAGINE MARKET SIZE, BY TYPE, 2018-2030 (USD MILLION)
- TABLE 68. ITALY ASPARAGINE MARKET SIZE, BY APPLICATION, 2018-2030 (USD MILLION)
- TABLE 69. NETHERLANDS ASPARAGINE MARKET SIZE, BY TYPE, 2018-2030 (USD MILLION)
- TABLE 70. NETHERLANDS ASPARAGINE MARKET SIZE, BY APPLICATION, 2018-2030 (USD MILLION)
- TABLE 71. NIGERIA ASPARAGINE MARKET SIZE, BY TYPE, 2018-2030 (USD MILLION)
- TABLE 72. NIGERIA ASPARAGINE MARKET SIZE, BY APPLICATION, 2018-2030 (USD MILLION)
- TABLE 73. NORWAY ASPARAGINE MARKET SIZE, BY TYPE, 2018-2030 (USD MILLION)
- TABLE 74. NORWAY ASPARAGINE MARKET SIZE, BY APPLICATION, 2018-2030 (USD MILLION)
- TABLE 75. POLAND ASPARAGINE MARKET SIZE, BY TYPE, 2018-2030 (USD MILLION)
- TABLE 76. POLAND ASPARAGINE MARKET SIZE, BY APPLICATION, 2018-2030 (USD MILLION)
- TABLE 77. QATAR ASPARAGINE MARKET SIZE, BY TYPE, 2018-2030 (USD MILLION)
- TABLE 78. QATAR ASPARAGINE MARKET SIZE, BY APPLICATION, 2018-2030 (USD MILLION)
- TABLE 79. RUSSIA ASPARAGINE MARKET SIZE, BY TYPE, 2018-2030 (USD MILLION)
- TABLE 80. RUSSIA ASPARAGINE MARKET SIZE, BY APPLICATION, 2018-2030 (USD MILLION)
- TABLE 81. SAUDI ARABIA ASPARAGINE MARKET SIZE, BY TYPE, 2018-2030 (USD MILLION)
- TABLE 82. SAUDI ARABIA ASPARAGINE MARKET SIZE, BY APPLICATION, 2018-2030 (USD MILLION)
- TABLE 83. SOUTH AFRICA ASPARAGINE MARKET SIZE, BY TYPE, 2018-2030 (USD MILLION)
- TABLE 84. SOUTH AFRICA ASPARAGINE MARKET SIZE, BY APPLICATION, 2018-2030 (USD MILLION)
- TABLE 85. SPAIN ASPARAGINE MARKET SIZE, BY TYPE, 2018-2030 (USD MILLION)
- TABLE 86. SPAIN ASPARAGINE MARKET SIZE, BY APPLICATION, 2018-2030 (USD MILLION)
- TABLE 87. SWEDEN ASPARAGINE MARKET SIZE, BY TYPE, 2018-2030 (USD MILLION)
- TABLE 88. SWEDEN ASPARAGINE MARKET SIZE, BY APPLICATION, 2018-2030 (USD MILLION)
- TABLE 89. SWITZERLAND ASPARAGINE MARKET SIZE, BY TYPE, 2018-2030 (USD MILLION)
- TABLE 90. SWITZERLAND ASPARAGINE MARKET SIZE, BY APPLICATION, 2018-2030 (USD MILLION)
- TABLE 91. TURKEY ASPARAGINE MARKET SIZE, BY TYPE, 2018-2030 (USD MILLION)
- TABLE 92. TURKEY ASPARAGINE MARKET SIZE, BY APPLICATION, 2018-2030 (USD MILLION)
- TABLE 93. UNITED ARAB EMIRATES ASPARAGINE MARKET SIZE, BY TYPE, 2018-2030 (USD MILLION)
- TABLE 94. UNITED ARAB EMIRATES ASPARAGINE MARKET SIZE, BY APPLICATION, 2018-2030 (USD MILLION)
- TABLE 95. UNITED KINGDOM ASPARAGINE MARKET SIZE, BY TYPE, 2018-2030 (USD MILLION)
- TABLE 96. UNITED KINGDOM ASPARAGINE MARKET SIZE, BY APPLICATION, 2018-2030 (USD MILLION)
- TABLE 97. ASPARAGINE MARKET, FPNV POSITIONING MATRIX, 2023
- TABLE 98. ASPARAGINE MARKET SHARE, BY KEY PLAYER, 2023
- TABLE 99. ASPARAGINE MARKET LICENSE & PRICING

