
PUBLISHER: Allied Market Research | PRODUCT CODE: 1298188

PUBLISHER: Allied Market Research | PRODUCT CODE: 1298188
Seaweed Market By Product (Red, Brown, Green), By Application (Human Food, Hydrocolloids, Fertilizers, Animal Feed Additives, Others): Global Opportunity Analysis and Industry Forecast, 2021-2031
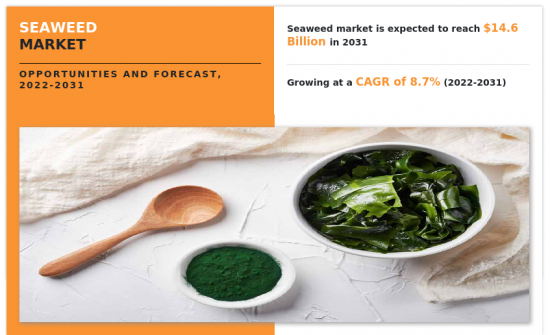
The seaweed market size was valued at $6,471.9 million in 2021 and is estimated to reach $14,613.1 million by 2031, registering a CAGR of 8.7% from 2022 to 2031.
Seaweed is a plant-like organism, which is adhered to rock or other hard substrata in coastal areas. Based on the pigmentation, seaweeds are categorized into three broad groups, red, brown, and green. Botanists refer to these broad groups as phaeophyceae, rhodophyceae, and chlorophyceae, respectively. Seaweeds are macroalgae that differentiate them from microalgae, which are microscopic in size, and are often unicellular. Red and brown seaweeds are mostly found in marine water, whereas green seaweeds grow in freshwater. Seaweeds are used in many maritime countries across the globe as a source of human food, hydrocolloids, fertilizers, animal feed additives, and others, including aquaculture, biomass for fuel, and wastewater treatment. The major utilization of these seaweeds as food and food ingredients is in the Asia-Pacific region, particularly in China, Indonesia, the Philippines, Korea, and Japan where seaweed cultivation has developed into a huge industry.
Hydrocolloid polysaccharides have significant importance, both technologically and economically, since they are used in the food, pharmaceutical, medicinal, and biotechnological industries, due to their distinct physicochemical properties. An increase in demand for seaweeds in the manufacture of hydrocolloids, such as agar, alginate, and carrageenan, is anticipated to boost the adoption of seaweeds during the forecast period. Moreover, they are applicable in human food, hydrocolloids, fertilizers, animal feed additives, aquaculture, biofuel, and wastewater treatment, which increases their consumption. Untapped markets in North American and European countries are anticipated to open new opportunities for seaweed manufacturers, thereby driving market growth. However, volatility in the prices of seaweed due to unstable supply and constant changes in weather patterns hamper the market growth.
For the purpose of analysis, the seaweed market scope covers segmentation based on product, application, and region. The report provides information on various products including red, brown, and green. Furthermore, the major applications covered in the study include human food, hydrocolloids, fertilizers, animal feed additives, and others. In addition, it analyzes the current market trends across different regions such as North America (the U.S., Canada, and Mexico), Europe (UK, Germany, France, Italy, Spain, Denmark, and the Rest of Europe), Asia-Pacific (China, Indonesia, Philippines, South Korea, Japan, and Rest of Asia-Pacific), and LAMEA (Saudi Arabia, UAE, South Africa, Tanzania, and Rest of LAMEA).
Seaweeds have long been used as animal feed. Seaweed's chemical make-up varies greatly. Compared to brown seaweeds, green and red seaweeds have higher protein content but lower mineral content. Seaweeds can help animals meet their needs for protein and energy.
The major players operating in the seaweed industry are: Cargill, Incorporated, Chase Organics, CJ CheilJedang Corp. , DowDupont Inc., GimMe Health Foods LLC, Groupe Roullier, Irish Seaweeds, Maine Coast Sea Vegetables, Inc., Mara Seaweed, and Qingdao Gather Great Ocean Algae Industry Group Co. Ltd.
Key Benefits For Stakeholders
- This report provides a quantitative analysis of the market segments, current trends, estimations, and dynamics of the seaweed market analysis from 2021 to 2031 to identify the prevailing seaweed market opportunities.
- The market research is offered along with information related to key drivers, restraints, and opportunities.
- Porter's five forces analysis highlights the potency of buyers and suppliers to enable stakeholders make profit-oriented business decisions and strengthen their supplier-buyer network.
- In-depth analysis of the seaweed market segmentation assists to determine the prevailing market opportunities.
- Major countries in each region are mapped according to their revenue contribution to the global market.
- Market player positioning facilitates benchmarking and provides a clear understanding of the present position of the market players.
- The report includes the analysis of the regional as well as global seaweed market trends, key players, market segments, application areas, and market growth strategies.
Key Market Segments
By Product
- Red
- Brown
- Green
By Application
- Fertilizers
- Animal Feed Additives
- Others
- Human Food
- Hydrocolloids
By Region
- North America
- U.S.
- Canada
- Mexico
- Europe
- UK
- Germany
- France
- Italy
- Spain
- Denmark
- Rest of Europe
- Asia-Pacific
- China
- Indonesia
- Philippines
- South Korea
- Japan
- Rest of Asia-Pacific
- LAMEA
- Saudi Arabia
- UAE
- Africa
- Tanzania
- Rest of LAMEA
Key Market Players:
- Cargill, Incorporated
- Annie Chun's, Inc.
- Qingdao Gather Great Ocean Algae Industry Group Co., Ltd.
- GimMe Health Foods LLC
- Groupe Roullier
- Mara Seaweed Ltd.
- Irish Seaweeds
- COMPO EXPERT GmbH
- Maine Coast Sea Vegetables, Inc.
- Brandt, Inc.
TABLE OF CONTENTS
CHAPTER 1: INTRODUCTION
- 1.1. Report description
- 1.2. Key market segments
- 1.3. Key benefits to the stakeholders
- 1.4. Research Methodology
- 1.4.1. Primary research
- 1.4.2. Secondary research
- 1.4.3. Analyst tools and models
CHAPTER 2: EXECUTIVE SUMMARY
- 2.1. CXO Perspective
CHAPTER 3: MARKET OVERVIEW
- 3.1. Market definition and scope
- 3.2. Key findings
- 3.2.1. Top impacting factors
- 3.2.2. Top investment pockets
- 3.3. Porter's five forces analysis
- 3.3.1. Bargaining power of suppliers
- 3.3.2. Bargaining power of buyers
- 3.3.3. Threat of substitutes
- 3.3.4. Threat of new entrants
- 3.3.5. Intensity of rivalry
- 3.4. Market dynamics
- 3.4.1. Drivers
- 3.4.1.1. Rise in demand for seaweeds in the manufacture of hydrocolloid
- 3.4.1.2. Increase in applications of seaweed
- 3.4.1. Drivers
- 3.4.2. Restraints
- 3.4.2.1. Volatility in the prices of seaweed
- 3.4.2.2. Impact on seaweed production due to climate change
- 3.4.3. Opportunities
- 3.4.3.1. Increase in application of seaweed in biofuel
- 3.4.3.2. Untapped market in North America and Europe
- 3.5. COVID-19 Impact Analysis on the market
CHAPTER 4: SEAWEED MARKET, BY PRODUCT
- 4.1. Overview
- 4.1.1. Market size and forecast
- 4.2. Red
- 4.2.1. Key market trends, growth factors and opportunities
- 4.2.2. Market size and forecast, by region
- 4.2.3. Market share analysis by country
- 4.3. Brown
- 4.3.1. Key market trends, growth factors and opportunities
- 4.3.2. Market size and forecast, by region
- 4.3.3. Market share analysis by country
- 4.4. Green
- 4.4.1. Key market trends, growth factors and opportunities
- 4.4.2. Market size and forecast, by region
- 4.4.3. Market share analysis by country
CHAPTER 5: SEAWEED MARKET, BY APPLICATION
- 5.1. Overview
- 5.1.1. Market size and forecast
- 5.2. Human Food
- 5.2.1. Key market trends, growth factors and opportunities
- 5.2.2. Market size and forecast, by region
- 5.2.3. Market share analysis by country
- 5.3. Hydrocolloids
- 5.3.1. Key market trends, growth factors and opportunities
- 5.3.2. Market size and forecast, by region
- 5.3.3. Market share analysis by country
- 5.4. Fertilizers
- 5.4.1. Key market trends, growth factors and opportunities
- 5.4.2. Market size and forecast, by region
- 5.4.3. Market share analysis by country
- 5.5. Animal Feed Additives
- 5.5.1. Key market trends, growth factors and opportunities
- 5.5.2. Market size and forecast, by region
- 5.5.3. Market share analysis by country
- 5.6. Others
- 5.6.1. Key market trends, growth factors and opportunities
- 5.6.2. Market size and forecast, by region
- 5.6.3. Market share analysis by country
CHAPTER 6: SEAWEED MARKET, BY REGION
- 6.1. Overview
- 6.1.1. Market size and forecast By Region
- 6.2. North America
- 6.2.1. Key trends and opportunities
- 6.2.2. Market size and forecast, by Product
- 6.2.3. Market size and forecast, by Application
- 6.2.4. Market size and forecast, by country
- 6.2.4.1. U.S.
- 6.2.4.1.1. Key market trends, growth factors and opportunities
- 6.2.4.1.2. Market size and forecast, by Product
- 6.2.4.1.3. Market size and forecast, by Application
- 6.2.4.2. Canada
- 6.2.4.2.1. Key market trends, growth factors and opportunities
- 6.2.4.2.2. Market size and forecast, by Product
- 6.2.4.2.3. Market size and forecast, by Application
- 6.2.4.3. Mexico
- 6.2.4.3.1. Key market trends, growth factors and opportunities
- 6.2.4.3.2. Market size and forecast, by Product
- 6.2.4.3.3. Market size and forecast, by Application
- 6.3. Europe
- 6.3.1. Key trends and opportunities
- 6.3.2. Market size and forecast, by Product
- 6.3.3. Market size and forecast, by Application
- 6.3.4. Market size and forecast, by country
- 6.3.4.1. UK
- 6.3.4.1.1. Key market trends, growth factors and opportunities
- 6.3.4.1.2. Market size and forecast, by Product
- 6.3.4.1.3. Market size and forecast, by Application
- 6.3.4.2. Germany
- 6.3.4.2.1. Key market trends, growth factors and opportunities
- 6.3.4.2.2. Market size and forecast, by Product
- 6.3.4.2.3. Market size and forecast, by Application
- 6.3.4.3. France
- 6.3.4.3.1. Key market trends, growth factors and opportunities
- 6.3.4.3.2. Market size and forecast, by Product
- 6.3.4.3.3. Market size and forecast, by Application
- 6.3.4.4. Italy
- 6.3.4.4.1. Key market trends, growth factors and opportunities
- 6.3.4.4.2. Market size and forecast, by Product
- 6.3.4.4.3. Market size and forecast, by Application
- 6.3.4.5. Spain
- 6.3.4.5.1. Key market trends, growth factors and opportunities
- 6.3.4.5.2. Market size and forecast, by Product
- 6.3.4.5.3. Market size and forecast, by Application
- 6.3.4.6. Denmark
- 6.3.4.6.1. Key market trends, growth factors and opportunities
- 6.3.4.6.2. Market size and forecast, by Product
- 6.3.4.6.3. Market size and forecast, by Application
- 6.3.4.7. Rest of Europe
- 6.3.4.7.1. Key market trends, growth factors and opportunities
- 6.3.4.7.2. Market size and forecast, by Product
- 6.3.4.7.3. Market size and forecast, by Application
- 6.4. Asia-Pacific
- 6.4.1. Key trends and opportunities
- 6.4.2. Market size and forecast, by Product
- 6.4.3. Market size and forecast, by Application
- 6.4.4. Market size and forecast, by country
- 6.4.4.1. China
- 6.4.4.1.1. Key market trends, growth factors and opportunities
- 6.4.4.1.2. Market size and forecast, by Product
- 6.4.4.1.3. Market size and forecast, by Application
- 6.4.4.2. Indonesia
- 6.4.4.2.1. Key market trends, growth factors and opportunities
- 6.4.4.2.2. Market size and forecast, by Product
- 6.4.4.2.3. Market size and forecast, by Application
- 6.4.4.3. Philippines
- 6.4.4.3.1. Key market trends, growth factors and opportunities
- 6.4.4.3.2. Market size and forecast, by Product
- 6.4.4.3.3. Market size and forecast, by Application
- 6.4.4.4. South Korea
- 6.4.4.4.1. Key market trends, growth factors and opportunities
- 6.4.4.4.2. Market size and forecast, by Product
- 6.4.4.4.3. Market size and forecast, by Application
- 6.4.4.5. Japan
- 6.4.4.5.1. Key market trends, growth factors and opportunities
- 6.4.4.5.2. Market size and forecast, by Product
- 6.4.4.5.3. Market size and forecast, by Application
- 6.4.4.6. Rest of Asia-Pacific
- 6.4.4.6.1. Key market trends, growth factors and opportunities
- 6.4.4.6.2. Market size and forecast, by Product
- 6.4.4.6.3. Market size and forecast, by Application
- 6.5. LAMEA
- 6.5.1. Key trends and opportunities
- 6.5.2. Market size and forecast, by Product
- 6.5.3. Market size and forecast, by Application
- 6.5.4. Market size and forecast, by country
- 6.5.4.1. Saudi Arabia
- 6.5.4.1.1. Key market trends, growth factors and opportunities
- 6.5.4.1.2. Market size and forecast, by Product
- 6.5.4.1.3. Market size and forecast, by Application
- 6.5.4.2. UAE
- 6.5.4.2.1. Key market trends, growth factors and opportunities
- 6.5.4.2.2. Market size and forecast, by Product
- 6.5.4.2.3. Market size and forecast, by Application
- 6.5.4.3. Africa
- 6.5.4.3.1. Key market trends, growth factors and opportunities
- 6.5.4.3.2. Market size and forecast, by Product
- 6.5.4.3.3. Market size and forecast, by Application
- 6.5.4.4. Tanzania
- 6.5.4.4.1. Key market trends, growth factors and opportunities
- 6.5.4.4.2. Market size and forecast, by Product
- 6.5.4.4.3. Market size and forecast, by Application
- 6.5.4.5. Rest of LAMEA
- 6.5.4.5.1. Key market trends, growth factors and opportunities
- 6.5.4.5.2. Market size and forecast, by Product
- 6.5.4.5.3. Market size and forecast, by Application
CHAPTER 7: COMPETITIVE LANDSCAPE
- 7.1. Introduction
- 7.2. Top winning strategies
- 7.3. Product Mapping of Top 10 Player
- 7.4. Competitive Dashboard
- 7.5. Competitive Heatmap
- 7.6. Top player positioning, 2021
CHAPTER 8: COMPANY PROFILES
- 8.1. Cargill, Incorporated
- 8.1.1. Company overview
- 8.1.2. Key Executives
- 8.1.3. Company snapshot
- 8.1.4. Operating business segments
- 8.1.5. Product portfolio
- 8.1.6. Business performance
- 8.1.7. Key strategic moves and developments
- 8.2. COMPO EXPERT GmbH
- 8.2.1. Company overview
- 8.2.2. Key Executives
- 8.2.3. Company snapshot
- 8.2.4. Operating business segments
- 8.2.5. Product portfolio
- 8.3. Annie Chun's, Inc.
- 8.3.1. Company overview
- 8.3.2. Key Executives
- 8.3.3. Company snapshot
- 8.3.4. Operating business segments
- 8.3.5. Product portfolio
- 8.4. GimMe Health Foods LLC
- 8.4.1. Company overview
- 8.4.2. Key Executives
- 8.4.3. Company snapshot
- 8.4.4. Operating business segments
- 8.4.5. Product portfolio
- 8.4.6. Key strategic moves and developments
- 8.5. Groupe Roullier
- 8.5.1. Company overview
- 8.5.2. Key Executives
- 8.5.3. Company snapshot
- 8.5.4. Operating business segments
- 8.5.5. Product portfolio
- 8.6. Irish Seaweeds
- 8.6.1. Company overview
- 8.6.2. Key Executives
- 8.6.3. Company snapshot
- 8.6.4. Operating business segments
- 8.6.5. Product portfolio
- 8.7. Maine Coast Sea Vegetables, Inc.
- 8.7.1. Company overview
- 8.7.2. Key Executives
- 8.7.3. Company snapshot
- 8.7.4. Operating business segments
- 8.7.5. Product portfolio
- 8.8. Mara Seaweed Ltd.
- 8.8.1. Company overview
- 8.8.2. Key Executives
- 8.8.3. Company snapshot
- 8.8.4. Operating business segments
- 8.8.5. Product portfolio
- 8.9. Qingdao Gather Great Ocean Algae Industry Group Co., Ltd.
- 8.9.1. Company overview
- 8.9.2. Key Executives
- 8.9.3. Company snapshot
- 8.9.4. Operating business segments
- 8.9.5. Product portfolio
- 8.10. Brandt, Inc.
- 8.10.1. Company overview
- 8.10.2. Key Executives
- 8.10.3. Company snapshot
- 8.10.4. Operating business segments
- 8.10.5. Product portfolio
LIST OF TABLES
- TABLE 01. GLOBAL SEAWEED MARKET, BY PRODUCT, 2021-2031 ($MILLION)
- TABLE 02. SEAWEED MARKET FOR RED, BY REGION, 2021-2031 ($MILLION)
- TABLE 03. SEAWEED MARKET FOR BROWN, BY REGION, 2021-2031 ($MILLION)
- TABLE 04. SEAWEED MARKET FOR GREEN, BY REGION, 2021-2031 ($MILLION)
- TABLE 05. GLOBAL SEAWEED MARKET, BY APPLICATION, 2021-2031 ($MILLION)
- TABLE 06. SEAWEED MARKET FOR HUMAN FOOD, BY REGION, 2021-2031 ($MILLION)
- TABLE 07. SEAWEED MARKET FOR HYDROCOLLOIDS, BY REGION, 2021-2031 ($MILLION)
- TABLE 08. SEAWEED MARKET FOR FERTILIZERS, BY REGION, 2021-2031 ($MILLION)
- TABLE 09. SEAWEED MARKET FOR ANIMAL FEED ADDITIVES, BY REGION, 2021-2031 ($MILLION)
- TABLE 10. SEAWEED MARKET FOR OTHERS, BY REGION, 2021-2031 ($MILLION)
- TABLE 11. SEAWEED MARKET, BY REGION, 2021-2031 ($MILLION)
- TABLE 12. NORTH AMERICA SEAWEED MARKET, BY PRODUCT, 2021-2031 ($MILLION)
- TABLE 13. NORTH AMERICA SEAWEED MARKET, BY APPLICATION, 2021-2031 ($MILLION)
- TABLE 14. NORTH AMERICA SEAWEED MARKET, BY COUNTRY, 2021-2031 ($MILLION)
- TABLE 15. U.S. SEAWEED MARKET, BY PRODUCT, 2021-2031 ($MILLION)
- TABLE 16. U.S. SEAWEED MARKET, BY APPLICATION, 2021-2031 ($MILLION)
- TABLE 17. CANADA SEAWEED MARKET, BY PRODUCT, 2021-2031 ($MILLION)
- TABLE 18. CANADA SEAWEED MARKET, BY APPLICATION, 2021-2031 ($MILLION)
- TABLE 19. MEXICO SEAWEED MARKET, BY PRODUCT, 2021-2031 ($MILLION)
- TABLE 20. MEXICO SEAWEED MARKET, BY APPLICATION, 2021-2031 ($MILLION)
- TABLE 21. EUROPE SEAWEED MARKET, BY PRODUCT, 2021-2031 ($MILLION)
- TABLE 22. EUROPE SEAWEED MARKET, BY APPLICATION, 2021-2031 ($MILLION)
- TABLE 23. EUROPE SEAWEED MARKET, BY COUNTRY, 2021-2031 ($MILLION)
- TABLE 24. UK SEAWEED MARKET, BY PRODUCT, 2021-2031 ($MILLION)
- TABLE 25. UK SEAWEED MARKET, BY APPLICATION, 2021-2031 ($MILLION)
- TABLE 26. GERMANY SEAWEED MARKET, BY PRODUCT, 2021-2031 ($MILLION)
- TABLE 27. GERMANY SEAWEED MARKET, BY APPLICATION, 2021-2031 ($MILLION)
- TABLE 28. FRANCE SEAWEED MARKET, BY PRODUCT, 2021-2031 ($MILLION)
- TABLE 29. FRANCE SEAWEED MARKET, BY APPLICATION, 2021-2031 ($MILLION)
- TABLE 30. ITALY SEAWEED MARKET, BY PRODUCT, 2021-2031 ($MILLION)
- TABLE 31. ITALY SEAWEED MARKET, BY APPLICATION, 2021-2031 ($MILLION)
- TABLE 32. SPAIN SEAWEED MARKET, BY PRODUCT, 2021-2031 ($MILLION)
- TABLE 33. SPAIN SEAWEED MARKET, BY APPLICATION, 2021-2031 ($MILLION)
- TABLE 34. DENMARK SEAWEED MARKET, BY PRODUCT, 2021-2031 ($MILLION)
- TABLE 35. DENMARK SEAWEED MARKET, BY APPLICATION, 2021-2031 ($MILLION)
- TABLE 36. REST OF EUROPE SEAWEED MARKET, BY PRODUCT, 2021-2031 ($MILLION)
- TABLE 37. REST OF EUROPE SEAWEED MARKET, BY APPLICATION, 2021-2031 ($MILLION)
- TABLE 38. ASIA-PACIFIC SEAWEED MARKET, BY PRODUCT, 2021-2031 ($MILLION)
- TABLE 39. ASIA-PACIFIC SEAWEED MARKET, BY APPLICATION, 2021-2031 ($MILLION)
- TABLE 40. ASIA-PACIFIC SEAWEED MARKET, BY COUNTRY, 2021-2031 ($MILLION)
- TABLE 41. CHINA SEAWEED MARKET, BY PRODUCT, 2021-2031 ($MILLION)
- TABLE 42. CHINA SEAWEED MARKET, BY APPLICATION, 2021-2031 ($MILLION)
- TABLE 43. INDONESIA SEAWEED MARKET, BY PRODUCT, 2021-2031 ($MILLION)
- TABLE 44. INDONESIA SEAWEED MARKET, BY APPLICATION, 2021-2031 ($MILLION)
- TABLE 45. PHILIPPINES SEAWEED MARKET, BY PRODUCT, 2021-2031 ($MILLION)
- TABLE 46. PHILIPPINES SEAWEED MARKET, BY APPLICATION, 2021-2031 ($MILLION)
- TABLE 47. SOUTH KOREA SEAWEED MARKET, BY PRODUCT, 2021-2031 ($MILLION)
- TABLE 48. SOUTH KOREA SEAWEED MARKET, BY APPLICATION, 2021-2031 ($MILLION)
- TABLE 49. JAPAN SEAWEED MARKET, BY PRODUCT, 2021-2031 ($MILLION)
- TABLE 50. JAPAN SEAWEED MARKET, BY APPLICATION, 2021-2031 ($MILLION)
- TABLE 51. REST OF ASIA-PACIFIC SEAWEED MARKET, BY PRODUCT, 2021-2031 ($MILLION)
- TABLE 52. REST OF ASIA-PACIFIC SEAWEED MARKET, BY APPLICATION, 2021-2031 ($MILLION)
- TABLE 53. LAMEA SEAWEED MARKET, BY PRODUCT, 2021-2031 ($MILLION)
- TABLE 54. LAMEA SEAWEED MARKET, BY APPLICATION, 2021-2031 ($MILLION)
- TABLE 55. LAMEA SEAWEED MARKET, BY COUNTRY, 2021-2031 ($MILLION)
- TABLE 56. SAUDI ARABIA SEAWEED MARKET, BY PRODUCT, 2021-2031 ($MILLION)
- TABLE 57. SAUDI ARABIA SEAWEED MARKET, BY APPLICATION, 2021-2031 ($MILLION)
- TABLE 58. UAE SEAWEED MARKET, BY PRODUCT, 2021-2031 ($MILLION)
- TABLE 59. UAE SEAWEED MARKET, BY APPLICATION, 2021-2031 ($MILLION)
- TABLE 60. AFRICA SEAWEED MARKET, BY PRODUCT, 2021-2031 ($MILLION)
- TABLE 61. AFRICA SEAWEED MARKET, BY APPLICATION, 2021-2031 ($MILLION)
- TABLE 62. TANZANIA SEAWEED MARKET, BY PRODUCT, 2021-2031 ($MILLION)
- TABLE 63. TANZANIA SEAWEED MARKET, BY APPLICATION, 2021-2031 ($MILLION)
- TABLE 64. REST OF LAMEA SEAWEED MARKET, BY PRODUCT, 2021-2031 ($MILLION)
- TABLE 65. REST OF LAMEA SEAWEED MARKET, BY APPLICATION, 2021-2031 ($MILLION)
- TABLE 66. CARGILL, INCORPORATED: KEY EXECUTIVES
- TABLE 67. CARGILL, INCORPORATED: COMPANY SNAPSHOT
- TABLE 68. CARGILL, INCORPORATED: PRODUCT SEGMENTS
- TABLE 69. CARGILL, INCORPORATED: PRODUCT PORTFOLIO
- TABLE 70. CARGILL, INCORPORATED: KEY STRATERGIES
- TABLE 71. COMPO EXPERT GMBH: KEY EXECUTIVES
- TABLE 72. COMPO EXPERT GMBH: COMPANY SNAPSHOT
- TABLE 73. COMPO EXPERT GMBH: PRODUCT SEGMENTS
- TABLE 74. COMPO EXPERT GMBH: PRODUCT PORTFOLIO
- TABLE 75. ANNIE CHUN'S, INC.: KEY EXECUTIVES
- TABLE 76. ANNIE CHUN'S, INC.: COMPANY SNAPSHOT
- TABLE 77. ANNIE CHUN'S, INC.: PRODUCT SEGMENTS
- TABLE 78. ANNIE CHUN'S, INC.: PRODUCT PORTFOLIO
- TABLE 79. GIMME HEALTH FOODS LLC: KEY EXECUTIVES
- TABLE 80. GIMME HEALTH FOODS LLC: COMPANY SNAPSHOT
- TABLE 81. GIMME HEALTH FOODS LLC: PRODUCT SEGMENTS
- TABLE 82. GIMME HEALTH FOODS LLC: PRODUCT PORTFOLIO
- TABLE 83. GIMME HEALTH FOODS LLC: KEY STRATERGIES
- TABLE 84. GROUPE ROULLIER: KEY EXECUTIVES
- TABLE 85. GROUPE ROULLIER: COMPANY SNAPSHOT
- TABLE 86. GROUPE ROULLIER: PRODUCT SEGMENTS
- TABLE 87. GROUPE ROULLIER: PRODUCT PORTFOLIO
- TABLE 88. IRISH SEAWEEDS: KEY EXECUTIVES
- TABLE 89. IRISH SEAWEEDS: COMPANY SNAPSHOT
- TABLE 90. IRISH SEAWEEDS: PRODUCT SEGMENTS
- TABLE 91. IRISH SEAWEEDS: PRODUCT PORTFOLIO
- TABLE 92. MAINE COAST SEA VEGETABLES, INC.: KEY EXECUTIVES
- TABLE 93. MAINE COAST SEA VEGETABLES, INC.: COMPANY SNAPSHOT
- TABLE 94. MAINE COAST SEA VEGETABLES, INC.: PRODUCT SEGMENTS
- TABLE 95. MAINE COAST SEA VEGETABLES, INC.: PRODUCT PORTFOLIO
- TABLE 96. MARA SEAWEED LTD.: KEY EXECUTIVES
- TABLE 97. MARA SEAWEED LTD.: COMPANY SNAPSHOT
- TABLE 98. MARA SEAWEED LTD.: PRODUCT SEGMENTS
- TABLE 99. MARA SEAWEED LTD.: PRODUCT PORTFOLIO
- TABLE 100. QINGDAO GATHER GREAT OCEAN ALGAE INDUSTRY GROUP CO., LTD.: KEY EXECUTIVES
- TABLE 101. QINGDAO GATHER GREAT OCEAN ALGAE INDUSTRY GROUP CO., LTD.: COMPANY SNAPSHOT
- TABLE 102. QINGDAO GATHER GREAT OCEAN ALGAE INDUSTRY GROUP CO., LTD.: PRODUCT SEGMENTS
- TABLE 103. QINGDAO GATHER GREAT OCEAN ALGAE INDUSTRY GROUP CO., LTD.: PRODUCT PORTFOLIO
- TABLE 104. BRANDT, INC.: KEY EXECUTIVES
- TABLE 105. BRANDT, INC.: COMPANY SNAPSHOT
- TABLE 106. BRANDT, INC.: PRODUCT SEGMENTS
- TABLE 107. BRANDT, INC.: PRODUCT PORTFOLIO
LIST OF FIGURES
- FIGURE 01. SEAWEED MARKET, 2021-2031
- FIGURE 02. SEGMENTATION OF SEAWEED MARKET, 2021-2031
- FIGURE 03. TOP INVESTMENT POCKETS IN SEAWEED MARKET (2022-2031)
- FIGURE 04. LOW BARGAINING POWER OF SUPPLIERS
- FIGURE 05. MODERATE BARGAINING POWER OF BUYERS
- FIGURE 06. MODERATE THREAT OF SUBSTITUTES
- FIGURE 07. MODERATE THREAT OF NEW ENTRANTS
- FIGURE 08. HIGH INTENSITY OF RIVALRY
- FIGURE 09. DRIVERS, RESTRAINTS AND OPPORTUNITIES: GLOBALSEAWEED MARKET
- FIGURE 10. SEAWEED MARKET, BY PRODUCT, 2021(%)
- FIGURE 11. COMPARATIVE SHARE ANALYSIS OF SEAWEED MARKET FOR RED, BY COUNTRY 2021 AND 2031(%)
- FIGURE 12. COMPARATIVE SHARE ANALYSIS OF SEAWEED MARKET FOR BROWN, BY COUNTRY 2021 AND 2031(%)
- FIGURE 13. COMPARATIVE SHARE ANALYSIS OF SEAWEED MARKET FOR GREEN, BY COUNTRY 2021 AND 2031(%)
- FIGURE 14. SEAWEED MARKET, BY APPLICATION, 2021(%)
- FIGURE 15. COMPARATIVE SHARE ANALYSIS OF SEAWEED MARKET FOR HUMAN FOOD, BY COUNTRY 2021 AND 2031(%)
- FIGURE 16. COMPARATIVE SHARE ANALYSIS OF SEAWEED MARKET FOR HYDROCOLLOIDS, BY COUNTRY 2021 AND 2031(%)
- FIGURE 17. COMPARATIVE SHARE ANALYSIS OF SEAWEED MARKET FOR FERTILIZERS, BY COUNTRY 2021 AND 2031(%)
- FIGURE 18. COMPARATIVE SHARE ANALYSIS OF SEAWEED MARKET FOR ANIMAL FEED ADDITIVES, BY COUNTRY 2021 AND 2031(%)
- FIGURE 19. COMPARATIVE SHARE ANALYSIS OF SEAWEED MARKET FOR OTHERS, BY COUNTRY 2021 AND 2031(%)
- FIGURE 20. SEAWEED MARKET BY REGION, 2021
- FIGURE 21. U.S. SEAWEED MARKET, 2021-2031 ($MILLION)
- FIGURE 22. CANADA SEAWEED MARKET, 2021-2031 ($MILLION)
- FIGURE 23. MEXICO SEAWEED MARKET, 2021-2031 ($MILLION)
- FIGURE 24. UK SEAWEED MARKET, 2021-2031 ($MILLION)
- FIGURE 25. GERMANY SEAWEED MARKET, 2021-2031 ($MILLION)
- FIGURE 26. FRANCE SEAWEED MARKET, 2021-2031 ($MILLION)
- FIGURE 27. ITALY SEAWEED MARKET, 2021-2031 ($MILLION)
- FIGURE 28. SPAIN SEAWEED MARKET, 2021-2031 ($MILLION)
- FIGURE 29. DENMARK SEAWEED MARKET, 2021-2031 ($MILLION)
- FIGURE 30. REST OF EUROPE SEAWEED MARKET, 2021-2031 ($MILLION)
- FIGURE 31. CHINA SEAWEED MARKET, 2021-2031 ($MILLION)
- FIGURE 32. INDONESIA SEAWEED MARKET, 2021-2031 ($MILLION)
- FIGURE 33. PHILIPPINES SEAWEED MARKET, 2021-2031 ($MILLION)
- FIGURE 34. SOUTH KOREA SEAWEED MARKET, 2021-2031 ($MILLION)
- FIGURE 35. JAPAN SEAWEED MARKET, 2021-2031 ($MILLION)
- FIGURE 36. REST OF ASIA-PACIFIC SEAWEED MARKET, 2021-2031 ($MILLION)
- FIGURE 37. SAUDI ARABIA SEAWEED MARKET, 2021-2031 ($MILLION)
- FIGURE 38. UAE SEAWEED MARKET, 2021-2031 ($MILLION)
- FIGURE 39. AFRICA SEAWEED MARKET, 2021-2031 ($MILLION)
- FIGURE 40. TANZANIA SEAWEED MARKET, 2021-2031 ($MILLION)
- FIGURE 41. REST OF LAMEA SEAWEED MARKET, 2021-2031 ($MILLION)
- FIGURE 42. TOP WINNING STRATEGIES, BY YEAR
- FIGURE 43. TOP WINNING STRATEGIES, BY DEVELOPMENT
- FIGURE 44. TOP WINNING STRATEGIES, BY COMPANY
- FIGURE 45. PRODUCT MAPPING OF TOP 10 PLAYERS
- FIGURE 46. COMPETITIVE DASHBOARD
- FIGURE 47. COMPETITIVE HEATMAP: SEAWEED MARKET
- FIGURE 48. TOP PLAYER POSITIONING, 2021
- FIGURE 49. CARGILL, INCORPORATED: NET REVENUE, 2019-2021 ($MILLION)

