
PUBLISHER: Allied Market Research | PRODUCT CODE: 1298298

PUBLISHER: Allied Market Research | PRODUCT CODE: 1298298
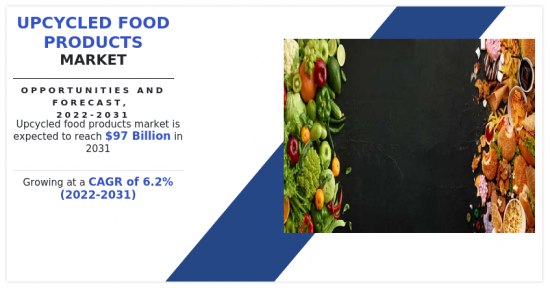
Upcycled food products Market By Type, By Source, By Distribution Channel : Global Opportunity Analysis and Industry Forecast, 2021-2031
The upcycled food products market size was $53,716.68 million in 2021 and is expected to reach $97,009.21 million by 2031, registering a CAGR of 6.2% from 2022 to 2031.
Upcycled food products can be defined as environmentally friendly foods containing safe ingredients that otherwise would not have gone to human consumption such as damaged food produce, by-products and scraps from food preparation. Future research should assess the consumers. Upcycled food products are created using sustainable and ethical methods that reduce food waste and promote the circular economy. The market includes a wide range of products, such as snacks, bakery products, beverages, condiments, and pet food, among others.
The upcycled food products market is projected to fueled by growing consumer health concerns. The demand for upcycled food products has increased as consumer health concerns have increased. The advantages of consuming wholesome, eco-friendly, and sustainably produced foods are becoming more and more apparent to consumers. In place of being thrown away, they are searching for culinary products manufactured from ingredients that have been upcycled and given a new life. Foods that have been upcycled from waste or byproducts provide a solution to the growing problem of food waste and the demand for more sustainable food systems.
The North America upcycled food products market held the major share in 2021 and is expected to grow on a significant CAGR during the forecast period. The demand for upcycled food products in North America is rising as the rise of e-commerce and online grocery shopping, which has made it easier for consumers to access a wider range of upcycled food products. There has been a push by some governments and organizations in North America to reduce food waste, which has helped to promote the use of upcycled ingredients in food production. There are several governments and organizations in North America that have been working to reduce food waste. For instance, The U.S. Environmental Protection Agency (EPA) has a food recovery hierarchy that promotes source reduction, food donation, and composting as ways to reduce food waste. In Canada, the National Zero Waste Council has developed a food waste reduction strategy that includes a target of reducing food waste by 50% by 2030.
Moreover, in the present scenario, Companies are using product differentiation to meet the changing preferences and needs of consumers. For example, some companies are developing upcycled food products that cater to specific dietary needs, such as gluten-free or vegan options. Overall, the market for upcycled food products is growing and providing opportunities for major players in part due to product differentiation. Businesses who can differentiate their goods and adapt to changing consumer demands and tastes will succeed in this quickly expanding sector.
Additionally, Online sales enable businesses to reach a wider clientele, including people in rural areas who might not otherwise have access to products made from upcycled food. Due to consumers' ease of access to internet search engines and marketplaces to readily locate and buy upcycled food products, online shopping gives businesses a greater opportunity to reach potential clients. Online retail makes it simpler for customers to buy upcycled food goods because they can do so without leaving their homes and without having to travel to a store. Overall, the upcycled food products market is experiencing tremendous growth with the advent of e-commerce and online retail.
However, one of the main things preventing the market for upcycled food products from expanding is perception problems. Some people still think that upcycled food products are inferior to regular food products or of lower quality, and they may have doubts about their safety and quality. Additionally, some consumers might not be aware of the advantages that upcycled food products have for the environment or know why they are more valuable than conventional food products. The market for upcycled food products may see growing challenges as a result of this lack of awareness.
The upcycled food products market is segmented on the basis of type, source, distribution channel, and region. Based on type, the market is classified into food and beverages processing, personal care products, Household products, and pet food. Further, food and beverages processing segment is classified into bakery and snacks, drinking beverages, dairy products. Based on source, the market is classified into food waste, agricultural by products, and brewery and distillery waste. Based on distribution channel, the market is classified into online and offline. Region wise, it is analyzed across North America (U.S., Canada, Mexico), Europe UK, Germany, France, Netherlands, Italy, Spain, Russia, and Rest of Europe), Asia-Pacific (China, Japan, India, Australia, New Zealand, South Korea, Philippines, and Rest of Asia-Pacific), and LAMEA (Brazil, Argentina, UK, South Africa, and Rest of LAMEA).
The major players operating in the market focus on key market strategies, such as mergers, product launches, acquisitions, collaborations, and partnerships. They have been also focusing on strengthening their market reach to maintain their goodwill in the ever-competitive market. Some of the key players in the upcycled food products market include Rebon, Abokichi, Diana's, Blue Circle Foods, Riff, US Foods, The Spare Food Co., ReGrained, Blue Stripes Urban Cacao, GoodSport Nutrition, Agricycle Global, SUPERFRAU, Lost & Found Distillery, and Leashless Lab.
Key Benefits For Stakeholders
- This report provides a quantitative analysis of the market segments, current trends, estimations, and dynamics of the upcycled food products market analysis from 2021 to 2031 to identify the prevailing upcycled food products market opportunities.
- The market research is offered along with information related to key drivers, restraints, and opportunities.
- Porter's five forces analysis highlights the potency of buyers and suppliers to enable stakeholders make profit-oriented business decisions and strengthen their supplier-buyer network.
- In-depth analysis of the upcycled food products market segmentation assists to determine the prevailing market opportunities.
- Major countries in each region are mapped according to their revenue contribution to the global market.
- Market player positioning facilitates benchmarking and provides a clear understanding of the present position of the market players.
- The report includes the analysis of the regional as well as global upcycled food products market trends, key players, market segments, application areas, and market growth strategies.
Key Market Segments
By Type
- Food and beverages
- Food and beverages sub type
- Bakery and Snacks
- Drinking Beverages
- Dairy products
- Personal Care Products
- Household Products
- Pet Food
By Source
- Food waste
- Agricultural by Products
- Brewery and Distillery Waste
By Distribution Channel
- Online
- Offline
By Region
- North America
- U.S.
- Canada
- Mexico
- Europe
- UK
- Germany
- France
- Netherlands
- Italy
- Spain
- Russia
- Rest of Europe
- Asia-Pacific
- China
- Japan
- India
- Australia
- New Zealand
- South Korea
- Philippines
- Rest of Asia-Pacific
- LAMEA
- Brazil
- Argentina
- UAE
- South Africa
- Rest of LAMEA
Key Market Players:
- Diana's Bananas, LLC.
- Outcast Foods
- The Spare Food Co.
- Blue Stripes LLC.
- Superfrau
- Lost & Found Distillery, Inc.
- Abokichi
- Riff Cold Brewed
- ReGrained
- Alice & Ambre Inc.
TABLE OF CONTENTS
CHAPTER 1: INTRODUCTION
- 1.1. Report description
- 1.2. Key market segments
- 1.3. Key benefits to the stakeholders
- 1.4. Research Methodology
- 1.4.1. Primary research
- 1.4.2. Secondary research
- 1.4.3. Analyst tools and models
CHAPTER 2: EXECUTIVE SUMMARY
- 2.1. CXO Perspective
CHAPTER 3: MARKET OVERVIEW
- 3.1. Market definition and scope
- 3.2. Key findings
- 3.2.1. Top impacting factors
- 3.2.2. Top investment pockets
- 3.3. Porter's five forces analysis
- 3.3.1. Bargaining power of suppliers
- 3.3.2. Bargaining power of buyers
- 3.3.3. Threat of substitutes
- 3.3.4. Threat of new entrants
- 3.3.5. Intensity of rivalry
- 3.4. Market dynamics
- 3.4.1. Drivers
- 3.4.1.1. Rising Cost of Raw Materials
- 3.4.1.2. Growing Consumer Health Concerns
- 3.4.1.3. Technological Advancements
- 3.4.1. Drivers
- 3.4.2. Restraints
- 3.4.2.1. Limited availability
- 3.4.2.2. Perception issues regarding upcycled food products
- 3.4.3. Opportunities
- 3.4.3.1. Rising demand for plant-based and vegan diets
- 3.4.3.2. Product differentiation
- 3.5. COVID-19 Impact Analysis on the market
- 3.6. Value Chain Analysis
CHAPTER 4: UPCYCLED FOOD PRODUCTS MARKET, BY TYPE
- 4.1. Overview
- 4.1.1. Market size and forecast
- 4.2. Food and beverages
- 4.2.1. Key market trends, growth factors and opportunities
- 4.2.2. Market size and forecast, by region
- 4.2.3. Market share analysis by country
- 4.2.4. Food and beverages Upcycled food products Market by Food and beverages sub type
- 4.2.4.1. Bakery and Snacks Market size and forecast, by region
- 4.2.4.2. Bakery and Snacks Market size and forecast, by country
- 4.2.4.3. Drinking Beverages Market size and forecast, by region
- 4.2.4.4. Drinking Beverages Market size and forecast, by country
- 4.2.4.5. Dairy products Market size and forecast, by region
- 4.2.4.6. Dairy products Market size and forecast, by country
- 4.3. Personal Care Products
- 4.3.1. Key market trends, growth factors and opportunities
- 4.3.2. Market size and forecast, by region
- 4.3.3. Market share analysis by country
- 4.4. Household Products
- 4.4.1. Key market trends, growth factors and opportunities
- 4.4.2. Market size and forecast, by region
- 4.4.3. Market share analysis by country
- 4.5. Pet Food
- 4.5.1. Key market trends, growth factors and opportunities
- 4.5.2. Market size and forecast, by region
- 4.5.3. Market share analysis by country
CHAPTER 5: UPCYCLED FOOD PRODUCTS MARKET, BY SOURCE
- 5.1. Overview
- 5.1.1. Market size and forecast
- 5.2. Food waste
- 5.2.1. Key market trends, growth factors and opportunities
- 5.2.2. Market size and forecast, by region
- 5.2.3. Market share analysis by country
- 5.3. Agricultural by Products
- 5.3.1. Key market trends, growth factors and opportunities
- 5.3.2. Market size and forecast, by region
- 5.3.3. Market share analysis by country
- 5.4. Brewery and Distillery Waste
- 5.4.1. Key market trends, growth factors and opportunities
- 5.4.2. Market size and forecast, by region
- 5.4.3. Market share analysis by country
CHAPTER 6: UPCYCLED FOOD PRODUCTS MARKET, BY DISTRIBUTION CHANNEL
- 6.1. Overview
- 6.1.1. Market size and forecast
- 6.2. Online
- 6.2.1. Key market trends, growth factors and opportunities
- 6.2.2. Market size and forecast, by region
- 6.2.3. Market share analysis by country
- 6.3. Offline
- 6.3.1. Key market trends, growth factors and opportunities
- 6.3.2. Market size and forecast, by region
- 6.3.3. Market share analysis by country
CHAPTER 7: UPCYCLED FOOD PRODUCTS MARKET, BY REGION
- 7.1. Overview
- 7.1.1. Market size and forecast By Region
- 7.2. North America
- 7.2.1. Key trends and opportunities
- 7.2.2. Market size and forecast, by Type
- 7.2.2.1. North America Food and beverages Upcycled food products Market by Food and beverages sub type
- 7.2.3. Market size and forecast, by Source
- 7.2.4. Market size and forecast, by Distribution Channel
- 7.2.5. Market size and forecast, by country
- 7.2.5.1. U.S.
- 7.2.5.1.1. Key market trends, growth factors and opportunities
- 7.2.5.1.2. Market size and forecast, by Type
- 7.2.5.1.2.1. U.S. Food and beverages Upcycled food products Market by Food and beverages sub type
- 7.2.5.1.3. Market size and forecast, by Source
- 7.2.5.1.4. Market size and forecast, by Distribution Channel
- 7.2.5.2. Canada
- 7.2.5.2.1. Key market trends, growth factors and opportunities
- 7.2.5.2.2. Market size and forecast, by Type
- 7.2.5.2.2.1. Canada Food and beverages Upcycled food products Market by Food and beverages sub type
- 7.2.5.2.3. Market size and forecast, by Source
- 7.2.5.2.4. Market size and forecast, by Distribution Channel
- 7.2.5.3. Mexico
- 7.2.5.3.1. Key market trends, growth factors and opportunities
- 7.2.5.3.2. Market size and forecast, by Type
- 7.2.5.3.2.1. Mexico Food and beverages Upcycled food products Market by Food and beverages sub type
- 7.2.5.3.3. Market size and forecast, by Source
- 7.2.5.3.4. Market size and forecast, by Distribution Channel
- 7.3. Europe
- 7.3.1. Key trends and opportunities
- 7.3.2. Market size and forecast, by Type
- 7.3.2.1. Europe Food and beverages Upcycled food products Market by Food and beverages sub type
- 7.3.3. Market size and forecast, by Source
- 7.3.4. Market size and forecast, by Distribution Channel
- 7.3.5. Market size and forecast, by country
- 7.3.5.1. UK
- 7.3.5.1.1. Key market trends, growth factors and opportunities
- 7.3.5.1.2. Market size and forecast, by Type
- 7.3.5.1.2.1. UK Food and beverages Upcycled food products Market by Food and beverages sub type
- 7.3.5.1.3. Market size and forecast, by Source
- 7.3.5.1.4. Market size and forecast, by Distribution Channel
- 7.3.5.2. Germany
- 7.3.5.2.1. Key market trends, growth factors and opportunities
- 7.3.5.2.2. Market size and forecast, by Type
- 7.3.5.2.2.1. Germany Food and beverages Upcycled food products Market by Food and beverages sub type
- 7.3.5.2.3. Market size and forecast, by Source
- 7.3.5.2.4. Market size and forecast, by Distribution Channel
- 7.3.5.3. France
- 7.3.5.3.1. Key market trends, growth factors and opportunities
- 7.3.5.3.2. Market size and forecast, by Type
- 7.3.5.3.2.1. France Food and beverages Upcycled food products Market by Food and beverages sub type
- 7.3.5.3.3. Market size and forecast, by Source
- 7.3.5.3.4. Market size and forecast, by Distribution Channel
- 7.3.5.4. Netherlands
- 7.3.5.4.1. Key market trends, growth factors and opportunities
- 7.3.5.4.2. Market size and forecast, by Type
- 7.3.5.4.2.1. Netherlands Food and beverages Upcycled food products Market by Food and beverages sub type
- 7.3.5.4.3. Market size and forecast, by Source
- 7.3.5.4.4. Market size and forecast, by Distribution Channel
- 7.3.5.5. Italy
- 7.3.5.5.1. Key market trends, growth factors and opportunities
- 7.3.5.5.2. Market size and forecast, by Type
- 7.3.5.5.2.1. Italy Food and beverages Upcycled food products Market by Food and beverages sub type
- 7.3.5.5.3. Market size and forecast, by Source
- 7.3.5.5.4. Market size and forecast, by Distribution Channel
- 7.3.5.6. Spain
- 7.3.5.6.1. Key market trends, growth factors and opportunities
- 7.3.5.6.2. Market size and forecast, by Type
- 7.3.5.6.2.1. Spain Food and beverages Upcycled food products Market by Food and beverages sub type
- 7.3.5.6.3. Market size and forecast, by Source
- 7.3.5.6.4. Market size and forecast, by Distribution Channel
- 7.3.5.7. Russia
- 7.3.5.7.1. Key market trends, growth factors and opportunities
- 7.3.5.7.2. Market size and forecast, by Type
- 7.3.5.7.2.1. Russia Food and beverages Upcycled food products Market by Food and beverages sub type
- 7.3.5.7.3. Market size and forecast, by Source
- 7.3.5.7.4. Market size and forecast, by Distribution Channel
- 7.3.5.8. Rest of Europe
- 7.3.5.8.1. Key market trends, growth factors and opportunities
- 7.3.5.8.2. Market size and forecast, by Type
- 7.3.5.8.2.1. Rest of Europe Food and beverages Upcycled food products Market by Food and beverages sub type
- 7.3.5.8.3. Market size and forecast, by Source
- 7.3.5.8.4. Market size and forecast, by Distribution Channel
- 7.4. Asia-Pacific
- 7.4.1. Key trends and opportunities
- 7.4.2. Market size and forecast, by Type
- 7.4.2.1. Asia-Pacific Food and beverages Upcycled food products Market by Food and beverages sub type
- 7.4.3. Market size and forecast, by Source
- 7.4.4. Market size and forecast, by Distribution Channel
- 7.4.5. Market size and forecast, by country
- 7.4.5.1. China
- 7.4.5.1.1. Key market trends, growth factors and opportunities
- 7.4.5.1.2. Market size and forecast, by Type
- 7.4.5.1.2.1. China Food and beverages Upcycled food products Market by Food and beverages sub type
- 7.4.5.1.3. Market size and forecast, by Source
- 7.4.5.1.4. Market size and forecast, by Distribution Channel
- 7.4.5.2. Japan
- 7.4.5.2.1. Key market trends, growth factors and opportunities
- 7.4.5.2.2. Market size and forecast, by Type
- 7.4.5.2.2.1. Japan Food and beverages Upcycled food products Market by Food and beverages sub type
- 7.4.5.2.3. Market size and forecast, by Source
- 7.4.5.2.4. Market size and forecast, by Distribution Channel
- 7.4.5.3. India
- 7.4.5.3.1. Key market trends, growth factors and opportunities
- 7.4.5.3.2. Market size and forecast, by Type
- 7.4.5.3.2.1. India Food and beverages Upcycled food products Market by Food and beverages sub type
- 7.4.5.3.3. Market size and forecast, by Source
- 7.4.5.3.4. Market size and forecast, by Distribution Channel
- 7.4.5.4. Australia
- 7.4.5.4.1. Key market trends, growth factors and opportunities
- 7.4.5.4.2. Market size and forecast, by Type
- 7.4.5.4.2.1. Australia Food and beverages Upcycled food products Market by Food and beverages sub type
- 7.4.5.4.3. Market size and forecast, by Source
- 7.4.5.4.4. Market size and forecast, by Distribution Channel
- 7.4.5.5. New Zealand
- 7.4.5.5.1. Key market trends, growth factors and opportunities
- 7.4.5.5.2. Market size and forecast, by Type
- 7.4.5.5.2.1. New Zealand Food and beverages Upcycled food products Market by Food and beverages sub type
- 7.4.5.5.3. Market size and forecast, by Source
- 7.4.5.5.4. Market size and forecast, by Distribution Channel
- 7.4.5.6. South Korea
- 7.4.5.6.1. Key market trends, growth factors and opportunities
- 7.4.5.6.2. Market size and forecast, by Type
- 7.4.5.6.2.1. South Korea Food and beverages Upcycled food products Market by Food and beverages sub type
- 7.4.5.6.3. Market size and forecast, by Source
- 7.4.5.6.4. Market size and forecast, by Distribution Channel
- 7.4.5.7. Philippines
- 7.4.5.7.1. Key market trends, growth factors and opportunities
- 7.4.5.7.2. Market size and forecast, by Type
- 7.4.5.7.2.1. Philippines Food and beverages Upcycled food products Market by Food and beverages sub type
- 7.4.5.7.3. Market size and forecast, by Source
- 7.4.5.7.4. Market size and forecast, by Distribution Channel
- 7.4.5.8. Rest of Asia-Pacific
- 7.4.5.8.1. Key market trends, growth factors and opportunities
- 7.4.5.8.2. Market size and forecast, by Type
- 7.4.5.8.2.1. Rest of Asia-Pacific Food and beverages Upcycled food products Market by Food and beverages sub type
- 7.4.5.8.3. Market size and forecast, by Source
- 7.4.5.8.4. Market size and forecast, by Distribution Channel
- 7.5. LAMEA
- 7.5.1. Key trends and opportunities
- 7.5.2. Market size and forecast, by Type
- 7.5.2.1. LAMEA Food and beverages Upcycled food products Market by Food and beverages sub type
- 7.5.3. Market size and forecast, by Source
- 7.5.4. Market size and forecast, by Distribution Channel
- 7.5.5. Market size and forecast, by country
- 7.5.5.1. Brazil
- 7.5.5.1.1. Key market trends, growth factors and opportunities
- 7.5.5.1.2. Market size and forecast, by Type
- 7.5.5.1.2.1. Brazil Food and beverages Upcycled food products Market by Food and beverages sub type
- 7.5.5.1.3. Market size and forecast, by Source
- 7.5.5.1.4. Market size and forecast, by Distribution Channel
- 7.5.5.2. Argentina
- 7.5.5.2.1. Key market trends, growth factors and opportunities
- 7.5.5.2.2. Market size and forecast, by Type
- 7.5.5.2.2.1. Argentina Food and beverages Upcycled food products Market by Food and beverages sub type
- 7.5.5.2.3. Market size and forecast, by Source
- 7.5.5.2.4. Market size and forecast, by Distribution Channel
- 7.5.5.3. UAE
- 7.5.5.3.1. Key market trends, growth factors and opportunities
- 7.5.5.3.2. Market size and forecast, by Type
- 7.5.5.3.2.1. UAE Food and beverages Upcycled food products Market by Food and beverages sub type
- 7.5.5.3.3. Market size and forecast, by Source
- 7.5.5.3.4. Market size and forecast, by Distribution Channel
- 7.5.5.4. South Africa
- 7.5.5.4.1. Key market trends, growth factors and opportunities
- 7.5.5.4.2. Market size and forecast, by Type
- 7.5.5.4.2.1. South Africa Food and beverages Upcycled food products Market by Food and beverages sub type
- 7.5.5.4.3. Market size and forecast, by Source
- 7.5.5.4.4. Market size and forecast, by Distribution Channel
- 7.5.5.5. Rest of LAMEA
- 7.5.5.5.1. Key market trends, growth factors and opportunities
- 7.5.5.5.2. Market size and forecast, by Type
- 7.5.5.5.2.1. Rest of LAMEA Food and beverages Upcycled food products Market by Food and beverages sub type
- 7.5.5.5.3. Market size and forecast, by Source
- 7.5.5.5.4. Market size and forecast, by Distribution Channel
CHAPTER 8: COMPETITIVE LANDSCAPE
- 8.1. Introduction
- 8.2. Top winning strategies
- 8.3. Product Mapping of Top 10 Player
- 8.4. Competitive Dashboard
- 8.5. Competitive Heatmap
- 8.6. Top player positioning, 2021
CHAPTER 9: COMPANY PROFILES
- 9.1. Alice & Ambre Inc.
- 9.1.1. Company overview
- 9.1.2. Key Executives
- 9.1.3. Company snapshot
- 9.1.4. Operating business segments
- 9.1.5. Product portfolio
- 9.2. Abokichi
- 9.2.1. Company overview
- 9.2.2. Key Executives
- 9.2.3. Company snapshot
- 9.2.4. Operating business segments
- 9.2.5. Product portfolio
- 9.2.6. Key strategic moves and developments
- 9.3. Diana's Bananas, LLC.
- 9.3.1. Company overview
- 9.3.2. Key Executives
- 9.3.3. Company snapshot
- 9.3.4. Operating business segments
- 9.3.5. Product portfolio
- 9.4. Outcast Foods
- 9.4.1. Company overview
- 9.4.2. Key Executives
- 9.4.3. Company snapshot
- 9.4.4. Operating business segments
- 9.4.5. Product portfolio
- 9.4.6. Key strategic moves and developments
- 9.5. Riff Cold Brewed
- 9.5.1. Company overview
- 9.5.2. Key Executives
- 9.5.3. Company snapshot
- 9.5.4. Operating business segments
- 9.5.5. Product portfolio
- 9.5.6. Key strategic moves and developments
- 9.6. The Spare Food Co.
- 9.6.1. Company overview
- 9.6.2. Key Executives
- 9.6.3. Company snapshot
- 9.6.4. Operating business segments
- 9.6.5. Product portfolio
- 9.6.6. Key strategic moves and developments
- 9.7. ReGrained
- 9.7.1. Company overview
- 9.7.2. Key Executives
- 9.7.3. Company snapshot
- 9.7.4. Operating business segments
- 9.7.5. Product portfolio
- 9.7.6. Key strategic moves and developments
- 9.8. Blue Stripes LLC.
- 9.8.1. Company overview
- 9.8.2. Key Executives
- 9.8.3. Company snapshot
- 9.8.4. Operating business segments
- 9.8.5. Product portfolio
- 9.9. Superfrau
- 9.9.1. Company overview
- 9.9.2. Key Executives
- 9.9.3. Company snapshot
- 9.9.4. Operating business segments
- 9.9.5. Product portfolio
- 9.10. Lost & Found Distillery, Inc.
- 9.10.1. Company overview
- 9.10.2. Key Executives
- 9.10.3. Company snapshot
- 9.10.4. Operating business segments
- 9.10.5. Product portfolio
LIST OF TABLES
- TABLE 01. GLOBAL UPCYCLED FOOD PRODUCTS MARKET, BY TYPE, 2021-2031 ($MILLION)
- TABLE 02. UPCYCLED FOOD PRODUCTS MARKET FOR FOOD AND BEVERAGES, BY REGION, 2021-2031 ($MILLION)
- TABLE 03. GLOBAL FOOD AND BEVERAGES UPCYCLED FOOD PRODUCTS MARKET, BY FOOD AND BEVERAGES SUB TYPE, 2021-2031 ($MILLION)
- TABLE 04. UPCYCLED FOOD PRODUCTS MARKET FOR BAKERY AND SNACKS, BY REGION, 2021-2031 ($MILLION)
- TABLE 05. UPCYCLED FOOD PRODUCTS MARKET FOR DRINKING BEVERAGES, BY REGION, 2021-2031 ($MILLION)
- TABLE 06. UPCYCLED FOOD PRODUCTS MARKET FOR DAIRY PRODUCTS, BY REGION, 2021-2031 ($MILLION)
- TABLE 07. UPCYCLED FOOD PRODUCTS MARKET FOR PERSONAL CARE PRODUCTS, BY REGION, 2021-2031 ($MILLION)
- TABLE 08. UPCYCLED FOOD PRODUCTS MARKET FOR HOUSEHOLD PRODUCTS, BY REGION, 2021-2031 ($MILLION)
- TABLE 09. UPCYCLED FOOD PRODUCTS MARKET FOR PET FOOD, BY REGION, 2021-2031 ($MILLION)
- TABLE 10. GLOBAL UPCYCLED FOOD PRODUCTS MARKET, BY SOURCE, 2021-2031 ($MILLION)
- TABLE 11. UPCYCLED FOOD PRODUCTS MARKET FOR FOOD WASTE, BY REGION, 2021-2031 ($MILLION)
- TABLE 12. UPCYCLED FOOD PRODUCTS MARKET FOR AGRICULTURAL BY PRODUCTS, BY REGION, 2021-2031 ($MILLION)
- TABLE 13. UPCYCLED FOOD PRODUCTS MARKET FOR BREWERY AND DISTILLERY WASTE, BY REGION, 2021-2031 ($MILLION)
- TABLE 14. GLOBAL UPCYCLED FOOD PRODUCTS MARKET, BY DISTRIBUTION CHANNEL, 2021-2031 ($MILLION)
- TABLE 15. UPCYCLED FOOD PRODUCTS MARKET FOR ONLINE, BY REGION, 2021-2031 ($MILLION)
- TABLE 16. UPCYCLED FOOD PRODUCTS MARKET FOR OFFLINE, BY REGION, 2021-2031 ($MILLION)
- TABLE 17. UPCYCLED FOOD PRODUCTS MARKET, BY REGION, 2021-2031 ($MILLION)
- TABLE 18. NORTH AMERICA UPCYCLED FOOD PRODUCTS MARKET, BY TYPE, 2021-2031 ($MILLION)
- TABLE 19. NORTH AMERICA FOOD AND BEVERAGES UPCYCLED FOOD PRODUCTS MARKET, BY FOOD AND BEVERAGES SUB TYPE, 2021-2031 ($MILLION)
- TABLE 20. NORTH AMERICA UPCYCLED FOOD PRODUCTS MARKET, BY SOURCE, 2021-2031 ($MILLION)
- TABLE 21. NORTH AMERICA UPCYCLED FOOD PRODUCTS MARKET, BY DISTRIBUTION CHANNEL, 2021-2031 ($MILLION)
- TABLE 22. NORTH AMERICA UPCYCLED FOOD PRODUCTS MARKET, BY COUNTRY, 2021-2031 ($MILLION)
- TABLE 23. U.S. UPCYCLED FOOD PRODUCTS MARKET, BY TYPE, 2021-2031 ($MILLION)
- TABLE 24. U.S. FOOD AND BEVERAGES UPCYCLED FOOD PRODUCTS MARKET, BY FOOD AND BEVERAGES SUB TYPE, 2021-2031 ($MILLION)
- TABLE 25. U.S. UPCYCLED FOOD PRODUCTS MARKET, BY SOURCE, 2021-2031 ($MILLION)
- TABLE 26. U.S. UPCYCLED FOOD PRODUCTS MARKET, BY DISTRIBUTION CHANNEL, 2021-2031 ($MILLION)
- TABLE 27. CANADA UPCYCLED FOOD PRODUCTS MARKET, BY TYPE, 2021-2031 ($MILLION)
- TABLE 28. CANADA FOOD AND BEVERAGES UPCYCLED FOOD PRODUCTS MARKET, BY FOOD AND BEVERAGES SUB TYPE, 2021-2031 ($MILLION)
- TABLE 29. CANADA UPCYCLED FOOD PRODUCTS MARKET, BY SOURCE, 2021-2031 ($MILLION)
- TABLE 30. CANADA UPCYCLED FOOD PRODUCTS MARKET, BY DISTRIBUTION CHANNEL, 2021-2031 ($MILLION)
- TABLE 31. MEXICO UPCYCLED FOOD PRODUCTS MARKET, BY TYPE, 2021-2031 ($MILLION)
- TABLE 32. MEXICO FOOD AND BEVERAGES UPCYCLED FOOD PRODUCTS MARKET, BY FOOD AND BEVERAGES SUB TYPE, 2021-2031 ($MILLION)
- TABLE 33. MEXICO UPCYCLED FOOD PRODUCTS MARKET, BY SOURCE, 2021-2031 ($MILLION)
- TABLE 34. MEXICO UPCYCLED FOOD PRODUCTS MARKET, BY DISTRIBUTION CHANNEL, 2021-2031 ($MILLION)
- TABLE 35. EUROPE UPCYCLED FOOD PRODUCTS MARKET, BY TYPE, 2021-2031 ($MILLION)
- TABLE 36. EUROPE FOOD AND BEVERAGES UPCYCLED FOOD PRODUCTS MARKET, BY FOOD AND BEVERAGES SUB TYPE, 2021-2031 ($MILLION)
- TABLE 37. EUROPE UPCYCLED FOOD PRODUCTS MARKET, BY SOURCE, 2021-2031 ($MILLION)
- TABLE 38. EUROPE UPCYCLED FOOD PRODUCTS MARKET, BY DISTRIBUTION CHANNEL, 2021-2031 ($MILLION)
- TABLE 39. EUROPE UPCYCLED FOOD PRODUCTS MARKET, BY COUNTRY, 2021-2031 ($MILLION)
- TABLE 40. UK UPCYCLED FOOD PRODUCTS MARKET, BY TYPE, 2021-2031 ($MILLION)
- TABLE 41. UK FOOD AND BEVERAGES UPCYCLED FOOD PRODUCTS MARKET, BY FOOD AND BEVERAGES SUB TYPE, 2021-2031 ($MILLION)
- TABLE 42. UK UPCYCLED FOOD PRODUCTS MARKET, BY SOURCE, 2021-2031 ($MILLION)
- TABLE 43. UK UPCYCLED FOOD PRODUCTS MARKET, BY DISTRIBUTION CHANNEL, 2021-2031 ($MILLION)
- TABLE 44. GERMANY UPCYCLED FOOD PRODUCTS MARKET, BY TYPE, 2021-2031 ($MILLION)
- TABLE 45. GERMANY FOOD AND BEVERAGES UPCYCLED FOOD PRODUCTS MARKET, BY FOOD AND BEVERAGES SUB TYPE, 2021-2031 ($MILLION)
- TABLE 46. GERMANY UPCYCLED FOOD PRODUCTS MARKET, BY SOURCE, 2021-2031 ($MILLION)
- TABLE 47. GERMANY UPCYCLED FOOD PRODUCTS MARKET, BY DISTRIBUTION CHANNEL, 2021-2031 ($MILLION)
- TABLE 48. FRANCE UPCYCLED FOOD PRODUCTS MARKET, BY TYPE, 2021-2031 ($MILLION)
- TABLE 49. FRANCE FOOD AND BEVERAGES UPCYCLED FOOD PRODUCTS MARKET, BY FOOD AND BEVERAGES SUB TYPE, 2021-2031 ($MILLION)
- TABLE 50. FRANCE UPCYCLED FOOD PRODUCTS MARKET, BY SOURCE, 2021-2031 ($MILLION)
- TABLE 51. FRANCE UPCYCLED FOOD PRODUCTS MARKET, BY DISTRIBUTION CHANNEL, 2021-2031 ($MILLION)
- TABLE 52. NETHERLANDS UPCYCLED FOOD PRODUCTS MARKET, BY TYPE, 2021-2031 ($MILLION)
- TABLE 53. NETHERLANDS FOOD AND BEVERAGES UPCYCLED FOOD PRODUCTS MARKET, BY FOOD AND BEVERAGES SUB TYPE, 2021-2031 ($MILLION)
- TABLE 54. NETHERLANDS UPCYCLED FOOD PRODUCTS MARKET, BY SOURCE, 2021-2031 ($MILLION)
- TABLE 55. NETHERLANDS UPCYCLED FOOD PRODUCTS MARKET, BY DISTRIBUTION CHANNEL, 2021-2031 ($MILLION)
- TABLE 56. ITALY UPCYCLED FOOD PRODUCTS MARKET, BY TYPE, 2021-2031 ($MILLION)
- TABLE 57. ITALY FOOD AND BEVERAGES UPCYCLED FOOD PRODUCTS MARKET, BY FOOD AND BEVERAGES SUB TYPE, 2021-2031 ($MILLION)
- TABLE 58. ITALY UPCYCLED FOOD PRODUCTS MARKET, BY SOURCE, 2021-2031 ($MILLION)
- TABLE 59. ITALY UPCYCLED FOOD PRODUCTS MARKET, BY DISTRIBUTION CHANNEL, 2021-2031 ($MILLION)
- TABLE 60. SPAIN UPCYCLED FOOD PRODUCTS MARKET, BY TYPE, 2021-2031 ($MILLION)
- TABLE 61. SPAIN FOOD AND BEVERAGES UPCYCLED FOOD PRODUCTS MARKET, BY FOOD AND BEVERAGES SUB TYPE, 2021-2031 ($MILLION)
- TABLE 62. SPAIN UPCYCLED FOOD PRODUCTS MARKET, BY SOURCE, 2021-2031 ($MILLION)
- TABLE 63. SPAIN UPCYCLED FOOD PRODUCTS MARKET, BY DISTRIBUTION CHANNEL, 2021-2031 ($MILLION)
- TABLE 64. RUSSIA UPCYCLED FOOD PRODUCTS MARKET, BY TYPE, 2021-2031 ($MILLION)
- TABLE 65. RUSSIA FOOD AND BEVERAGES UPCYCLED FOOD PRODUCTS MARKET, BY FOOD AND BEVERAGES SUB TYPE, 2021-2031 ($MILLION)
- TABLE 66. RUSSIA UPCYCLED FOOD PRODUCTS MARKET, BY SOURCE, 2021-2031 ($MILLION)
- TABLE 67. RUSSIA UPCYCLED FOOD PRODUCTS MARKET, BY DISTRIBUTION CHANNEL, 2021-2031 ($MILLION)
- TABLE 68. REST OF EUROPE UPCYCLED FOOD PRODUCTS MARKET, BY TYPE, 2021-2031 ($MILLION)
- TABLE 69. REST OF EUROPE FOOD AND BEVERAGES UPCYCLED FOOD PRODUCTS MARKET, BY FOOD AND BEVERAGES SUB TYPE, 2021-2031 ($MILLION)
- TABLE 70. REST OF EUROPE UPCYCLED FOOD PRODUCTS MARKET, BY SOURCE, 2021-2031 ($MILLION)
- TABLE 71. REST OF EUROPE UPCYCLED FOOD PRODUCTS MARKET, BY DISTRIBUTION CHANNEL, 2021-2031 ($MILLION)
- TABLE 72. ASIA-PACIFIC UPCYCLED FOOD PRODUCTS MARKET, BY TYPE, 2021-2031 ($MILLION)
- TABLE 73. ASIA-PACIFIC FOOD AND BEVERAGES UPCYCLED FOOD PRODUCTS MARKET, BY FOOD AND BEVERAGES SUB TYPE, 2021-2031 ($MILLION)
- TABLE 74. ASIA-PACIFIC UPCYCLED FOOD PRODUCTS MARKET, BY SOURCE, 2021-2031 ($MILLION)
- TABLE 75. ASIA-PACIFIC UPCYCLED FOOD PRODUCTS MARKET, BY DISTRIBUTION CHANNEL, 2021-2031 ($MILLION)
- TABLE 76. ASIA-PACIFIC UPCYCLED FOOD PRODUCTS MARKET, BY COUNTRY, 2021-2031 ($MILLION)
- TABLE 77. CHINA UPCYCLED FOOD PRODUCTS MARKET, BY TYPE, 2021-2031 ($MILLION)
- TABLE 78. CHINA FOOD AND BEVERAGES UPCYCLED FOOD PRODUCTS MARKET, BY FOOD AND BEVERAGES SUB TYPE, 2021-2031 ($MILLION)
- TABLE 79. CHINA UPCYCLED FOOD PRODUCTS MARKET, BY SOURCE, 2021-2031 ($MILLION)
- TABLE 80. CHINA UPCYCLED FOOD PRODUCTS MARKET, BY DISTRIBUTION CHANNEL, 2021-2031 ($MILLION)
- TABLE 81. JAPAN UPCYCLED FOOD PRODUCTS MARKET, BY TYPE, 2021-2031 ($MILLION)
- TABLE 82. JAPAN FOOD AND BEVERAGES UPCYCLED FOOD PRODUCTS MARKET, BY FOOD AND BEVERAGES SUB TYPE, 2021-2031 ($MILLION)
- TABLE 83. JAPAN UPCYCLED FOOD PRODUCTS MARKET, BY SOURCE, 2021-2031 ($MILLION)
- TABLE 84. JAPAN UPCYCLED FOOD PRODUCTS MARKET, BY DISTRIBUTION CHANNEL, 2021-2031 ($MILLION)
- TABLE 85. INDIA UPCYCLED FOOD PRODUCTS MARKET, BY TYPE, 2021-2031 ($MILLION)
- TABLE 86. INDIA FOOD AND BEVERAGES UPCYCLED FOOD PRODUCTS MARKET, BY FOOD AND BEVERAGES SUB TYPE, 2021-2031 ($MILLION)
- TABLE 87. INDIA UPCYCLED FOOD PRODUCTS MARKET, BY SOURCE, 2021-2031 ($MILLION)
- TABLE 88. INDIA UPCYCLED FOOD PRODUCTS MARKET, BY DISTRIBUTION CHANNEL, 2021-2031 ($MILLION)
- TABLE 89. AUSTRALIA UPCYCLED FOOD PRODUCTS MARKET, BY TYPE, 2021-2031 ($MILLION)
- TABLE 90. AUSTRALIA FOOD AND BEVERAGES UPCYCLED FOOD PRODUCTS MARKET, BY FOOD AND BEVERAGES SUB TYPE, 2021-2031 ($MILLION)
- TABLE 91. AUSTRALIA UPCYCLED FOOD PRODUCTS MARKET, BY SOURCE, 2021-2031 ($MILLION)
- TABLE 92. AUSTRALIA UPCYCLED FOOD PRODUCTS MARKET, BY DISTRIBUTION CHANNEL, 2021-2031 ($MILLION)
- TABLE 93. NEW ZEALAND UPCYCLED FOOD PRODUCTS MARKET, BY TYPE, 2021-2031 ($MILLION)
- TABLE 94. NEW ZEALAND FOOD AND BEVERAGES UPCYCLED FOOD PRODUCTS MARKET, BY FOOD AND BEVERAGES SUB TYPE, 2021-2031 ($MILLION)
- TABLE 95. NEW ZEALAND UPCYCLED FOOD PRODUCTS MARKET, BY SOURCE, 2021-2031 ($MILLION)
- TABLE 96. NEW ZEALAND UPCYCLED FOOD PRODUCTS MARKET, BY DISTRIBUTION CHANNEL, 2021-2031 ($MILLION)
- TABLE 97. SOUTH KOREA UPCYCLED FOOD PRODUCTS MARKET, BY TYPE, 2021-2031 ($MILLION)
- TABLE 98. SOUTH KOREA FOOD AND BEVERAGES UPCYCLED FOOD PRODUCTS MARKET, BY FOOD AND BEVERAGES SUB TYPE, 2021-2031 ($MILLION)
- TABLE 99. SOUTH KOREA UPCYCLED FOOD PRODUCTS MARKET, BY SOURCE, 2021-2031 ($MILLION)
- TABLE 100. SOUTH KOREA UPCYCLED FOOD PRODUCTS MARKET, BY DISTRIBUTION CHANNEL, 2021-2031 ($MILLION)
- TABLE 101. PHILIPPINES UPCYCLED FOOD PRODUCTS MARKET, BY TYPE, 2021-2031 ($MILLION)
- TABLE 102. PHILIPPINES FOOD AND BEVERAGES UPCYCLED FOOD PRODUCTS MARKET, BY FOOD AND BEVERAGES SUB TYPE, 2021-2031 ($MILLION)
- TABLE 103. PHILIPPINES UPCYCLED FOOD PRODUCTS MARKET, BY SOURCE, 2021-2031 ($MILLION)
- TABLE 104. PHILIPPINES UPCYCLED FOOD PRODUCTS MARKET, BY DISTRIBUTION CHANNEL, 2021-2031 ($MILLION)
- TABLE 105. REST OF ASIA-PACIFIC UPCYCLED FOOD PRODUCTS MARKET, BY TYPE, 2021-2031 ($MILLION)
- TABLE 106. REST OF ASIA-PACIFIC FOOD AND BEVERAGES UPCYCLED FOOD PRODUCTS MARKET, BY FOOD AND BEVERAGES SUB TYPE, 2021-2031 ($MILLION)
- TABLE 107. REST OF ASIA-PACIFIC UPCYCLED FOOD PRODUCTS MARKET, BY SOURCE, 2021-2031 ($MILLION)
- TABLE 108. REST OF ASIA-PACIFIC UPCYCLED FOOD PRODUCTS MARKET, BY DISTRIBUTION CHANNEL, 2021-2031 ($MILLION)
- TABLE 109. LAMEA UPCYCLED FOOD PRODUCTS MARKET, BY TYPE, 2021-2031 ($MILLION)
- TABLE 110. LAMEA FOOD AND BEVERAGES UPCYCLED FOOD PRODUCTS MARKET, BY FOOD AND BEVERAGES SUB TYPE, 2021-2031 ($MILLION)
- TABLE 111. LAMEA UPCYCLED FOOD PRODUCTS MARKET, BY SOURCE, 2021-2031 ($MILLION)
- TABLE 112. LAMEA UPCYCLED FOOD PRODUCTS MARKET, BY DISTRIBUTION CHANNEL, 2021-2031 ($MILLION)
- TABLE 113. LAMEA UPCYCLED FOOD PRODUCTS MARKET, BY COUNTRY, 2021-2031 ($MILLION)
- TABLE 114. BRAZIL UPCYCLED FOOD PRODUCTS MARKET, BY TYPE, 2021-2031 ($MILLION)
- TABLE 115. BRAZIL FOOD AND BEVERAGES UPCYCLED FOOD PRODUCTS MARKET, BY FOOD AND BEVERAGES SUB TYPE, 2021-2031 ($MILLION)
- TABLE 116. BRAZIL UPCYCLED FOOD PRODUCTS MARKET, BY SOURCE, 2021-2031 ($MILLION)
- TABLE 117. BRAZIL UPCYCLED FOOD PRODUCTS MARKET, BY DISTRIBUTION CHANNEL, 2021-2031 ($MILLION)
- TABLE 118. ARGENTINA UPCYCLED FOOD PRODUCTS MARKET, BY TYPE, 2021-2031 ($MILLION)
- TABLE 119. ARGENTINA FOOD AND BEVERAGES UPCYCLED FOOD PRODUCTS MARKET, BY FOOD AND BEVERAGES SUB TYPE, 2021-2031 ($MILLION)
- TABLE 120. ARGENTINA UPCYCLED FOOD PRODUCTS MARKET, BY SOURCE, 2021-2031 ($MILLION)
- TABLE 121. ARGENTINA UPCYCLED FOOD PRODUCTS MARKET, BY DISTRIBUTION CHANNEL, 2021-2031 ($MILLION)
- TABLE 122. UAE UPCYCLED FOOD PRODUCTS MARKET, BY TYPE, 2021-2031 ($MILLION)
- TABLE 123. UAE FOOD AND BEVERAGES UPCYCLED FOOD PRODUCTS MARKET, BY FOOD AND BEVERAGES SUB TYPE, 2021-2031 ($MILLION)
- TABLE 124. UAE UPCYCLED FOOD PRODUCTS MARKET, BY SOURCE, 2021-2031 ($MILLION)
- TABLE 125. UAE UPCYCLED FOOD PRODUCTS MARKET, BY DISTRIBUTION CHANNEL, 2021-2031 ($MILLION)
- TABLE 126. SOUTH AFRICA UPCYCLED FOOD PRODUCTS MARKET, BY TYPE, 2021-2031 ($MILLION)
- TABLE 127. SOUTH AFRICA FOOD AND BEVERAGES UPCYCLED FOOD PRODUCTS MARKET, BY FOOD AND BEVERAGES SUB TYPE, 2021-2031 ($MILLION)
- TABLE 128. SOUTH AFRICA UPCYCLED FOOD PRODUCTS MARKET, BY SOURCE, 2021-2031 ($MILLION)
- TABLE 129. SOUTH AFRICA UPCYCLED FOOD PRODUCTS MARKET, BY DISTRIBUTION CHANNEL, 2021-2031 ($MILLION)
- TABLE 130. REST OF LAMEA UPCYCLED FOOD PRODUCTS MARKET, BY TYPE, 2021-2031 ($MILLION)
- TABLE 131. REST OF LAMEA FOOD AND BEVERAGES UPCYCLED FOOD PRODUCTS MARKET, BY FOOD AND BEVERAGES SUB TYPE, 2021-2031 ($MILLION)
- TABLE 132. REST OF LAMEA UPCYCLED FOOD PRODUCTS MARKET, BY SOURCE, 2021-2031 ($MILLION)
- TABLE 133. REST OF LAMEA UPCYCLED FOOD PRODUCTS MARKET, BY DISTRIBUTION CHANNEL, 2021-2031 ($MILLION)
- TABLE 134. ALICE & AMBRE INC.: KEY EXECUTIVES
- TABLE 135. ALICE & AMBRE INC.: COMPANY SNAPSHOT
- TABLE 136. ALICE & AMBRE INC.: PRODUCT SEGMENTS
- TABLE 137. ALICE & AMBRE INC.: PRODUCT PORTFOLIO
- TABLE 138. ABOKICHI: KEY EXECUTIVES
- TABLE 139. ABOKICHI: COMPANY SNAPSHOT
- TABLE 140. ABOKICHI: PRODUCT SEGMENTS
- TABLE 141. ABOKICHI: PRODUCT PORTFOLIO
- TABLE 142. ABOKICHI: KEY STRATERGIES
- TABLE 143. DIANA'S BANANAS, LLC.: KEY EXECUTIVES
- TABLE 144. DIANA'S BANANAS, LLC.: COMPANY SNAPSHOT
- TABLE 145. DIANA'S BANANAS, LLC.: PRODUCT SEGMENTS
- TABLE 146. DIANA'S BANANAS, LLC.: PRODUCT PORTFOLIO
- TABLE 147. OUTCAST FOODS: KEY EXECUTIVES
- TABLE 148. OUTCAST FOODS: COMPANY SNAPSHOT
- TABLE 149. OUTCAST FOODS: PRODUCT SEGMENTS
- TABLE 150. OUTCAST FOODS: PRODUCT PORTFOLIO
- TABLE 151. OUTCAST FOODS: KEY STRATERGIES
- TABLE 152. RIFF COLD BREWED: KEY EXECUTIVES
- TABLE 153. RIFF COLD BREWED: COMPANY SNAPSHOT
- TABLE 154. RIFF COLD BREWED: PRODUCT SEGMENTS
- TABLE 155. RIFF COLD BREWED: PRODUCT PORTFOLIO
- TABLE 156. RIFF COLD BREWED: KEY STRATERGIES
- TABLE 157. THE SPARE FOOD CO.: KEY EXECUTIVES
- TABLE 158. THE SPARE FOOD CO.: COMPANY SNAPSHOT
- TABLE 159. THE SPARE FOOD CO.: PRODUCT SEGMENTS
- TABLE 160. THE SPARE FOOD CO.: PRODUCT PORTFOLIO
- TABLE 161. THE SPARE FOOD CO.: KEY STRATERGIES
- TABLE 162. REGRAINED: KEY EXECUTIVES
- TABLE 163. REGRAINED: COMPANY SNAPSHOT
- TABLE 164. REGRAINED: PRODUCT SEGMENTS
- TABLE 165. REGRAINED: PRODUCT PORTFOLIO
- TABLE 166. REGRAINED: KEY STRATERGIES
- TABLE 167. BLUE STRIPES LLC.: KEY EXECUTIVES
- TABLE 168. BLUE STRIPES LLC.: COMPANY SNAPSHOT
- TABLE 169. BLUE STRIPES LLC.: PRODUCT SEGMENTS
- TABLE 170. BLUE STRIPES LLC.: PRODUCT PORTFOLIO
- TABLE 171. SUPERFRAU: KEY EXECUTIVES
- TABLE 172. SUPERFRAU: COMPANY SNAPSHOT
- TABLE 173. SUPERFRAU: PRODUCT SEGMENTS
- TABLE 174. SUPERFRAU: PRODUCT PORTFOLIO
- TABLE 175. LOST & FOUND DISTILLERY, INC.: KEY EXECUTIVES
- TABLE 176. LOST & FOUND DISTILLERY, INC.: COMPANY SNAPSHOT
- TABLE 177. LOST & FOUND DISTILLERY, INC.: PRODUCT SEGMENTS
- TABLE 178. LOST & FOUND DISTILLERY, INC.: PRODUCT PORTFOLIO
LIST OF FIGURES
- FIGURE 01. UPCYCLED FOOD PRODUCTS MARKET, 2021-2031
- FIGURE 02. SEGMENTATION OF UPCYCLED FOOD PRODUCTS MARKET, 2021-2031
- FIGURE 03. TOP INVESTMENT POCKETS IN UPCYCLED FOOD PRODUCTS MARKET (2022-2031)
- FIGURE 04. LOW BARGAINING POWER OF SUPPLIERS
- FIGURE 05. LOW BARGAINING POWER OF BUYERS
- FIGURE 06. LOW THREAT OF SUBSTITUTES
- FIGURE 07. LOW THREAT OF NEW ENTRANTS
- FIGURE 08. LOW INTENSITY OF RIVALRY
- FIGURE 09. DRIVERS, RESTRAINTS AND OPPORTUNITIES: GLOBALUPCYCLED FOOD PRODUCTS MARKET
- FIGURE 10. VALUE CHAIN ANALYSIS: UPCYCLED FOOD PRODUCTS MARKET
- FIGURE 11. UPCYCLED FOOD PRODUCTS MARKET, BY TYPE, 2021(%)
- FIGURE 12. COMPARATIVE SHARE ANALYSIS OF UPCYCLED FOOD PRODUCTS MARKET FOR FOOD AND BEVERAGES, BY COUNTRY 2021 AND 2031(%)
- FIGURE 13. COMPARATIVE SHARE ANALYSIS OF UPCYCLED FOOD PRODUCTS MARKET FOR PERSONAL CARE PRODUCTS, BY COUNTRY 2021 AND 2031(%)
- FIGURE 14. COMPARATIVE SHARE ANALYSIS OF UPCYCLED FOOD PRODUCTS MARKET FOR HOUSEHOLD PRODUCTS, BY COUNTRY 2021 AND 2031(%)
- FIGURE 15. COMPARATIVE SHARE ANALYSIS OF UPCYCLED FOOD PRODUCTS MARKET FOR PET FOOD, BY COUNTRY 2021 AND 2031(%)
- FIGURE 16. UPCYCLED FOOD PRODUCTS MARKET, BY SOURCE, 2021(%)
- FIGURE 17. COMPARATIVE SHARE ANALYSIS OF UPCYCLED FOOD PRODUCTS MARKET FOR FOOD WASTE, BY COUNTRY 2021 AND 2031(%)
- FIGURE 18. COMPARATIVE SHARE ANALYSIS OF UPCYCLED FOOD PRODUCTS MARKET FOR AGRICULTURAL BY PRODUCTS, BY COUNTRY 2021 AND 2031(%)
- FIGURE 19. COMPARATIVE SHARE ANALYSIS OF UPCYCLED FOOD PRODUCTS MARKET FOR BREWERY AND DISTILLERY WASTE, BY COUNTRY 2021 AND 2031(%)
- FIGURE 20. UPCYCLED FOOD PRODUCTS MARKET, BY DISTRIBUTION CHANNEL, 2021(%)
- FIGURE 21. COMPARATIVE SHARE ANALYSIS OF UPCYCLED FOOD PRODUCTS MARKET FOR ONLINE, BY COUNTRY 2021 AND 2031(%)
- FIGURE 22. COMPARATIVE SHARE ANALYSIS OF UPCYCLED FOOD PRODUCTS MARKET FOR OFFLINE, BY COUNTRY 2021 AND 2031(%)
- FIGURE 23. UPCYCLED FOOD PRODUCTS MARKET BY REGION, 2021
- FIGURE 24. U.S. UPCYCLED FOOD PRODUCTS MARKET, 2021-2031 ($MILLION)
- FIGURE 25. CANADA UPCYCLED FOOD PRODUCTS MARKET, 2021-2031 ($MILLION)
- FIGURE 26. MEXICO UPCYCLED FOOD PRODUCTS MARKET, 2021-2031 ($MILLION)
- FIGURE 27. UK UPCYCLED FOOD PRODUCTS MARKET, 2021-2031 ($MILLION)
- FIGURE 28. GERMANY UPCYCLED FOOD PRODUCTS MARKET, 2021-2031 ($MILLION)
- FIGURE 29. FRANCE UPCYCLED FOOD PRODUCTS MARKET, 2021-2031 ($MILLION)
- FIGURE 30. NETHERLANDS UPCYCLED FOOD PRODUCTS MARKET, 2021-2031 ($MILLION)
- FIGURE 31. ITALY UPCYCLED FOOD PRODUCTS MARKET, 2021-2031 ($MILLION)
- FIGURE 32. SPAIN UPCYCLED FOOD PRODUCTS MARKET, 2021-2031 ($MILLION)
- FIGURE 33. RUSSIA UPCYCLED FOOD PRODUCTS MARKET, 2021-2031 ($MILLION)
- FIGURE 34. REST OF EUROPE UPCYCLED FOOD PRODUCTS MARKET, 2021-2031 ($MILLION)
- FIGURE 35. CHINA UPCYCLED FOOD PRODUCTS MARKET, 2021-2031 ($MILLION)
- FIGURE 36. JAPAN UPCYCLED FOOD PRODUCTS MARKET, 2021-2031 ($MILLION)
- FIGURE 37. INDIA UPCYCLED FOOD PRODUCTS MARKET, 2021-2031 ($MILLION)
- FIGURE 38. AUSTRALIA UPCYCLED FOOD PRODUCTS MARKET, 2021-2031 ($MILLION)
- FIGURE 39. NEW ZEALAND UPCYCLED FOOD PRODUCTS MARKET, 2021-2031 ($MILLION)
- FIGURE 40. SOUTH KOREA UPCYCLED FOOD PRODUCTS MARKET, 2021-2031 ($MILLION)
- FIGURE 41. PHILIPPINES UPCYCLED FOOD PRODUCTS MARKET, 2021-2031 ($MILLION)
- FIGURE 42. REST OF ASIA-PACIFIC UPCYCLED FOOD PRODUCTS MARKET, 2021-2031 ($MILLION)
- FIGURE 43. BRAZIL UPCYCLED FOOD PRODUCTS MARKET, 2021-2031 ($MILLION)
- FIGURE 44. ARGENTINA UPCYCLED FOOD PRODUCTS MARKET, 2021-2031 ($MILLION)
- FIGURE 45. UAE UPCYCLED FOOD PRODUCTS MARKET, 2021-2031 ($MILLION)
- FIGURE 46. SOUTH AFRICA UPCYCLED FOOD PRODUCTS MARKET, 2021-2031 ($MILLION)
- FIGURE 47. REST OF LAMEA UPCYCLED FOOD PRODUCTS MARKET, 2021-2031 ($MILLION)
- FIGURE 48. TOP WINNING STRATEGIES, BY YEAR
- FIGURE 49. TOP WINNING STRATEGIES, BY DEVELOPMENT
- FIGURE 50. TOP WINNING STRATEGIES, BY COMPANY
- FIGURE 51. PRODUCT MAPPING OF TOP 10 PLAYERS
- FIGURE 52. COMPETITIVE DASHBOARD
- FIGURE 53. COMPETITIVE HEATMAP: UPCYCLED FOOD PRODUCTS MARKET
- FIGURE 54. TOP PLAYER POSITIONING, 2021

