
PUBLISHER: Allied Market Research | PRODUCT CODE: 1344263

PUBLISHER: Allied Market Research | PRODUCT CODE: 1344263
Gasification Market By Type, By Feedstock, By Feed Type, By Gasifier Medium, By Application (Electricity, Chemicals, Fertilizers, Liquid Fuels, Synthetic Natural Gas, Hydrogen): Global Opportunity Analysis and Industry Forecast, 2023-2032
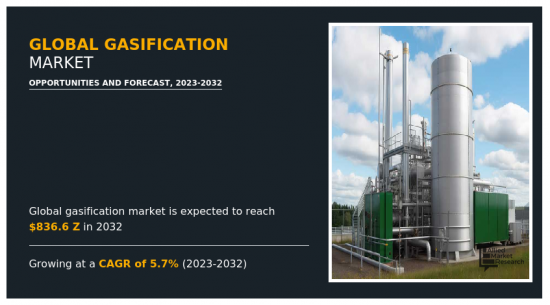
According to a new report published by Allied Market Research, titled, "Global Gasification Market," The global gasification market was valued at $472.20 billion in 2022, and is estimated to reach $836.6 billion by 2032, growing at a CAGR of 5.7% from 2023 to 2032. Gasification is a process that converts carbonaceous materials, such as coal, biomass, or municipal solid waste, into a gaseous fuel called syngas (synthetic gas). It involves heating the feedstock at high temperatures in an oxygen-limited environment, resulting in the partial oxidation of the material. During gasification, the carbonaceous material reacts with a controlled amount of oxygen or steam, producing a mixture of gases composed mainly of carbon monoxide (CO), hydrogen (H2), carbon dioxide (CO2), methane (CH4), and other trace gases. The ratio of oxygen to carbon is carefully regulated to achieve the desired composition of the syngas.
Ongoing R&D activities are driving technological advancements in gasification. Improvements in process efficiency, feedstock flexibility, gas cleaning, and carbon capture technologies are making gasification more economically viable and environmentally sustainable. Advancements in gasification also enable the integration with other renewable energy sources, such as solar and wind, to create hybrid energy systems. Numerous governments are implementing policies, rules, and financial incentives into place to support clean energy technologies and lower greenhouse gas emissions. This assistance includes money for R&D, tax breaks, grants, and subsidies for gasification projects. These government programs create a positive business situation and encourage financial investments in the gasification market.
Gasification technology is complex and requires sophisticated equipment and processes. There are technical challenges involved in effectively handling and converting different feedstocks, ensuring gas quality, managing by-products such as ash and slag, and addressing operational issues like equipment maintenance and reliability. Overcoming these technical challenges can be time-consuming and resource-intensive.
An increasing understanding of sustainability and environmental awareness has led to an increase in interest in gasification as a clean energy replacement. Gasification techniques are being used in production and manufacturing facilities due to increased industrialization and the expanding electrical, chemical, and oil & gas sectors. The demand for biomass gasification in the municipal sector is quickly rising due to the widespread use of gasification for waste disposal and the recycling of complex compost.
The COVID-19 pandemic had significant impact on the market for gasification. The pandemic caused disruptions in project development activities due to lockdowns, travel restrictions, and supply chain disruptions. Construction activities, equipment procurement, and site inspections were delayed or halted, affecting the progress of gasification projects. The pandemic created economic uncertainty, which impacted investment decisions and financing availability for gasification projects.
The key players profiled in this report include: Royal Dutch Shell, Air Liquide, General Electric, Mitsubishi Heavy Industries, SEDIN Engineering Company Limited, Siemens, CB&I, KBR, Thyssenkrupp AG and Synthesis Energy Systems Inc. The market players are continuously striving to achieve an upper hand in this competitive market using strategies such as collaborations and acquisitions.
Key Benefits For Stakeholders
- This report provides a quantitative analysis of the market segments, current trends, estimations, and dynamics of the global gasification market analysis from 2022 to 2032 to identify the prevailing global gasification market opportunities.
- The market research is offered along with information related to key drivers, restraints, and opportunities.
- Porter's five forces analysis highlights the potency of buyers and suppliers to enable stakeholders make profit-oriented business decisions and strengthen their supplier-buyer network.
- In-depth analysis of the global gasification market segmentation assists to determine the prevailing market opportunities.
- Major countries in each region are mapped according to their revenue contribution to the global market.
- Market player positioning facilitates benchmarking and provides a clear understanding of the present position of the market players.
- The report includes the analysis of the regional as well as global global gasification market trends, key players, market segments, application areas, and market growth strategies.
Key Market Segments
By Gasifier Medium
- Air
- Oxygen
- Vapor
By Application
- Electricity
- Chemicals
- Fertilizers
- Liquid Fuels
- Synthetic Natural Gas (SNG)
- Hydrogen
By Type
- Fixed Bed
- Fluidized Bed
- Entrained Flow
By Feedstock
- Biomass
- Waste
- Coal
- Petroleum
- Gas
- Petcoke
By Feed Type
- Dry
- Slurry
By Region
- North America
- U.S.
- Canada
- Mexico
- Europe
- Germany
- UK
- France
- Netherlands
- Austria
- Rest of Europe
- Asia-Pacific
- China
- Japan
- India
- South Korea
- Australia
- Rest of Asia-Pacific
- LAMEA
- Brazil
- UAE
- Saudi Arabia
- South Africa
- Rest of LAMEA
Key Market Players:
- Air Liquide
- CB&I
- General Electric
- KBR Inc.
- Mitsubishi Heavy Industries
- SEDIN Engineering Company Limited
- Shell Plc.
- Siemens
- Synthesis Energy Systems Inc.
- ThyssenKrupp AG.
TABLE OF CONTENTS
CHAPTER 1: INTRODUCTION
- 1.1. Report description
- 1.2. Key market segments
- 1.3. Key benefits to the stakeholders
- 1.4. Research Methodology
- 1.4.1. Primary research
- 1.4.2. Secondary research
- 1.4.3. Analyst tools and models
CHAPTER 2: EXECUTIVE SUMMARY
- 2.1. CXO Perspective
CHAPTER 3: MARKET OVERVIEW
- 3.1. Market definition and scope
- 3.2. Key findings
- 3.2.1. Top impacting factors
- 3.2.2. Top investment pockets
- 3.3. Porter's five forces analysis
- 3.4. Market dynamics
- 3.4.1. Drivers
- 3.4.2. Restraints
- 3.4.3. Opportunities
- 3.5. COVID-19 Impact Analysis on the market
- 3.6. Brand Share Analysis
- 3.7. Key Regulation Analysis
- 3.8. Market Share Analysis
- 3.9. Patent Landscape
- 3.10. Regulatory Guidelines
- 3.11. Value Chain Analysis
CHAPTER 4: GASIFICATION MARKET, BY TYPE
- 4.1. Overview
- 4.1.1. Market size and forecast
- 4.2. Fixed Bed
- 4.2.1. Key market trends, growth factors and opportunities
- 4.2.2. Market size and forecast, by region
- 4.2.3. Market share analysis by country
- 4.3. Fluidized Bed
- 4.3.1. Key market trends, growth factors and opportunities
- 4.3.2. Market size and forecast, by region
- 4.3.3. Market share analysis by country
- 4.4. Entrained Flow
- 4.4.1. Key market trends, growth factors and opportunities
- 4.4.2. Market size and forecast, by region
- 4.4.3. Market share analysis by country
CHAPTER 5: GASIFICATION MARKET, BY FEEDSTOCK
- 5.1. Overview
- 5.1.1. Market size and forecast
- 5.2. Coal
- 5.2.1. Key market trends, growth factors and opportunities
- 5.2.2. Market size and forecast, by region
- 5.2.3. Market share analysis by country
- 5.3. Petroleum
- 5.3.1. Key market trends, growth factors and opportunities
- 5.3.2. Market size and forecast, by region
- 5.3.3. Market share analysis by country
- 5.4. Gas
- 5.4.1. Key market trends, growth factors and opportunities
- 5.4.2. Market size and forecast, by region
- 5.4.3. Market share analysis by country
- 5.5. Petcoke
- 5.5.1. Key market trends, growth factors and opportunities
- 5.5.2. Market size and forecast, by region
- 5.5.3. Market share analysis by country
- 5.6. Biomass
- 5.6.1. Key market trends, growth factors and opportunities
- 5.6.2. Market size and forecast, by region
- 5.6.3. Market share analysis by country
- 5.7. Waste
- 5.7.1. Key market trends, growth factors and opportunities
- 5.7.2. Market size and forecast, by region
- 5.7.3. Market share analysis by country
CHAPTER 6: GASIFICATION MARKET, BY FEED TYPE
- 6.1. Overview
- 6.1.1. Market size and forecast
- 6.2. Dry
- 6.2.1. Key market trends, growth factors and opportunities
- 6.2.2. Market size and forecast, by region
- 6.2.3. Market share analysis by country
- 6.3. Slurry
- 6.3.1. Key market trends, growth factors and opportunities
- 6.3.2. Market size and forecast, by region
- 6.3.3. Market share analysis by country
CHAPTER 7: GASIFICATION MARKET, BY GASIFIER MEDIUM
- 7.1. Overview
- 7.1.1. Market size and forecast
- 7.2. Air
- 7.2.1. Key market trends, growth factors and opportunities
- 7.2.2. Market size and forecast, by region
- 7.2.3. Market share analysis by country
- 7.3. Oxygen
- 7.3.1. Key market trends, growth factors and opportunities
- 7.3.2. Market size and forecast, by region
- 7.3.3. Market share analysis by country
- 7.4. Vapor
- 7.4.1. Key market trends, growth factors and opportunities
- 7.4.2. Market size and forecast, by region
- 7.4.3. Market share analysis by country
CHAPTER 8: GASIFICATION MARKET, BY APPLICATION
- 8.1. Overview
- 8.1.1. Market size and forecast
- 8.2. Electricity
- 8.2.1. Key market trends, growth factors and opportunities
- 8.2.2. Market size and forecast, by region
- 8.2.3. Market share analysis by country
- 8.3. Chemicals
- 8.3.1. Key market trends, growth factors and opportunities
- 8.3.2. Market size and forecast, by region
- 8.3.3. Market share analysis by country
- 8.4. Fertilizers
- 8.4.1. Key market trends, growth factors and opportunities
- 8.4.2. Market size and forecast, by region
- 8.4.3. Market share analysis by country
- 8.5. Liquid Fuels
- 8.5.1. Key market trends, growth factors and opportunities
- 8.5.2. Market size and forecast, by region
- 8.5.3. Market share analysis by country
- 8.6. Synthetic Natural Gas (SNG)
- 8.6.1. Key market trends, growth factors and opportunities
- 8.6.2. Market size and forecast, by region
- 8.6.3. Market share analysis by country
- 8.7. Hydrogen
- 8.7.1. Key market trends, growth factors and opportunities
- 8.7.2. Market size and forecast, by region
- 8.7.3. Market share analysis by country
CHAPTER 9: GASIFICATION MARKET, BY REGION
- 9.1. Overview
- 9.1.1. Market size and forecast By Region
- 9.2. North America
- 9.2.1. Key trends and opportunities
- 9.2.2. Market size and forecast, by Type
- 9.2.3. Market size and forecast, by Feedstock
- 9.2.4. Market size and forecast, by Feed Type
- 9.2.5. Market size and forecast, by Gasifier Medium
- 9.2.6. Market size and forecast, by Application
- 9.2.7. Market size and forecast, by country
- 9.2.7.1. U.S.
- 9.2.7.1.1. Key market trends, growth factors and opportunities
- 9.2.7.1.2. Market size and forecast, by Type
- 9.2.7.1.3. Market size and forecast, by Feedstock
- 9.2.7.1.4. Market size and forecast, by Feed Type
- 9.2.7.1.5. Market size and forecast, by Gasifier Medium
- 9.2.7.1.6. Market size and forecast, by Application
- 9.2.7.2. Canada
- 9.2.7.2.1. Key market trends, growth factors and opportunities
- 9.2.7.2.2. Market size and forecast, by Type
- 9.2.7.2.3. Market size and forecast, by Feedstock
- 9.2.7.2.4. Market size and forecast, by Feed Type
- 9.2.7.2.5. Market size and forecast, by Gasifier Medium
- 9.2.7.2.6. Market size and forecast, by Application
- 9.2.7.3. Mexico
- 9.2.7.3.1. Key market trends, growth factors and opportunities
- 9.2.7.3.2. Market size and forecast, by Type
- 9.2.7.3.3. Market size and forecast, by Feedstock
- 9.2.7.3.4. Market size and forecast, by Feed Type
- 9.2.7.3.5. Market size and forecast, by Gasifier Medium
- 9.2.7.3.6. Market size and forecast, by Application
- 9.3. Europe
- 9.3.1. Key trends and opportunities
- 9.3.2. Market size and forecast, by Type
- 9.3.3. Market size and forecast, by Feedstock
- 9.3.4. Market size and forecast, by Feed Type
- 9.3.5. Market size and forecast, by Gasifier Medium
- 9.3.6. Market size and forecast, by Application
- 9.3.7. Market size and forecast, by country
- 9.3.7.1. Germany
- 9.3.7.1.1. Key market trends, growth factors and opportunities
- 9.3.7.1.2. Market size and forecast, by Type
- 9.3.7.1.3. Market size and forecast, by Feedstock
- 9.3.7.1.4. Market size and forecast, by Feed Type
- 9.3.7.1.5. Market size and forecast, by Gasifier Medium
- 9.3.7.1.6. Market size and forecast, by Application
- 9.3.7.2. UK
- 9.3.7.2.1. Key market trends, growth factors and opportunities
- 9.3.7.2.2. Market size and forecast, by Type
- 9.3.7.2.3. Market size and forecast, by Feedstock
- 9.3.7.2.4. Market size and forecast, by Feed Type
- 9.3.7.2.5. Market size and forecast, by Gasifier Medium
- 9.3.7.2.6. Market size and forecast, by Application
- 9.3.7.3. France
- 9.3.7.3.1. Key market trends, growth factors and opportunities
- 9.3.7.3.2. Market size and forecast, by Type
- 9.3.7.3.3. Market size and forecast, by Feedstock
- 9.3.7.3.4. Market size and forecast, by Feed Type
- 9.3.7.3.5. Market size and forecast, by Gasifier Medium
- 9.3.7.3.6. Market size and forecast, by Application
- 9.3.7.4. Netherlands
- 9.3.7.4.1. Key market trends, growth factors and opportunities
- 9.3.7.4.2. Market size and forecast, by Type
- 9.3.7.4.3. Market size and forecast, by Feedstock
- 9.3.7.4.4. Market size and forecast, by Feed Type
- 9.3.7.4.5. Market size and forecast, by Gasifier Medium
- 9.3.7.4.6. Market size and forecast, by Application
- 9.3.7.5. Austria
- 9.3.7.5.1. Key market trends, growth factors and opportunities
- 9.3.7.5.2. Market size and forecast, by Type
- 9.3.7.5.3. Market size and forecast, by Feedstock
- 9.3.7.5.4. Market size and forecast, by Feed Type
- 9.3.7.5.5. Market size and forecast, by Gasifier Medium
- 9.3.7.5.6. Market size and forecast, by Application
- 9.3.7.6. Rest of Europe
- 9.3.7.6.1. Key market trends, growth factors and opportunities
- 9.3.7.6.2. Market size and forecast, by Type
- 9.3.7.6.3. Market size and forecast, by Feedstock
- 9.3.7.6.4. Market size and forecast, by Feed Type
- 9.3.7.6.5. Market size and forecast, by Gasifier Medium
- 9.3.7.6.6. Market size and forecast, by Application
- 9.4. Asia-Pacific
- 9.4.1. Key trends and opportunities
- 9.4.2. Market size and forecast, by Type
- 9.4.3. Market size and forecast, by Feedstock
- 9.4.4. Market size and forecast, by Feed Type
- 9.4.5. Market size and forecast, by Gasifier Medium
- 9.4.6. Market size and forecast, by Application
- 9.4.7. Market size and forecast, by country
- 9.4.7.1. China
- 9.4.7.1.1. Key market trends, growth factors and opportunities
- 9.4.7.1.2. Market size and forecast, by Type
- 9.4.7.1.3. Market size and forecast, by Feedstock
- 9.4.7.1.4. Market size and forecast, by Feed Type
- 9.4.7.1.5. Market size and forecast, by Gasifier Medium
- 9.4.7.1.6. Market size and forecast, by Application
- 9.4.7.2. Japan
- 9.4.7.2.1. Key market trends, growth factors and opportunities
- 9.4.7.2.2. Market size and forecast, by Type
- 9.4.7.2.3. Market size and forecast, by Feedstock
- 9.4.7.2.4. Market size and forecast, by Feed Type
- 9.4.7.2.5. Market size and forecast, by Gasifier Medium
- 9.4.7.2.6. Market size and forecast, by Application
- 9.4.7.3. India
- 9.4.7.3.1. Key market trends, growth factors and opportunities
- 9.4.7.3.2. Market size and forecast, by Type
- 9.4.7.3.3. Market size and forecast, by Feedstock
- 9.4.7.3.4. Market size and forecast, by Feed Type
- 9.4.7.3.5. Market size and forecast, by Gasifier Medium
- 9.4.7.3.6. Market size and forecast, by Application
- 9.4.7.4. South Korea
- 9.4.7.4.1. Key market trends, growth factors and opportunities
- 9.4.7.4.2. Market size and forecast, by Type
- 9.4.7.4.3. Market size and forecast, by Feedstock
- 9.4.7.4.4. Market size and forecast, by Feed Type
- 9.4.7.4.5. Market size and forecast, by Gasifier Medium
- 9.4.7.4.6. Market size and forecast, by Application
- 9.4.7.5. Australia
- 9.4.7.5.1. Key market trends, growth factors and opportunities
- 9.4.7.5.2. Market size and forecast, by Type
- 9.4.7.5.3. Market size and forecast, by Feedstock
- 9.4.7.5.4. Market size and forecast, by Feed Type
- 9.4.7.5.5. Market size and forecast, by Gasifier Medium
- 9.4.7.5.6. Market size and forecast, by Application
- 9.4.7.6. Rest of Asia-Pacific
- 9.4.7.6.1. Key market trends, growth factors and opportunities
- 9.4.7.6.2. Market size and forecast, by Type
- 9.4.7.6.3. Market size and forecast, by Feedstock
- 9.4.7.6.4. Market size and forecast, by Feed Type
- 9.4.7.6.5. Market size and forecast, by Gasifier Medium
- 9.4.7.6.6. Market size and forecast, by Application
- 9.5. LAMEA
- 9.5.1. Key trends and opportunities
- 9.5.2. Market size and forecast, by Type
- 9.5.3. Market size and forecast, by Feedstock
- 9.5.4. Market size and forecast, by Feed Type
- 9.5.5. Market size and forecast, by Gasifier Medium
- 9.5.6. Market size and forecast, by Application
- 9.5.7. Market size and forecast, by country
- 9.5.7.1. Brazil
- 9.5.7.1.1. Key market trends, growth factors and opportunities
- 9.5.7.1.2. Market size and forecast, by Type
- 9.5.7.1.3. Market size and forecast, by Feedstock
- 9.5.7.1.4. Market size and forecast, by Feed Type
- 9.5.7.1.5. Market size and forecast, by Gasifier Medium
- 9.5.7.1.6. Market size and forecast, by Application
- 9.5.7.2. UAE
- 9.5.7.2.1. Key market trends, growth factors and opportunities
- 9.5.7.2.2. Market size and forecast, by Type
- 9.5.7.2.3. Market size and forecast, by Feedstock
- 9.5.7.2.4. Market size and forecast, by Feed Type
- 9.5.7.2.5. Market size and forecast, by Gasifier Medium
- 9.5.7.2.6. Market size and forecast, by Application
- 9.5.7.3. Saudi Arabia
- 9.5.7.3.1. Key market trends, growth factors and opportunities
- 9.5.7.3.2. Market size and forecast, by Type
- 9.5.7.3.3. Market size and forecast, by Feedstock
- 9.5.7.3.4. Market size and forecast, by Feed Type
- 9.5.7.3.5. Market size and forecast, by Gasifier Medium
- 9.5.7.3.6. Market size and forecast, by Application
- 9.5.7.4. South Africa
- 9.5.7.4.1. Key market trends, growth factors and opportunities
- 9.5.7.4.2. Market size and forecast, by Type
- 9.5.7.4.3. Market size and forecast, by Feedstock
- 9.5.7.4.4. Market size and forecast, by Feed Type
- 9.5.7.4.5. Market size and forecast, by Gasifier Medium
- 9.5.7.4.6. Market size and forecast, by Application
- 9.5.7.5. Rest of LAMEA
- 9.5.7.5.1. Key market trends, growth factors and opportunities
- 9.5.7.5.2. Market size and forecast, by Type
- 9.5.7.5.3. Market size and forecast, by Feedstock
- 9.5.7.5.4. Market size and forecast, by Feed Type
- 9.5.7.5.5. Market size and forecast, by Gasifier Medium
- 9.5.7.5.6. Market size and forecast, by Application
CHAPTER 10: COMPETITIVE LANDSCAPE
- 10.1. Introduction
- 10.2. Top winning strategies
- 10.3. Product Mapping of Top 10 Player
- 10.4. Competitive Dashboard
- 10.5. Competitive Heatmap
- 10.6. Top player positioning, 2022
CHAPTER 11: COMPANY PROFILES
- 11.1. Shell Plc.
- 11.1.1. Company overview
- 11.1.2. Key Executives
- 11.1.3. Company snapshot
- 11.2. Air Liquide
- 11.2.1. Company overview
- 11.2.2. Key Executives
- 11.2.3. Company snapshot
- 11.3. General Electric
- 11.3.1. Company overview
- 11.3.2. Key Executives
- 11.3.3. Company snapshot
- 11.4. Mitsubishi Heavy Industries
- 11.4.1. Company overview
- 11.4.2. Key Executives
- 11.4.3. Company snapshot
- 11.5. SEDIN Engineering Company Limited
- 11.5.1. Company overview
- 11.5.2. Key Executives
- 11.5.3. Company snapshot
- 11.6. ThyssenKrupp AG.
- 11.6.1. Company overview
- 11.6.2. Key Executives
- 11.6.3. Company snapshot
- 11.7. Siemens
- 11.7.1. Company overview
- 11.7.2. Key Executives
- 11.7.3. Company snapshot
- 11.8. CB&I
- 11.8.1. Company overview
- 11.8.2. Key Executives
- 11.8.3. Company snapshot
- 11.9. KBR Inc.
- 11.9.1. Company overview
- 11.9.2. Key Executives
- 11.9.3. Company snapshot
- 11.10. Synthesis Energy Systems Inc.
- 11.10.1. Company overview
- 11.10.2. Key Executives
- 11.10.3. Company snapshot
LIST OF TABLES
- TABLE 01. GLOBAL GASIFICATION MARKET, BY TYPE, 2022-2032 ($BILLION)
- TABLE 02. GASIFICATION MARKET FOR FIXED BED , BY REGION, 2022-2032 ($BILLION)
- TABLE 03. GASIFICATION MARKET FOR FLUIDIZED BED, BY REGION, 2022-2032 ($BILLION)
- TABLE 04. GASIFICATION MARKET FOR ENTRAINED FLOW, BY REGION, 2022-2032 ($BILLION)
- TABLE 05. GLOBAL GASIFICATION MARKET, BY FEEDSTOCK, 2022-2032 ($BILLION)
- TABLE 06. GASIFICATION MARKET FOR COAL , BY REGION, 2022-2032 ($BILLION)
- TABLE 07. GASIFICATION MARKET FOR PETROLEUM, BY REGION, 2022-2032 ($BILLION)
- TABLE 08. GASIFICATION MARKET FOR GAS, BY REGION, 2022-2032 ($BILLION)
- TABLE 09. GASIFICATION MARKET FOR PETCOKE, BY REGION, 2022-2032 ($BILLION)
- TABLE 10. GASIFICATION MARKET FOR BIOMASS , BY REGION, 2022-2032 ($BILLION)
- TABLE 11. GASIFICATION MARKET FOR WASTE, BY REGION, 2022-2032 ($BILLION)
- TABLE 12. GLOBAL GASIFICATION MARKET, BY FEED TYPE, 2022-2032 ($BILLION)
- TABLE 13. GASIFICATION MARKET FOR DRY, BY REGION, 2022-2032 ($BILLION)
- TABLE 14. GASIFICATION MARKET FOR SLURRY, BY REGION, 2022-2032 ($BILLION)
- TABLE 15. GLOBAL GASIFICATION MARKET, BY GASIFIER MEDIUM, 2022-2032 ($BILLION)
- TABLE 16. GASIFICATION MARKET FOR AIR, BY REGION, 2022-2032 ($BILLION)
- TABLE 17. GASIFICATION MARKET FOR OXYGEN, BY REGION, 2022-2032 ($BILLION)
- TABLE 18. GASIFICATION MARKET FOR VAPOR, BY REGION, 2022-2032 ($BILLION)
- TABLE 19. GLOBAL GASIFICATION MARKET, BY APPLICATION, 2022-2032 ($BILLION)
- TABLE 20. GASIFICATION MARKET FOR ELECTRICITY, BY REGION, 2022-2032 ($BILLION)
- TABLE 21. GASIFICATION MARKET FOR CHEMICALS, BY REGION, 2022-2032 ($BILLION)
- TABLE 22. GASIFICATION MARKET FOR FERTILIZERS, BY REGION, 2022-2032 ($BILLION)
- TABLE 23. GASIFICATION MARKET FOR LIQUID FUELS, BY REGION, 2022-2032 ($BILLION)
- TABLE 24. GASIFICATION MARKET FOR SYNTHETIC NATURAL GAS (SNG), BY REGION, 2022-2032 ($BILLION)
- TABLE 25. GASIFICATION MARKET FOR HYDROGEN, BY REGION, 2022-2032 ($BILLION)
- TABLE 26. GASIFICATION MARKET, BY REGION, 2022-2032 ($BILLION)
- TABLE 27. NORTH AMERICA GASIFICATION MARKET, BY TYPE, 2022-2032 ($BILLION)
- TABLE 28. NORTH AMERICA GASIFICATION MARKET, BY FEEDSTOCK, 2022-2032 ($BILLION)
- TABLE 29. NORTH AMERICA GASIFICATION MARKET, BY FEED TYPE, 2022-2032 ($BILLION)
- TABLE 30. NORTH AMERICA GASIFICATION MARKET, BY GASIFIER MEDIUM, 2022-2032 ($BILLION)
- TABLE 31. NORTH AMERICA GASIFICATION MARKET, BY APPLICATION, 2022-2032 ($BILLION)
- TABLE 32. NORTH AMERICA GASIFICATION MARKET, BY COUNTRY, 2022-2032 ($BILLION)
- TABLE 33. U.S. GASIFICATION MARKET, BY TYPE, 2022-2032 ($BILLION)
- TABLE 34. U.S. GASIFICATION MARKET, BY FEEDSTOCK, 2022-2032 ($BILLION)
- TABLE 35. U.S. GASIFICATION MARKET, BY FEED TYPE, 2022-2032 ($BILLION)
- TABLE 36. U.S. GASIFICATION MARKET, BY GASIFIER MEDIUM, 2022-2032 ($BILLION)
- TABLE 37. U.S. GASIFICATION MARKET, BY APPLICATION, 2022-2032 ($BILLION)
- TABLE 38. CANADA GASIFICATION MARKET, BY TYPE, 2022-2032 ($BILLION)
- TABLE 39. CANADA GASIFICATION MARKET, BY FEEDSTOCK, 2022-2032 ($BILLION)
- TABLE 40. CANADA GASIFICATION MARKET, BY FEED TYPE, 2022-2032 ($BILLION)
- TABLE 41. CANADA GASIFICATION MARKET, BY GASIFIER MEDIUM, 2022-2032 ($BILLION)
- TABLE 42. CANADA GASIFICATION MARKET, BY APPLICATION, 2022-2032 ($BILLION)
- TABLE 43. MEXICO GASIFICATION MARKET, BY TYPE, 2022-2032 ($BILLION)
- TABLE 44. MEXICO GASIFICATION MARKET, BY FEEDSTOCK, 2022-2032 ($BILLION)
- TABLE 45. MEXICO GASIFICATION MARKET, BY FEED TYPE, 2022-2032 ($BILLION)
- TABLE 46. MEXICO GASIFICATION MARKET, BY GASIFIER MEDIUM, 2022-2032 ($BILLION)
- TABLE 47. MEXICO GASIFICATION MARKET, BY APPLICATION, 2022-2032 ($BILLION)
- TABLE 48. EUROPE GASIFICATION MARKET, BY TYPE, 2022-2032 ($BILLION)
- TABLE 49. EUROPE GASIFICATION MARKET, BY FEEDSTOCK, 2022-2032 ($BILLION)
- TABLE 50. EUROPE GASIFICATION MARKET, BY FEED TYPE, 2022-2032 ($BILLION)
- TABLE 51. EUROPE GASIFICATION MARKET, BY GASIFIER MEDIUM, 2022-2032 ($BILLION)
- TABLE 52. EUROPE GASIFICATION MARKET, BY APPLICATION, 2022-2032 ($BILLION)
- TABLE 53. EUROPE GASIFICATION MARKET, BY COUNTRY, 2022-2032 ($BILLION)
- TABLE 54. GERMANY GASIFICATION MARKET, BY TYPE, 2022-2032 ($BILLION)
- TABLE 55. GERMANY GASIFICATION MARKET, BY FEEDSTOCK, 2022-2032 ($BILLION)
- TABLE 56. GERMANY GASIFICATION MARKET, BY FEED TYPE, 2022-2032 ($BILLION)
- TABLE 57. GERMANY GASIFICATION MARKET, BY GASIFIER MEDIUM, 2022-2032 ($BILLION)
- TABLE 58. GERMANY GASIFICATION MARKET, BY APPLICATION, 2022-2032 ($BILLION)
- TABLE 59. UK GASIFICATION MARKET, BY TYPE, 2022-2032 ($BILLION)
- TABLE 60. UK GASIFICATION MARKET, BY FEEDSTOCK, 2022-2032 ($BILLION)
- TABLE 61. UK GASIFICATION MARKET, BY FEED TYPE, 2022-2032 ($BILLION)
- TABLE 62. UK GASIFICATION MARKET, BY GASIFIER MEDIUM, 2022-2032 ($BILLION)
- TABLE 63. UK GASIFICATION MARKET, BY APPLICATION, 2022-2032 ($BILLION)
- TABLE 64. FRANCE GASIFICATION MARKET, BY TYPE, 2022-2032 ($BILLION)
- TABLE 65. FRANCE GASIFICATION MARKET, BY FEEDSTOCK, 2022-2032 ($BILLION)
- TABLE 66. FRANCE GASIFICATION MARKET, BY FEED TYPE, 2022-2032 ($BILLION)
- TABLE 67. FRANCE GASIFICATION MARKET, BY GASIFIER MEDIUM, 2022-2032 ($BILLION)
- TABLE 68. FRANCE GASIFICATION MARKET, BY APPLICATION, 2022-2032 ($BILLION)
- TABLE 69. NETHERLANDS GASIFICATION MARKET, BY TYPE, 2022-2032 ($BILLION)
- TABLE 70. NETHERLANDS GASIFICATION MARKET, BY FEEDSTOCK, 2022-2032 ($BILLION)
- TABLE 71. NETHERLANDS GASIFICATION MARKET, BY FEED TYPE, 2022-2032 ($BILLION)
- TABLE 72. NETHERLANDS GASIFICATION MARKET, BY GASIFIER MEDIUM, 2022-2032 ($BILLION)
- TABLE 73. NETHERLANDS GASIFICATION MARKET, BY APPLICATION, 2022-2032 ($BILLION)
- TABLE 74. AUSTRIA GASIFICATION MARKET, BY TYPE, 2022-2032 ($BILLION)
- TABLE 75. AUSTRIA GASIFICATION MARKET, BY FEEDSTOCK, 2022-2032 ($BILLION)
- TABLE 76. AUSTRIA GASIFICATION MARKET, BY FEED TYPE, 2022-2032 ($BILLION)
- TABLE 77. AUSTRIA GASIFICATION MARKET, BY GASIFIER MEDIUM, 2022-2032 ($BILLION)
- TABLE 78. AUSTRIA GASIFICATION MARKET, BY APPLICATION, 2022-2032 ($BILLION)
- TABLE 79. REST OF EUROPE GASIFICATION MARKET, BY TYPE, 2022-2032 ($BILLION)
- TABLE 80. REST OF EUROPE GASIFICATION MARKET, BY FEEDSTOCK, 2022-2032 ($BILLION)
- TABLE 81. REST OF EUROPE GASIFICATION MARKET, BY FEED TYPE, 2022-2032 ($BILLION)
- TABLE 82. REST OF EUROPE GASIFICATION MARKET, BY GASIFIER MEDIUM, 2022-2032 ($BILLION)
- TABLE 83. REST OF EUROPE GASIFICATION MARKET, BY APPLICATION, 2022-2032 ($BILLION)
- TABLE 84. ASIA-PACIFIC GASIFICATION MARKET, BY TYPE, 2022-2032 ($BILLION)
- TABLE 85. ASIA-PACIFIC GASIFICATION MARKET, BY FEEDSTOCK, 2022-2032 ($BILLION)
- TABLE 86. ASIA-PACIFIC GASIFICATION MARKET, BY FEED TYPE, 2022-2032 ($BILLION)
- TABLE 87. ASIA-PACIFIC GASIFICATION MARKET, BY GASIFIER MEDIUM, 2022-2032 ($BILLION)
- TABLE 88. ASIA-PACIFIC GASIFICATION MARKET, BY APPLICATION, 2022-2032 ($BILLION)
- TABLE 89. ASIA-PACIFIC GASIFICATION MARKET, BY COUNTRY, 2022-2032 ($BILLION)
- TABLE 90. CHINA GASIFICATION MARKET, BY TYPE, 2022-2032 ($BILLION)
- TABLE 91. CHINA GASIFICATION MARKET, BY FEEDSTOCK, 2022-2032 ($BILLION)
- TABLE 92. CHINA GASIFICATION MARKET, BY FEED TYPE, 2022-2032 ($BILLION)
- TABLE 93. CHINA GASIFICATION MARKET, BY GASIFIER MEDIUM, 2022-2032 ($BILLION)
- TABLE 94. CHINA GASIFICATION MARKET, BY APPLICATION, 2022-2032 ($BILLION)
- TABLE 95. JAPAN GASIFICATION MARKET, BY TYPE, 2022-2032 ($BILLION)
- TABLE 96. JAPAN GASIFICATION MARKET, BY FEEDSTOCK, 2022-2032 ($BILLION)
- TABLE 97. JAPAN GASIFICATION MARKET, BY FEED TYPE, 2022-2032 ($BILLION)
- TABLE 98. JAPAN GASIFICATION MARKET, BY GASIFIER MEDIUM, 2022-2032 ($BILLION)
- TABLE 99. JAPAN GASIFICATION MARKET, BY APPLICATION, 2022-2032 ($BILLION)
- TABLE 100. INDIA GASIFICATION MARKET, BY TYPE, 2022-2032 ($BILLION)
- TABLE 101. INDIA GASIFICATION MARKET, BY FEEDSTOCK, 2022-2032 ($BILLION)
- TABLE 102. INDIA GASIFICATION MARKET, BY FEED TYPE, 2022-2032 ($BILLION)
- TABLE 103. INDIA GASIFICATION MARKET, BY GASIFIER MEDIUM, 2022-2032 ($BILLION)
- TABLE 104. INDIA GASIFICATION MARKET, BY APPLICATION, 2022-2032 ($BILLION)
- TABLE 105. SOUTH KOREA GASIFICATION MARKET, BY TYPE, 2022-2032 ($BILLION)
- TABLE 106. SOUTH KOREA GASIFICATION MARKET, BY FEEDSTOCK, 2022-2032 ($BILLION)
- TABLE 107. SOUTH KOREA GASIFICATION MARKET, BY FEED TYPE, 2022-2032 ($BILLION)
- TABLE 108. SOUTH KOREA GASIFICATION MARKET, BY GASIFIER MEDIUM, 2022-2032 ($BILLION)
- TABLE 109. SOUTH KOREA GASIFICATION MARKET, BY APPLICATION, 2022-2032 ($BILLION)
- TABLE 110. AUSTRALIA GASIFICATION MARKET, BY TYPE, 2022-2032 ($BILLION)
- TABLE 111. AUSTRALIA GASIFICATION MARKET, BY FEEDSTOCK, 2022-2032 ($BILLION)
- TABLE 112. AUSTRALIA GASIFICATION MARKET, BY FEED TYPE, 2022-2032 ($BILLION)
- TABLE 113. AUSTRALIA GASIFICATION MARKET, BY GASIFIER MEDIUM, 2022-2032 ($BILLION)
- TABLE 114. AUSTRALIA GASIFICATION MARKET, BY APPLICATION, 2022-2032 ($BILLION)
- TABLE 115. REST OF ASIA-PACIFIC GASIFICATION MARKET, BY TYPE, 2022-2032 ($BILLION)
- TABLE 116. REST OF ASIA-PACIFIC GASIFICATION MARKET, BY FEEDSTOCK, 2022-2032 ($BILLION)
- TABLE 117. REST OF ASIA-PACIFIC GASIFICATION MARKET, BY FEED TYPE, 2022-2032 ($BILLION)
- TABLE 118. REST OF ASIA-PACIFIC GASIFICATION MARKET, BY GASIFIER MEDIUM, 2022-2032 ($BILLION)
- TABLE 119. REST OF ASIA-PACIFIC GASIFICATION MARKET, BY APPLICATION, 2022-2032 ($BILLION)
- TABLE 120. LAMEA GASIFICATION MARKET, BY TYPE, 2022-2032 ($BILLION)
- TABLE 121. LAMEA GASIFICATION MARKET, BY FEEDSTOCK, 2022-2032 ($BILLION)
- TABLE 122. LAMEA GASIFICATION MARKET, BY FEED TYPE, 2022-2032 ($BILLION)
- TABLE 123. LAMEA GASIFICATION MARKET, BY GASIFIER MEDIUM, 2022-2032 ($BILLION)
- TABLE 124. LAMEA GASIFICATION MARKET, BY APPLICATION, 2022-2032 ($BILLION)
- TABLE 125. LAMEA GASIFICATION MARKET, BY COUNTRY, 2022-2032 ($BILLION)
- TABLE 126. BRAZIL GASIFICATION MARKET, BY TYPE, 2022-2032 ($BILLION)
- TABLE 127. BRAZIL GASIFICATION MARKET, BY FEEDSTOCK, 2022-2032 ($BILLION)
- TABLE 128. BRAZIL GASIFICATION MARKET, BY FEED TYPE, 2022-2032 ($BILLION)
- TABLE 129. BRAZIL GASIFICATION MARKET, BY GASIFIER MEDIUM, 2022-2032 ($BILLION)
- TABLE 130. BRAZIL GASIFICATION MARKET, BY APPLICATION, 2022-2032 ($BILLION)
- TABLE 131. UAE GASIFICATION MARKET, BY TYPE, 2022-2032 ($BILLION)
- TABLE 132. UAE GASIFICATION MARKET, BY FEEDSTOCK, 2022-2032 ($BILLION)
- TABLE 133. UAE GASIFICATION MARKET, BY FEED TYPE, 2022-2032 ($BILLION)
- TABLE 134. UAE GASIFICATION MARKET, BY GASIFIER MEDIUM, 2022-2032 ($BILLION)
- TABLE 135. UAE GASIFICATION MARKET, BY APPLICATION, 2022-2032 ($BILLION)
- TABLE 136. SAUDI ARABIA GASIFICATION MARKET, BY TYPE, 2022-2032 ($BILLION)
- TABLE 137. SAUDI ARABIA GASIFICATION MARKET, BY FEEDSTOCK, 2022-2032 ($BILLION)
- TABLE 138. SAUDI ARABIA GASIFICATION MARKET, BY FEED TYPE, 2022-2032 ($BILLION)
- TABLE 139. SAUDI ARABIA GASIFICATION MARKET, BY GASIFIER MEDIUM, 2022-2032 ($BILLION)
- TABLE 140. SAUDI ARABIA GASIFICATION MARKET, BY APPLICATION, 2022-2032 ($BILLION)
- TABLE 141. SOUTH AFRICA GASIFICATION MARKET, BY TYPE, 2022-2032 ($BILLION)
- TABLE 142. SOUTH AFRICA GASIFICATION MARKET, BY FEEDSTOCK, 2022-2032 ($BILLION)
- TABLE 143. SOUTH AFRICA GASIFICATION MARKET, BY FEED TYPE, 2022-2032 ($BILLION)
- TABLE 144. SOUTH AFRICA GASIFICATION MARKET, BY GASIFIER MEDIUM, 2022-2032 ($BILLION)
- TABLE 145. SOUTH AFRICA GASIFICATION MARKET, BY APPLICATION, 2022-2032 ($BILLION)
- TABLE 146. REST OF LAMEA GASIFICATION MARKET, BY TYPE, 2022-2032 ($BILLION)
- TABLE 147. REST OF LAMEA GASIFICATION MARKET, BY FEEDSTOCK, 2022-2032 ($BILLION)
- TABLE 148. REST OF LAMEA GASIFICATION MARKET, BY FEED TYPE, 2022-2032 ($BILLION)
- TABLE 149. REST OF LAMEA GASIFICATION MARKET, BY GASIFIER MEDIUM, 2022-2032 ($BILLION)
- TABLE 150. REST OF LAMEA GASIFICATION MARKET, BY APPLICATION, 2022-2032 ($BILLION)
- TABLE 151. SHELL PLC.: KEY EXECUTIVES
- TABLE 152. SHELL PLC.: COMPANY SNAPSHOT
- TABLE 153. AIR LIQUIDE: KEY EXECUTIVES
- TABLE 154. AIR LIQUIDE: COMPANY SNAPSHOT
- TABLE 155. GENERAL ELECTRIC: KEY EXECUTIVES
- TABLE 156. GENERAL ELECTRIC: COMPANY SNAPSHOT
- TABLE 157. MITSUBISHI HEAVY INDUSTRIES: KEY EXECUTIVES
- TABLE 158. MITSUBISHI HEAVY INDUSTRIES: COMPANY SNAPSHOT
- TABLE 159. SEDIN ENGINEERING COMPANY LIMITED: KEY EXECUTIVES
- TABLE 160. SEDIN ENGINEERING COMPANY LIMITED: COMPANY SNAPSHOT
- TABLE 161. THYSSENKRUPP AG.: KEY EXECUTIVES
- TABLE 162. THYSSENKRUPP AG.: COMPANY SNAPSHOT
- TABLE 163. SIEMENS: KEY EXECUTIVES
- TABLE 164. SIEMENS: COMPANY SNAPSHOT
- TABLE 165. CB&I: KEY EXECUTIVES
- TABLE 166. CB&I: COMPANY SNAPSHOT
- TABLE 167. KBR INC.: KEY EXECUTIVES
- TABLE 168. KBR INC.: COMPANY SNAPSHOT
- TABLE 169. SYNTHESIS ENERGY SYSTEMS INC.: KEY EXECUTIVES
- TABLE 170. SYNTHESIS ENERGY SYSTEMS INC.: COMPANY SNAPSHOT
LIST OF FIGURES
- FIGURE 01. GASIFICATION MARKET, 2022-2032
- FIGURE 02. SEGMENTATION OF GASIFICATION MARKET, 2022-2032
- FIGURE 03. TOP INVESTMENT POCKETS IN GASIFICATION MARKET (2023-2032)
- FIGURE 04. PORTER FIVE-1
- FIGURE 05. PORTER FIVE-2
- FIGURE 06. PORTER FIVE-3
- FIGURE 07. PORTER FIVE-4
- FIGURE 08. PORTER FIVE-5
- FIGURE 09. DRIVERS, RESTRAINTS AND OPPORTUNITIES: GLOBALGASIFICATION MARKET
- FIGURE 10. IMPACT OF KEY REGULATION: GASIFICATION MARKET
- FIGURE 11. MARKET SHARE ANALYSIS: GASIFICATION MARKET
- FIGURE 12. PATENT ANALYSIS BY COMPANY
- FIGURE 13. PATENT ANALYSIS BY COUNTRY
- FIGURE 14. REGULATORY GUIDELINES: GASIFICATION MARKET
- FIGURE 15. VALUE CHAIN ANALYSIS: GASIFICATION MARKET
- FIGURE 16. GASIFICATION MARKET, BY TYPE, 2022(%)
- FIGURE 17. COMPARATIVE SHARE ANALYSIS OF GASIFICATION MARKET FOR FIXED BED , BY COUNTRY 2022 AND 2032(%)
- FIGURE 18. COMPARATIVE SHARE ANALYSIS OF GASIFICATION MARKET FOR FLUIDIZED BED, BY COUNTRY 2022 AND 2032(%)
- FIGURE 19. COMPARATIVE SHARE ANALYSIS OF GASIFICATION MARKET FOR ENTRAINED FLOW, BY COUNTRY 2022 AND 2032(%)
- FIGURE 20. GASIFICATION MARKET, BY FEEDSTOCK, 2022(%)
- FIGURE 21. COMPARATIVE SHARE ANALYSIS OF GASIFICATION MARKET FOR COAL , BY COUNTRY 2022 AND 2032(%)
- FIGURE 22. COMPARATIVE SHARE ANALYSIS OF GASIFICATION MARKET FOR PETROLEUM, BY COUNTRY 2022 AND 2032(%)
- FIGURE 23. COMPARATIVE SHARE ANALYSIS OF GASIFICATION MARKET FOR GAS, BY COUNTRY 2022 AND 2032(%)
- FIGURE 24. COMPARATIVE SHARE ANALYSIS OF GASIFICATION MARKET FOR PETCOKE, BY COUNTRY 2022 AND 2032(%)
- FIGURE 25. COMPARATIVE SHARE ANALYSIS OF GASIFICATION MARKET FOR BIOMASS , BY COUNTRY 2022 AND 2032(%)
- FIGURE 26. COMPARATIVE SHARE ANALYSIS OF GASIFICATION MARKET FOR WASTE, BY COUNTRY 2022 AND 2032(%)
- FIGURE 27. GASIFICATION MARKET, BY FEED TYPE, 2022(%)
- FIGURE 28. COMPARATIVE SHARE ANALYSIS OF GASIFICATION MARKET FOR DRY, BY COUNTRY 2022 AND 2032(%)
- FIGURE 29. COMPARATIVE SHARE ANALYSIS OF GASIFICATION MARKET FOR SLURRY, BY COUNTRY 2022 AND 2032(%)
- FIGURE 30. GASIFICATION MARKET, BY GASIFIER MEDIUM, 2022(%)
- FIGURE 31. COMPARATIVE SHARE ANALYSIS OF GASIFICATION MARKET FOR AIR, BY COUNTRY 2022 AND 2032(%)
- FIGURE 32. COMPARATIVE SHARE ANALYSIS OF GASIFICATION MARKET FOR OXYGEN, BY COUNTRY 2022 AND 2032(%)
- FIGURE 33. COMPARATIVE SHARE ANALYSIS OF GASIFICATION MARKET FOR VAPOR, BY COUNTRY 2022 AND 2032(%)
- FIGURE 34. GASIFICATION MARKET, BY APPLICATION, 2022(%)
- FIGURE 35. COMPARATIVE SHARE ANALYSIS OF GASIFICATION MARKET FOR ELECTRICITY, BY COUNTRY 2022 AND 2032(%)
- FIGURE 36. COMPARATIVE SHARE ANALYSIS OF GASIFICATION MARKET FOR CHEMICALS, BY COUNTRY 2022 AND 2032(%)
- FIGURE 37. COMPARATIVE SHARE ANALYSIS OF GASIFICATION MARKET FOR FERTILIZERS, BY COUNTRY 2022 AND 2032(%)
- FIGURE 38. COMPARATIVE SHARE ANALYSIS OF GASIFICATION MARKET FOR LIQUID FUELS, BY COUNTRY 2022 AND 2032(%)
- FIGURE 39. COMPARATIVE SHARE ANALYSIS OF GASIFICATION MARKET FOR SYNTHETIC NATURAL GAS (SNG), BY COUNTRY 2022 AND 2032(%)
- FIGURE 40. COMPARATIVE SHARE ANALYSIS OF GASIFICATION MARKET FOR HYDROGEN, BY COUNTRY 2022 AND 2032(%)
- FIGURE 41. GASIFICATION MARKET BY REGION, 2022
- FIGURE 42. U.S. GASIFICATION MARKET, 2022-2032 ($BILLION)
- FIGURE 43. CANADA GASIFICATION MARKET, 2022-2032 ($BILLION)
- FIGURE 44. MEXICO GASIFICATION MARKET, 2022-2032 ($BILLION)
- FIGURE 45. GERMANY GASIFICATION MARKET, 2022-2032 ($BILLION)
- FIGURE 46. UK GASIFICATION MARKET, 2022-2032 ($BILLION)
- FIGURE 47. FRANCE GASIFICATION MARKET, 2022-2032 ($BILLION)
- FIGURE 48. NETHERLANDS GASIFICATION MARKET, 2022-2032 ($BILLION)
- FIGURE 49. AUSTRIA GASIFICATION MARKET, 2022-2032 ($BILLION)
- FIGURE 50. REST OF EUROPE GASIFICATION MARKET, 2022-2032 ($BILLION)
- FIGURE 51. CHINA GASIFICATION MARKET, 2022-2032 ($BILLION)
- FIGURE 52. JAPAN GASIFICATION MARKET, 2022-2032 ($BILLION)
- FIGURE 53. INDIA GASIFICATION MARKET, 2022-2032 ($BILLION)
- FIGURE 54. SOUTH KOREA GASIFICATION MARKET, 2022-2032 ($BILLION)
- FIGURE 55. AUSTRALIA GASIFICATION MARKET, 2022-2032 ($BILLION)
- FIGURE 56. REST OF ASIA-PACIFIC GASIFICATION MARKET, 2022-2032 ($BILLION)
- FIGURE 57. BRAZIL GASIFICATION MARKET, 2022-2032 ($BILLION)
- FIGURE 58. UAE GASIFICATION MARKET, 2022-2032 ($BILLION)
- FIGURE 59. SAUDI ARABIA GASIFICATION MARKET, 2022-2032 ($BILLION)
- FIGURE 60. SOUTH AFRICA GASIFICATION MARKET, 2022-2032 ($BILLION)
- FIGURE 61. REST OF LAMEA GASIFICATION MARKET, 2022-2032 ($BILLION)
- FIGURE 62. TOP WINNING STRATEGIES, BY YEAR
- FIGURE 63. TOP WINNING STRATEGIES, BY DEVELOPMENT
- FIGURE 64. TOP WINNING STRATEGIES, BY COMPANY
- FIGURE 65. PRODUCT MAPPING OF TOP 10 PLAYERS
- FIGURE 66. COMPETITIVE DASHBOARD
- FIGURE 67. COMPETITIVE HEATMAP: GASIFICATION MARKET
- FIGURE 68. TOP PLAYER POSITIONING, 2022

