
PUBLISHER: Allied Market Research | PRODUCT CODE: 1344412

PUBLISHER: Allied Market Research | PRODUCT CODE: 1344412
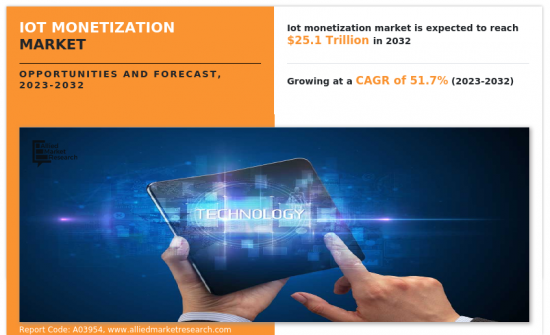
IoT Monetization Market By Component, By Business Function, By Organization Size, By Industry Vertical : Global Opportunity Analysis and Industry Forecast, 2023-2032
According to a new report published by Allied Market Research, titled, "IoT Monetization Market," The iot monetization market was valued at $396.62 billion in 2022, and is estimated to reach $25096.4 billion by 2032, growing at a CAGR of 51.7% from 2023 to 2032.
Rise in market for smart cities and connected cars and growth in penetration of IoT, thus drive the growth of the market. In addition, a major shift from cost savings to revenue generation and a continuous rise in the volume of enterprise data drives the growth of the market during the forecast period. However, lack of strategic decisions and standards, and privacy and security concerns constraints hamper the growth of the market. Furthermore, the growing ecosystem of IoT platforms and service providers provides opportunities for IoT monetization vendors to expand their customer base. Moreover, rise in adoption of cloud platforms and increase in internet connectivity are the major factors that drive the growth of the global IoT monetization market. In addition, surge in use of consumer electronics devices is expected to fuel the growth of the global IoT monetization market. Furthermore, an increase in number of smart lighting and smart city projects is anticipated to provide lucrative growth opportunities for the global IoT monetization market in the upcoming years.
Furthermore, the adoption of IoT monetization solutions has increased in the automotive & transportation industry as the automotive manufacturers are extensively using IoT, which fuels the growth of the market. It is easier to support cities, towns, and states, globally to meet the rise in demand for surface transportation systems through connected cars and intelligent transportation systems such as sensors and communication & traffic control technologies. Consumer electronics is also one of the emerging application segments of the IoT monetization market and is anticipated to grow during the forecast period due to the increase in number of smart appliances that can be connected to smartphones and the Internet.
The IoT monetization market is segmented into component, organization size, industry vertical, business functions, and region. In terms of component, the market is bifurcated into solutions and services. Based on organization size, it is classified into large enterprises and small & medium sized enterprises. As per industry vertical, it is divided into retail, IT & telecom, manufacturing, transportation & logistics, healthcare, BFSI, energy & utilities, and others. According to business function, the market is classified into marketing & sales, IT, finance, supply chain, and operations. Region wise, it is analyzed across North America, Europe, Asia-Pacific, and LAMEA.
The global IoT monetization market is dominated by key players such as Amdocs, Inc., IBM Corporation, Ericsson, SAP SE, Oracle, Thales Group, Cisco Systems, Inc., Aria Systems, Inc., Intel Corp., and General Electric Co. These major players have adopted various key development strategies such as business expansion, new product launches, and partnerships, which help to drive the growth of the IoT monetization market globally.
KEY BENEFITS FOR STAKEHOLDERS
- The study provides an in-depth analysis of the IoT monetization market forecast along with the current and future trends to explain the imminent investment pockets.
- Information about key drivers, restraints, and opportunities and their impact analysis on IoT monetization market trends is provided in the report.
- The Porter's five forces analysis illustrates the potency of the buyers and suppliers operating in the industry.
- The quantitative analysis of the IoT monetization market from 2022 to 2032 is provided to determine the market potential.
Key Market Segments
By Industry Vertical
- Retail
- IT and Telecom
- Manufacturing
- Transportation and Logistics
- Healthcare
- BFSI
- Energy and Utilities
- Others
By Component
- Solution
- Service
By Business Function
- Marketing and Sales
- IT
- Finance
- Supply Chain
- Operations
By Organization Size
- Large Enterprises
- Small and Medium sized Enterprises
By Region
- North America
- U.S.
- Canada
- Europe
- UK
- Germany
- France
- Italy
- Spain
- Rest of Europe
- Asia-Pacific
- China
- Japan
- India
- Australia
- South Korea
- Rest of Asia-Pacific
- LAMEA
- Latin America
- Middle East
- Africa
Key Market Players:
- Cisco Systems, Inc.
- Thales Group
- Oracle Corporation
- IBM Corporation
- SAP SE
- Intel Corporation
- General Electric Co.
- Microsoft Corporation.
- Amdocs, Inc.
- Telefonaktiebolaget LM Ericsson
TABLE OF CONTENTS
CHAPTER 1: INTRODUCTION
- 1.1. Report description
- 1.2. Key market segments
- 1.3. Key benefits to the stakeholders
- 1.4. Research Methodology
- 1.4.1. Primary research
- 1.4.2. Secondary research
- 1.4.3. Analyst tools and models
CHAPTER 2: EXECUTIVE SUMMARY
- 2.1. CXO Perspective
CHAPTER 3: MARKET OVERVIEW
- 3.1. Market definition and scope
- 3.2. Key findings
- 3.2.1. Top impacting factors
- 3.2.2. Top investment pockets
- 3.3. Porter's five forces analysis
- 3.3.1. Bargaining power of suppliers
- 3.3.2. Bargaining power of buyers
- 3.3.3. Threat of substitutes
- 3.3.4. Threat of new entrants
- 3.3.5. Intensity of rivalry
- 3.4. Market dynamics
- 3.4.1. Drivers
- 3.4.1.1. Rise in market for smart cities and connected cars
- 3.4.1.2. Growth in penetration of IoT
- 3.4.1.3. Major shift from cost savings to revenue generation
- 3.4.1.4. Continuous rise in the volume of enterprise data
- 3.4.1. Drivers
- 3.4.2. Restraints
- 3.4.2.1. Lack of strategic decisions and standards
- 3.4.2.2. Privacy and security concerns
- 3.4.3. Opportunities
- 3.4.3.1. Growing ecosystem of IoT platforms and service providers
- 3.5. COVID-19 Impact Analysis on the market
CHAPTER 4: IOT MONETIZATION MARKET, BY COMPONENT
- 4.1. Overview
- 4.1.1. Market size and forecast
- 4.2. Solution
- 4.2.1. Key market trends, growth factors and opportunities
- 4.2.2. Market size and forecast, by region
- 4.2.3. Market share analysis by country
- 4.3. Service
- 4.3.1. Key market trends, growth factors and opportunities
- 4.3.2. Market size and forecast, by region
- 4.3.3. Market share analysis by country
CHAPTER 5: IOT MONETIZATION MARKET, BY BUSINESS FUNCTION
- 5.1. Overview
- 5.1.1. Market size and forecast
- 5.2. Marketing and Sales
- 5.2.1. Key market trends, growth factors and opportunities
- 5.2.2. Market size and forecast, by region
- 5.2.3. Market share analysis by country
- 5.3. IT
- 5.3.1. Key market trends, growth factors and opportunities
- 5.3.2. Market size and forecast, by region
- 5.3.3. Market share analysis by country
- 5.4. Finance
- 5.4.1. Key market trends, growth factors and opportunities
- 5.4.2. Market size and forecast, by region
- 5.4.3. Market share analysis by country
- 5.5. Supply Chain
- 5.5.1. Key market trends, growth factors and opportunities
- 5.5.2. Market size and forecast, by region
- 5.5.3. Market share analysis by country
- 5.6. Operations
- 5.6.1. Key market trends, growth factors and opportunities
- 5.6.2. Market size and forecast, by region
- 5.6.3. Market share analysis by country
CHAPTER 6: IOT MONETIZATION MARKET, BY ORGANIZATION SIZE
- 6.1. Overview
- 6.1.1. Market size and forecast
- 6.2. Large Enterprises
- 6.2.1. Key market trends, growth factors and opportunities
- 6.2.2. Market size and forecast, by region
- 6.2.3. Market share analysis by country
- 6.3. Small and Medium sized Enterprises
- 6.3.1. Key market trends, growth factors and opportunities
- 6.3.2. Market size and forecast, by region
- 6.3.3. Market share analysis by country
CHAPTER 7: IOT MONETIZATION MARKET, BY INDUSTRY VERTICAL
- 7.1. Overview
- 7.1.1. Market size and forecast
- 7.2. Retail
- 7.2.1. Key market trends, growth factors and opportunities
- 7.2.2. Market size and forecast, by region
- 7.2.3. Market share analysis by country
- 7.3. IT and Telecom
- 7.3.1. Key market trends, growth factors and opportunities
- 7.3.2. Market size and forecast, by region
- 7.3.3. Market share analysis by country
- 7.4. Manufacturing
- 7.4.1. Key market trends, growth factors and opportunities
- 7.4.2. Market size and forecast, by region
- 7.4.3. Market share analysis by country
- 7.5. Transportation and Logistics
- 7.5.1. Key market trends, growth factors and opportunities
- 7.5.2. Market size and forecast, by region
- 7.5.3. Market share analysis by country
- 7.6. Healthcare
- 7.6.1. Key market trends, growth factors and opportunities
- 7.6.2. Market size and forecast, by region
- 7.6.3. Market share analysis by country
- 7.7. BFSI
- 7.7.1. Key market trends, growth factors and opportunities
- 7.7.2. Market size and forecast, by region
- 7.7.3. Market share analysis by country
- 7.8. Energy and Utilities
- 7.8.1. Key market trends, growth factors and opportunities
- 7.8.2. Market size and forecast, by region
- 7.8.3. Market share analysis by country
- 7.9. Others
- 7.9.1. Key market trends, growth factors and opportunities
- 7.9.2. Market size and forecast, by region
- 7.9.3. Market share analysis by country
CHAPTER 8: IOT MONETIZATION MARKET, BY REGION
- 8.1. Overview
- 8.1.1. Market size and forecast By Region
- 8.2. North America
- 8.2.1. Key trends and opportunities
- 8.2.2. Market size and forecast, by Component
- 8.2.3. Market size and forecast, by Business Function
- 8.2.4. Market size and forecast, by Organization Size
- 8.2.5. Market size and forecast, by Industry Vertical
- 8.2.6. Market size and forecast, by country
- 8.2.6.1. U.S.
- 8.2.6.1.1. Key market trends, growth factors and opportunities
- 8.2.6.1.2. Market size and forecast, by Component
- 8.2.6.1.3. Market size and forecast, by Business Function
- 8.2.6.1.4. Market size and forecast, by Organization Size
- 8.2.6.1.5. Market size and forecast, by Industry Vertical
- 8.2.6.2. Canada
- 8.2.6.2.1. Key market trends, growth factors and opportunities
- 8.2.6.2.2. Market size and forecast, by Component
- 8.2.6.2.3. Market size and forecast, by Business Function
- 8.2.6.2.4. Market size and forecast, by Organization Size
- 8.2.6.2.5. Market size and forecast, by Industry Vertical
- 8.3. Europe
- 8.3.1. Key trends and opportunities
- 8.3.2. Market size and forecast, by Component
- 8.3.3. Market size and forecast, by Business Function
- 8.3.4. Market size and forecast, by Organization Size
- 8.3.5. Market size and forecast, by Industry Vertical
- 8.3.6. Market size and forecast, by country
- 8.3.6.1. UK
- 8.3.6.1.1. Key market trends, growth factors and opportunities
- 8.3.6.1.2. Market size and forecast, by Component
- 8.3.6.1.3. Market size and forecast, by Business Function
- 8.3.6.1.4. Market size and forecast, by Organization Size
- 8.3.6.1.5. Market size and forecast, by Industry Vertical
- 8.3.6.2. Germany
- 8.3.6.2.1. Key market trends, growth factors and opportunities
- 8.3.6.2.2. Market size and forecast, by Component
- 8.3.6.2.3. Market size and forecast, by Business Function
- 8.3.6.2.4. Market size and forecast, by Organization Size
- 8.3.6.2.5. Market size and forecast, by Industry Vertical
- 8.3.6.3. France
- 8.3.6.3.1. Key market trends, growth factors and opportunities
- 8.3.6.3.2. Market size and forecast, by Component
- 8.3.6.3.3. Market size and forecast, by Business Function
- 8.3.6.3.4. Market size and forecast, by Organization Size
- 8.3.6.3.5. Market size and forecast, by Industry Vertical
- 8.3.6.4. Italy
- 8.3.6.4.1. Key market trends, growth factors and opportunities
- 8.3.6.4.2. Market size and forecast, by Component
- 8.3.6.4.3. Market size and forecast, by Business Function
- 8.3.6.4.4. Market size and forecast, by Organization Size
- 8.3.6.4.5. Market size and forecast, by Industry Vertical
- 8.3.6.5. Spain
- 8.3.6.5.1. Key market trends, growth factors and opportunities
- 8.3.6.5.2. Market size and forecast, by Component
- 8.3.6.5.3. Market size and forecast, by Business Function
- 8.3.6.5.4. Market size and forecast, by Organization Size
- 8.3.6.5.5. Market size and forecast, by Industry Vertical
- 8.3.6.6. Rest of Europe
- 8.3.6.6.1. Key market trends, growth factors and opportunities
- 8.3.6.6.2. Market size and forecast, by Component
- 8.3.6.6.3. Market size and forecast, by Business Function
- 8.3.6.6.4. Market size and forecast, by Organization Size
- 8.3.6.6.5. Market size and forecast, by Industry Vertical
- 8.4. Asia-Pacific
- 8.4.1. Key trends and opportunities
- 8.4.2. Market size and forecast, by Component
- 8.4.3. Market size and forecast, by Business Function
- 8.4.4. Market size and forecast, by Organization Size
- 8.4.5. Market size and forecast, by Industry Vertical
- 8.4.6. Market size and forecast, by country
- 8.4.6.1. China
- 8.4.6.1.1. Key market trends, growth factors and opportunities
- 8.4.6.1.2. Market size and forecast, by Component
- 8.4.6.1.3. Market size and forecast, by Business Function
- 8.4.6.1.4. Market size and forecast, by Organization Size
- 8.4.6.1.5. Market size and forecast, by Industry Vertical
- 8.4.6.2. Japan
- 8.4.6.2.1. Key market trends, growth factors and opportunities
- 8.4.6.2.2. Market size and forecast, by Component
- 8.4.6.2.3. Market size and forecast, by Business Function
- 8.4.6.2.4. Market size and forecast, by Organization Size
- 8.4.6.2.5. Market size and forecast, by Industry Vertical
- 8.4.6.3. India
- 8.4.6.3.1. Key market trends, growth factors and opportunities
- 8.4.6.3.2. Market size and forecast, by Component
- 8.4.6.3.3. Market size and forecast, by Business Function
- 8.4.6.3.4. Market size and forecast, by Organization Size
- 8.4.6.3.5. Market size and forecast, by Industry Vertical
- 8.4.6.4. Australia
- 8.4.6.4.1. Key market trends, growth factors and opportunities
- 8.4.6.4.2. Market size and forecast, by Component
- 8.4.6.4.3. Market size and forecast, by Business Function
- 8.4.6.4.4. Market size and forecast, by Organization Size
- 8.4.6.4.5. Market size and forecast, by Industry Vertical
- 8.4.6.5. South Korea
- 8.4.6.5.1. Key market trends, growth factors and opportunities
- 8.4.6.5.2. Market size and forecast, by Component
- 8.4.6.5.3. Market size and forecast, by Business Function
- 8.4.6.5.4. Market size and forecast, by Organization Size
- 8.4.6.5.5. Market size and forecast, by Industry Vertical
- 8.4.6.6. Rest of Asia-Pacific
- 8.4.6.6.1. Key market trends, growth factors and opportunities
- 8.4.6.6.2. Market size and forecast, by Component
- 8.4.6.6.3. Market size and forecast, by Business Function
- 8.4.6.6.4. Market size and forecast, by Organization Size
- 8.4.6.6.5. Market size and forecast, by Industry Vertical
- 8.5. LAMEA
- 8.5.1. Key trends and opportunities
- 8.5.2. Market size and forecast, by Component
- 8.5.3. Market size and forecast, by Business Function
- 8.5.4. Market size and forecast, by Organization Size
- 8.5.5. Market size and forecast, by Industry Vertical
- 8.5.6. Market size and forecast, by country
- 8.5.6.1. Latin America
- 8.5.6.1.1. Key market trends, growth factors and opportunities
- 8.5.6.1.2. Market size and forecast, by Component
- 8.5.6.1.3. Market size and forecast, by Business Function
- 8.5.6.1.4. Market size and forecast, by Organization Size
- 8.5.6.1.5. Market size and forecast, by Industry Vertical
- 8.5.6.2. Middle East
- 8.5.6.2.1. Key market trends, growth factors and opportunities
- 8.5.6.2.2. Market size and forecast, by Component
- 8.5.6.2.3. Market size and forecast, by Business Function
- 8.5.6.2.4. Market size and forecast, by Organization Size
- 8.5.6.2.5. Market size and forecast, by Industry Vertical
- 8.5.6.3. Africa
- 8.5.6.3.1. Key market trends, growth factors and opportunities
- 8.5.6.3.2. Market size and forecast, by Component
- 8.5.6.3.3. Market size and forecast, by Business Function
- 8.5.6.3.4. Market size and forecast, by Organization Size
- 8.5.6.3.5. Market size and forecast, by Industry Vertical
CHAPTER 9: COMPETITIVE LANDSCAPE
- 9.1. Introduction
- 9.2. Top winning strategies
- 9.3. Product Mapping of Top 10 Player
- 9.4. Competitive Dashboard
- 9.5. Competitive Heatmap
- 9.6. Top player positioning, 2022
CHAPTER 10: COMPANY PROFILES
- 10.1. Amdocs, Inc.
- 10.1.1. Company overview
- 10.1.2. Key Executives
- 10.1.3. Company snapshot
- 10.1.4. Operating business segments
- 10.1.5. Product portfolio
- 10.1.6. Business performance
- 10.1.7. Key strategic moves and developments
- 10.2. IBM Corporation
- 10.2.1. Company overview
- 10.2.2. Key Executives
- 10.2.3. Company snapshot
- 10.2.4. Operating business segments
- 10.2.5. Product portfolio
- 10.2.6. Business performance
- 10.3. Telefonaktiebolaget LM Ericsson
- 10.3.1. Company overview
- 10.3.2. Key Executives
- 10.3.3. Company snapshot
- 10.3.4. Operating business segments
- 10.3.5. Product portfolio
- 10.3.6. Business performance
- 10.4. SAP SE
- 10.4.1. Company overview
- 10.4.2. Key Executives
- 10.4.3. Company snapshot
- 10.4.4. Operating business segments
- 10.4.5. Product portfolio
- 10.4.6. Business performance
- 10.5. Oracle Corporation
- 10.5.1. Company overview
- 10.5.2. Key Executives
- 10.5.3. Company snapshot
- 10.5.4. Operating business segments
- 10.5.5. Product portfolio
- 10.5.6. Business performance
- 10.6. Cisco Systems, Inc.
- 10.6.1. Company overview
- 10.6.2. Key Executives
- 10.6.3. Company snapshot
- 10.6.4. Operating business segments
- 10.6.5. Product portfolio
- 10.6.6. Business performance
- 10.7. Intel Corporation
- 10.7.1. Company overview
- 10.7.2. Key Executives
- 10.7.3. Company snapshot
- 10.7.4. Operating business segments
- 10.7.5. Product portfolio
- 10.7.6. Business performance
- 10.8. General Electric Co.
- 10.8.1. Company overview
- 10.8.2. Key Executives
- 10.8.3. Company snapshot
- 10.8.4. Operating business segments
- 10.8.5. Product portfolio
- 10.8.6. Business performance
- 10.9. Microsoft Corporation.
- 10.9.1. Company overview
- 10.9.2. Key Executives
- 10.9.3. Company snapshot
- 10.9.4. Operating business segments
- 10.9.5. Product portfolio
- 10.9.6. Business performance
- 10.10. Thales Group
- 10.10.1. Company overview
- 10.10.2. Key Executives
- 10.10.3. Company snapshot
- 10.10.4. Operating business segments
- 10.10.5. Product portfolio
- 10.10.6. Business performance
LIST OF TABLES
- TABLE 01. GLOBAL IOT MONETIZATION MARKET, BY COMPONENT, 2022-2032 ($BILLION)
- TABLE 02. IOT MONETIZATION MARKET FOR SOLUTION, BY REGION, 2022-2032 ($BILLION)
- TABLE 03. IOT MONETIZATION MARKET FOR SERVICE, BY REGION, 2022-2032 ($BILLION)
- TABLE 04. GLOBAL IOT MONETIZATION MARKET, BY BUSINESS FUNCTION, 2022-2032 ($BILLION)
- TABLE 05. IOT MONETIZATION MARKET FOR MARKETING AND SALES, BY REGION, 2022-2032 ($BILLION)
- TABLE 06. IOT MONETIZATION MARKET FOR IT, BY REGION, 2022-2032 ($BILLION)
- TABLE 07. IOT MONETIZATION MARKET FOR FINANCE, BY REGION, 2022-2032 ($BILLION)
- TABLE 08. IOT MONETIZATION MARKET FOR SUPPLY CHAIN, BY REGION, 2022-2032 ($BILLION)
- TABLE 09. IOT MONETIZATION MARKET FOR OPERATIONS, BY REGION, 2022-2032 ($BILLION)
- TABLE 10. GLOBAL IOT MONETIZATION MARKET, BY ORGANIZATION SIZE, 2022-2032 ($BILLION)
- TABLE 11. IOT MONETIZATION MARKET FOR LARGE ENTERPRISES, BY REGION, 2022-2032 ($BILLION)
- TABLE 12. IOT MONETIZATION MARKET FOR SMALL AND MEDIUM SIZED ENTERPRISES, BY REGION, 2022-2032 ($BILLION)
- TABLE 13. GLOBAL IOT MONETIZATION MARKET, BY INDUSTRY VERTICAL, 2022-2032 ($BILLION)
- TABLE 14. IOT MONETIZATION MARKET FOR RETAIL, BY REGION, 2022-2032 ($BILLION)
- TABLE 15. IOT MONETIZATION MARKET FOR IT AND TELECOM, BY REGION, 2022-2032 ($BILLION)
- TABLE 16. IOT MONETIZATION MARKET FOR MANUFACTURING, BY REGION, 2022-2032 ($BILLION)
- TABLE 17. IOT MONETIZATION MARKET FOR TRANSPORTATION AND LOGISTICS, BY REGION, 2022-2032 ($BILLION)
- TABLE 18. IOT MONETIZATION MARKET FOR HEALTHCARE, BY REGION, 2022-2032 ($BILLION)
- TABLE 19. IOT MONETIZATION MARKET FOR BFSI, BY REGION, 2022-2032 ($BILLION)
- TABLE 20. IOT MONETIZATION MARKET FOR ENERGY AND UTILITIES, BY REGION, 2022-2032 ($BILLION)
- TABLE 21. IOT MONETIZATION MARKET FOR OTHERS, BY REGION, 2022-2032 ($BILLION)
- TABLE 22. IOT MONETIZATION MARKET, BY REGION, 2022-2032 ($BILLION)
- TABLE 23. NORTH AMERICA IOT MONETIZATION MARKET, BY COMPONENT, 2022-2032 ($BILLION)
- TABLE 24. NORTH AMERICA IOT MONETIZATION MARKET, BY BUSINESS FUNCTION, 2022-2032 ($BILLION)
- TABLE 25. NORTH AMERICA IOT MONETIZATION MARKET, BY ORGANIZATION SIZE, 2022-2032 ($BILLION)
- TABLE 26. NORTH AMERICA IOT MONETIZATION MARKET, BY INDUSTRY VERTICAL, 2022-2032 ($BILLION)
- TABLE 27. NORTH AMERICA IOT MONETIZATION MARKET, BY COUNTRY, 2022-2032 ($BILLION)
- TABLE 28. U.S. IOT MONETIZATION MARKET, BY COMPONENT, 2022-2032 ($BILLION)
- TABLE 29. U.S. IOT MONETIZATION MARKET, BY BUSINESS FUNCTION, 2022-2032 ($BILLION)
- TABLE 30. U.S. IOT MONETIZATION MARKET, BY ORGANIZATION SIZE, 2022-2032 ($BILLION)
- TABLE 31. U.S. IOT MONETIZATION MARKET, BY INDUSTRY VERTICAL, 2022-2032 ($BILLION)
- TABLE 32. CANADA IOT MONETIZATION MARKET, BY COMPONENT, 2022-2032 ($BILLION)
- TABLE 33. CANADA IOT MONETIZATION MARKET, BY BUSINESS FUNCTION, 2022-2032 ($BILLION)
- TABLE 34. CANADA IOT MONETIZATION MARKET, BY ORGANIZATION SIZE, 2022-2032 ($BILLION)
- TABLE 35. CANADA IOT MONETIZATION MARKET, BY INDUSTRY VERTICAL, 2022-2032 ($BILLION)
- TABLE 36. EUROPE IOT MONETIZATION MARKET, BY COMPONENT, 2022-2032 ($BILLION)
- TABLE 37. EUROPE IOT MONETIZATION MARKET, BY BUSINESS FUNCTION, 2022-2032 ($BILLION)
- TABLE 38. EUROPE IOT MONETIZATION MARKET, BY ORGANIZATION SIZE, 2022-2032 ($BILLION)
- TABLE 39. EUROPE IOT MONETIZATION MARKET, BY INDUSTRY VERTICAL, 2022-2032 ($BILLION)
- TABLE 40. EUROPE IOT MONETIZATION MARKET, BY COUNTRY, 2022-2032 ($BILLION)
- TABLE 41. UK IOT MONETIZATION MARKET, BY COMPONENT, 2022-2032 ($BILLION)
- TABLE 42. UK IOT MONETIZATION MARKET, BY BUSINESS FUNCTION, 2022-2032 ($BILLION)
- TABLE 43. UK IOT MONETIZATION MARKET, BY ORGANIZATION SIZE, 2022-2032 ($BILLION)
- TABLE 44. UK IOT MONETIZATION MARKET, BY INDUSTRY VERTICAL, 2022-2032 ($BILLION)
- TABLE 45. GERMANY IOT MONETIZATION MARKET, BY COMPONENT, 2022-2032 ($BILLION)
- TABLE 46. GERMANY IOT MONETIZATION MARKET, BY BUSINESS FUNCTION, 2022-2032 ($BILLION)
- TABLE 47. GERMANY IOT MONETIZATION MARKET, BY ORGANIZATION SIZE, 2022-2032 ($BILLION)
- TABLE 48. GERMANY IOT MONETIZATION MARKET, BY INDUSTRY VERTICAL, 2022-2032 ($BILLION)
- TABLE 49. FRANCE IOT MONETIZATION MARKET, BY COMPONENT, 2022-2032 ($BILLION)
- TABLE 50. FRANCE IOT MONETIZATION MARKET, BY BUSINESS FUNCTION, 2022-2032 ($BILLION)
- TABLE 51. FRANCE IOT MONETIZATION MARKET, BY ORGANIZATION SIZE, 2022-2032 ($BILLION)
- TABLE 52. FRANCE IOT MONETIZATION MARKET, BY INDUSTRY VERTICAL, 2022-2032 ($BILLION)
- TABLE 53. ITALY IOT MONETIZATION MARKET, BY COMPONENT, 2022-2032 ($BILLION)
- TABLE 54. ITALY IOT MONETIZATION MARKET, BY BUSINESS FUNCTION, 2022-2032 ($BILLION)
- TABLE 55. ITALY IOT MONETIZATION MARKET, BY ORGANIZATION SIZE, 2022-2032 ($BILLION)
- TABLE 56. ITALY IOT MONETIZATION MARKET, BY INDUSTRY VERTICAL, 2022-2032 ($BILLION)
- TABLE 57. SPAIN IOT MONETIZATION MARKET, BY COMPONENT, 2022-2032 ($BILLION)
- TABLE 58. SPAIN IOT MONETIZATION MARKET, BY BUSINESS FUNCTION, 2022-2032 ($BILLION)
- TABLE 59. SPAIN IOT MONETIZATION MARKET, BY ORGANIZATION SIZE, 2022-2032 ($BILLION)
- TABLE 60. SPAIN IOT MONETIZATION MARKET, BY INDUSTRY VERTICAL, 2022-2032 ($BILLION)
- TABLE 61. REST OF EUROPE IOT MONETIZATION MARKET, BY COMPONENT, 2022-2032 ($BILLION)
- TABLE 62. REST OF EUROPE IOT MONETIZATION MARKET, BY BUSINESS FUNCTION, 2022-2032 ($BILLION)
- TABLE 63. REST OF EUROPE IOT MONETIZATION MARKET, BY ORGANIZATION SIZE, 2022-2032 ($BILLION)
- TABLE 64. REST OF EUROPE IOT MONETIZATION MARKET, BY INDUSTRY VERTICAL, 2022-2032 ($BILLION)
- TABLE 65. ASIA-PACIFIC IOT MONETIZATION MARKET, BY COMPONENT, 2022-2032 ($BILLION)
- TABLE 66. ASIA-PACIFIC IOT MONETIZATION MARKET, BY BUSINESS FUNCTION, 2022-2032 ($BILLION)
- TABLE 67. ASIA-PACIFIC IOT MONETIZATION MARKET, BY ORGANIZATION SIZE, 2022-2032 ($BILLION)
- TABLE 68. ASIA-PACIFIC IOT MONETIZATION MARKET, BY INDUSTRY VERTICAL, 2022-2032 ($BILLION)
- TABLE 69. ASIA-PACIFIC IOT MONETIZATION MARKET, BY COUNTRY, 2022-2032 ($BILLION)
- TABLE 70. CHINA IOT MONETIZATION MARKET, BY COMPONENT, 2022-2032 ($BILLION)
- TABLE 71. CHINA IOT MONETIZATION MARKET, BY BUSINESS FUNCTION, 2022-2032 ($BILLION)
- TABLE 72. CHINA IOT MONETIZATION MARKET, BY ORGANIZATION SIZE, 2022-2032 ($BILLION)
- TABLE 73. CHINA IOT MONETIZATION MARKET, BY INDUSTRY VERTICAL, 2022-2032 ($BILLION)
- TABLE 74. JAPAN IOT MONETIZATION MARKET, BY COMPONENT, 2022-2032 ($BILLION)
- TABLE 75. JAPAN IOT MONETIZATION MARKET, BY BUSINESS FUNCTION, 2022-2032 ($BILLION)
- TABLE 76. JAPAN IOT MONETIZATION MARKET, BY ORGANIZATION SIZE, 2022-2032 ($BILLION)
- TABLE 77. JAPAN IOT MONETIZATION MARKET, BY INDUSTRY VERTICAL, 2022-2032 ($BILLION)
- TABLE 78. INDIA IOT MONETIZATION MARKET, BY COMPONENT, 2022-2032 ($BILLION)
- TABLE 79. INDIA IOT MONETIZATION MARKET, BY BUSINESS FUNCTION, 2022-2032 ($BILLION)
- TABLE 80. INDIA IOT MONETIZATION MARKET, BY ORGANIZATION SIZE, 2022-2032 ($BILLION)
- TABLE 81. INDIA IOT MONETIZATION MARKET, BY INDUSTRY VERTICAL, 2022-2032 ($BILLION)
- TABLE 82. AUSTRALIA IOT MONETIZATION MARKET, BY COMPONENT, 2022-2032 ($BILLION)
- TABLE 83. AUSTRALIA IOT MONETIZATION MARKET, BY BUSINESS FUNCTION, 2022-2032 ($BILLION)
- TABLE 84. AUSTRALIA IOT MONETIZATION MARKET, BY ORGANIZATION SIZE, 2022-2032 ($BILLION)
- TABLE 85. AUSTRALIA IOT MONETIZATION MARKET, BY INDUSTRY VERTICAL, 2022-2032 ($BILLION)
- TABLE 86. SOUTH KOREA IOT MONETIZATION MARKET, BY COMPONENT, 2022-2032 ($BILLION)
- TABLE 87. SOUTH KOREA IOT MONETIZATION MARKET, BY BUSINESS FUNCTION, 2022-2032 ($BILLION)
- TABLE 88. SOUTH KOREA IOT MONETIZATION MARKET, BY ORGANIZATION SIZE, 2022-2032 ($BILLION)
- TABLE 89. SOUTH KOREA IOT MONETIZATION MARKET, BY INDUSTRY VERTICAL, 2022-2032 ($BILLION)
- TABLE 90. REST OF ASIA-PACIFIC IOT MONETIZATION MARKET, BY COMPONENT, 2022-2032 ($BILLION)
- TABLE 91. REST OF ASIA-PACIFIC IOT MONETIZATION MARKET, BY BUSINESS FUNCTION, 2022-2032 ($BILLION)
- TABLE 92. REST OF ASIA-PACIFIC IOT MONETIZATION MARKET, BY ORGANIZATION SIZE, 2022-2032 ($BILLION)
- TABLE 93. REST OF ASIA-PACIFIC IOT MONETIZATION MARKET, BY INDUSTRY VERTICAL, 2022-2032 ($BILLION)
- TABLE 94. LAMEA IOT MONETIZATION MARKET, BY COMPONENT, 2022-2032 ($BILLION)
- TABLE 95. LAMEA IOT MONETIZATION MARKET, BY BUSINESS FUNCTION, 2022-2032 ($BILLION)
- TABLE 96. LAMEA IOT MONETIZATION MARKET, BY ORGANIZATION SIZE, 2022-2032 ($BILLION)
- TABLE 97. LAMEA IOT MONETIZATION MARKET, BY INDUSTRY VERTICAL, 2022-2032 ($BILLION)
- TABLE 98. LAMEA IOT MONETIZATION MARKET, BY COUNTRY, 2022-2032 ($BILLION)
- TABLE 99. LATIN AMERICA IOT MONETIZATION MARKET, BY COMPONENT, 2022-2032 ($BILLION)
- TABLE 100. LATIN AMERICA IOT MONETIZATION MARKET, BY BUSINESS FUNCTION, 2022-2032 ($BILLION)
- TABLE 101. LATIN AMERICA IOT MONETIZATION MARKET, BY ORGANIZATION SIZE, 2022-2032 ($BILLION)
- TABLE 102. LATIN AMERICA IOT MONETIZATION MARKET, BY INDUSTRY VERTICAL, 2022-2032 ($BILLION)
- TABLE 103. MIDDLE EAST IOT MONETIZATION MARKET, BY COMPONENT, 2022-2032 ($BILLION)
- TABLE 104. MIDDLE EAST IOT MONETIZATION MARKET, BY BUSINESS FUNCTION, 2022-2032 ($BILLION)
- TABLE 105. MIDDLE EAST IOT MONETIZATION MARKET, BY ORGANIZATION SIZE, 2022-2032 ($BILLION)
- TABLE 106. MIDDLE EAST IOT MONETIZATION MARKET, BY INDUSTRY VERTICAL, 2022-2032 ($BILLION)
- TABLE 107. AFRICA IOT MONETIZATION MARKET, BY COMPONENT, 2022-2032 ($BILLION)
- TABLE 108. AFRICA IOT MONETIZATION MARKET, BY BUSINESS FUNCTION, 2022-2032 ($BILLION)
- TABLE 109. AFRICA IOT MONETIZATION MARKET, BY ORGANIZATION SIZE, 2022-2032 ($BILLION)
- TABLE 110. AFRICA IOT MONETIZATION MARKET, BY INDUSTRY VERTICAL, 2022-2032 ($BILLION)
- TABLE 111. AMDOCS, INC.: KEY EXECUTIVES
- TABLE 112. AMDOCS, INC.: COMPANY SNAPSHOT
- TABLE 113. AMDOCS, INC.: PRODUCT SEGMENTS
- TABLE 114. AMDOCS, INC.: PRODUCT PORTFOLIO
- TABLE 115. AMDOCS, INC.: KEY STRATERGIES
- TABLE 116. IBM CORPORATION: KEY EXECUTIVES
- TABLE 117. IBM CORPORATION: COMPANY SNAPSHOT
- TABLE 118. IBM CORPORATION: SERVICE SEGMENTS
- TABLE 119. IBM CORPORATION: PRODUCT PORTFOLIO
- TABLE 120. TELEFONAKTIEBOLAGET LM ERICSSON: KEY EXECUTIVES
- TABLE 121. TELEFONAKTIEBOLAGET LM ERICSSON: COMPANY SNAPSHOT
- TABLE 122. TELEFONAKTIEBOLAGET LM ERICSSON: SERVICE SEGMENTS
- TABLE 123. TELEFONAKTIEBOLAGET LM ERICSSON: PRODUCT PORTFOLIO
- TABLE 124. SAP SE: KEY EXECUTIVES
- TABLE 125. SAP SE: COMPANY SNAPSHOT
- TABLE 126. SAP SE: SERVICE SEGMENTS
- TABLE 127. SAP SE: PRODUCT PORTFOLIO
- TABLE 128. ORACLE CORPORATION: KEY EXECUTIVES
- TABLE 129. ORACLE CORPORATION: COMPANY SNAPSHOT
- TABLE 130. ORACLE CORPORATION: SERVICE SEGMENTS
- TABLE 131. ORACLE CORPORATION: PRODUCT PORTFOLIO
- TABLE 132. CISCO SYSTEMS, INC.: KEY EXECUTIVES
- TABLE 133. CISCO SYSTEMS, INC.: COMPANY SNAPSHOT
- TABLE 134. CISCO SYSTEMS, INC.: PRODUCT SEGMENTS
- TABLE 135. CISCO SYSTEMS, INC.: PRODUCT PORTFOLIO
- TABLE 136. INTEL CORPORATION: KEY EXECUTIVES
- TABLE 137. INTEL CORPORATION: COMPANY SNAPSHOT
- TABLE 138. INTEL CORPORATION: SERVICE SEGMENTS
- TABLE 139. INTEL CORPORATION: PRODUCT PORTFOLIO
- TABLE 140. GENERAL ELECTRIC CO.: KEY EXECUTIVES
- TABLE 141. GENERAL ELECTRIC CO.: COMPANY SNAPSHOT
- TABLE 142. GENERAL ELECTRIC CO.: SERVICE SEGMENTS
- TABLE 143. GENERAL ELECTRIC CO.: PRODUCT PORTFOLIO
- TABLE 144. MICROSOFT CORPORATION.: KEY EXECUTIVES
- TABLE 145. MICROSOFT CORPORATION.: COMPANY SNAPSHOT
- TABLE 146. MICROSOFT CORPORATION.: SERVICE SEGMENTS
- TABLE 147. MICROSOFT CORPORATION.: PRODUCT PORTFOLIO
- TABLE 148. THALES GROUP: KEY EXECUTIVES
- TABLE 149. THALES GROUP: COMPANY SNAPSHOT
- TABLE 150. THALES GROUP: PRODUCT SEGMENTS
- TABLE 151. THALES GROUP: PRODUCT PORTFOLIO
LIST OF FIGURES
- FIGURE 01. IOT MONETIZATION MARKET, 2022-2032
- FIGURE 02. SEGMENTATION OF IOT MONETIZATION MARKET, 2022-2032
- FIGURE 03. TOP INVESTMENT POCKETS IN IOT MONETIZATION MARKET (2023-2032)
- FIGURE 04. LOW-TO-HIGH BARGAINING POWER OF SUPPLIERS
- FIGURE 05. MODEARTE BARGAINING POWER OF BUYERS
- FIGURE 06. MODERATE THREAT OF SUBSTITUTES
- FIGURE 07. LOW THREAT OF NEW ENTRANTS
- FIGURE 08. LOW-TO-HIGH INTENSITY OF RIVALRY
- FIGURE 09. DRIVERS, RESTRAINTS AND OPPORTUNITIES: GLOBALIOT MONETIZATION MARKET
- FIGURE 10. IOT MONETIZATION MARKET, BY COMPONENT, 2022(%)
- FIGURE 11. COMPARATIVE SHARE ANALYSIS OF IOT MONETIZATION MARKET FOR SOLUTION, BY COUNTRY 2022 AND 2032(%)
- FIGURE 12. COMPARATIVE SHARE ANALYSIS OF IOT MONETIZATION MARKET FOR SERVICE, BY COUNTRY 2022 AND 2032(%)
- FIGURE 13. IOT MONETIZATION MARKET, BY BUSINESS FUNCTION, 2022(%)
- FIGURE 14. COMPARATIVE SHARE ANALYSIS OF IOT MONETIZATION MARKET FOR MARKETING AND SALES, BY COUNTRY 2022 AND 2032(%)
- FIGURE 15. COMPARATIVE SHARE ANALYSIS OF IOT MONETIZATION MARKET FOR IT, BY COUNTRY 2022 AND 2032(%)
- FIGURE 16. COMPARATIVE SHARE ANALYSIS OF IOT MONETIZATION MARKET FOR FINANCE, BY COUNTRY 2022 AND 2032(%)
- FIGURE 17. COMPARATIVE SHARE ANALYSIS OF IOT MONETIZATION MARKET FOR SUPPLY CHAIN, BY COUNTRY 2022 AND 2032(%)
- FIGURE 18. COMPARATIVE SHARE ANALYSIS OF IOT MONETIZATION MARKET FOR OPERATIONS, BY COUNTRY 2022 AND 2032(%)
- FIGURE 19. IOT MONETIZATION MARKET, BY ORGANIZATION SIZE, 2022(%)
- FIGURE 20. COMPARATIVE SHARE ANALYSIS OF IOT MONETIZATION MARKET FOR LARGE ENTERPRISES, BY COUNTRY 2022 AND 2032(%)
- FIGURE 21. COMPARATIVE SHARE ANALYSIS OF IOT MONETIZATION MARKET FOR SMALL AND MEDIUM SIZED ENTERPRISES, BY COUNTRY 2022 AND 2032(%)
- FIGURE 22. IOT MONETIZATION MARKET, BY INDUSTRY VERTICAL, 2022(%)
- FIGURE 23. COMPARATIVE SHARE ANALYSIS OF IOT MONETIZATION MARKET FOR RETAIL, BY COUNTRY 2022 AND 2032(%)
- FIGURE 24. COMPARATIVE SHARE ANALYSIS OF IOT MONETIZATION MARKET FOR IT AND TELECOM, BY COUNTRY 2022 AND 2032(%)
- FIGURE 25. COMPARATIVE SHARE ANALYSIS OF IOT MONETIZATION MARKET FOR MANUFACTURING, BY COUNTRY 2022 AND 2032(%)
- FIGURE 26. COMPARATIVE SHARE ANALYSIS OF IOT MONETIZATION MARKET FOR TRANSPORTATION AND LOGISTICS, BY COUNTRY 2022 AND 2032(%)
- FIGURE 27. COMPARATIVE SHARE ANALYSIS OF IOT MONETIZATION MARKET FOR HEALTHCARE, BY COUNTRY 2022 AND 2032(%)
- FIGURE 28. COMPARATIVE SHARE ANALYSIS OF IOT MONETIZATION MARKET FOR BFSI, BY COUNTRY 2022 AND 2032(%)
- FIGURE 29. COMPARATIVE SHARE ANALYSIS OF IOT MONETIZATION MARKET FOR ENERGY AND UTILITIES, BY COUNTRY 2022 AND 2032(%)
- FIGURE 30. COMPARATIVE SHARE ANALYSIS OF IOT MONETIZATION MARKET FOR OTHERS, BY COUNTRY 2022 AND 2032(%)
- FIGURE 31. IOT MONETIZATION MARKET BY REGION, 2022
- FIGURE 32. U.S. IOT MONETIZATION MARKET, 2022-2032 ($BILLION)
- FIGURE 33. CANADA IOT MONETIZATION MARKET, 2022-2032 ($BILLION)
- FIGURE 34. UK IOT MONETIZATION MARKET, 2022-2032 ($BILLION)
- FIGURE 35. GERMANY IOT MONETIZATION MARKET, 2022-2032 ($BILLION)
- FIGURE 36. FRANCE IOT MONETIZATION MARKET, 2022-2032 ($BILLION)
- FIGURE 37. ITALY IOT MONETIZATION MARKET, 2022-2032 ($BILLION)
- FIGURE 38. SPAIN IOT MONETIZATION MARKET, 2022-2032 ($BILLION)
- FIGURE 39. REST OF EUROPE IOT MONETIZATION MARKET, 2022-2032 ($BILLION)
- FIGURE 40. CHINA IOT MONETIZATION MARKET, 2022-2032 ($BILLION)
- FIGURE 41. JAPAN IOT MONETIZATION MARKET, 2022-2032 ($BILLION)
- FIGURE 42. INDIA IOT MONETIZATION MARKET, 2022-2032 ($BILLION)
- FIGURE 43. AUSTRALIA IOT MONETIZATION MARKET, 2022-2032 ($BILLION)
- FIGURE 44. SOUTH KOREA IOT MONETIZATION MARKET, 2022-2032 ($BILLION)
- FIGURE 45. REST OF ASIA-PACIFIC IOT MONETIZATION MARKET, 2022-2032 ($BILLION)
- FIGURE 46. LATIN AMERICA IOT MONETIZATION MARKET, 2022-2032 ($BILLION)
- FIGURE 47. MIDDLE EAST IOT MONETIZATION MARKET, 2022-2032 ($BILLION)
- FIGURE 48. AFRICA IOT MONETIZATION MARKET, 2022-2032 ($BILLION)
- FIGURE 49. TOP WINNING STRATEGIES, BY YEAR
- FIGURE 50. TOP WINNING STRATEGIES, BY DEVELOPMENT
- FIGURE 51. TOP WINNING STRATEGIES, BY COMPANY
- FIGURE 52. PRODUCT MAPPING OF TOP 10 PLAYERS
- FIGURE 53. COMPETITIVE DASHBOARD
- FIGURE 54. COMPETITIVE HEATMAP: IOT MONETIZATION MARKET
- FIGURE 55. TOP PLAYER POSITIONING, 2022
- FIGURE 56. AMDOCS, INC.: NET REVENUE, 2020-2022 ($MILLION)
- FIGURE 57. AMDOCS, INC.: REVENUE SHARE BY REGION, 2022 (%)
- FIGURE 58. IBM CORPORATION: NET REVENUE, 2020-2022 ($MILLION)
- FIGURE 59. IBM CORPORATION: RESEARCH & DEVELOPMENT EXPENDITURE, 2020-2022 ($MILLION)
- FIGURE 60. IBM CORPORATION: REVENUE SHARE BY SEGMENT, 2022 (%)
- FIGURE 61. IBM CORPORATION: REVENUE SHARE BY REGION, 2022 (%)
- FIGURE 62. TELEFONAKTIEBOLAGET LM ERICSSON: NET REVENUE, 2019-2021 ($MILLION)
- FIGURE 63. TELEFONAKTIEBOLAGET LM ERICSSON: REVENUE SHARE BY SEGMENT, 2021 (%)
- FIGURE 64. TELEFONAKTIEBOLAGET LM ERICSSON: REVENUE SHARE BY REGION, 2021 (%)
- FIGURE 65. SAP SE: NET REVENUE, 2020-2022 ($MILLION)
- FIGURE 66. SAP SE: RESEARCH & DEVELOPMENT EXPENDITURE, 2020-2022 ($MILLION)
- FIGURE 67. SAP SE: REVENUE SHARE BY SEGMENT, 2022 (%)
- FIGURE 68. SAP SE: REVENUE SHARE BY REGION, 2022 (%)
- FIGURE 69. ORACLE CORPORATION.: NET REVENUE, 2020-2022 ($MILLION)
- FIGURE 70. ORACLE CORPORATION.: RESEARCH & DEVELOPMENT EXPENDITURE, 2020-2022 ($MILLION)
- FIGURE 71. ORACLE CORPORATION.: REVENUE SHARE BY SEGMENT, 2022 (%)
- FIGURE 72. ORACLE CORPORATION.: REVENUE SHARE BY REGION, 2022 (%)
- FIGURE 73. CISCO SYSTEMS, INC.: NET REVENUE, 2020-2022 ($MILLION)
- FIGURE 74. CISCO SYSTEMS, INC.: RESEARCH & DEVELOPMENT EXPENDITURE, 2020-2022 ($MILLION)
- FIGURE 75. CISCO SYSTEMS, INC.: REVENUE SHARE BY SEGMENT, 2022 (%)
- FIGURE 76. INTEL CORPORATION.: NET REVENUE, 2020-2022 ($MILLION)
- FIGURE 77. INTEL CORPORATION.: RESEARCH & DEVELOPMENT EXPENDITURE, 2020-2022 ($MILLION)
- FIGURE 78. INTEL CORPORATION.: REVENUE SHARE BY REGION, 2022 (%)
- FIGURE 79. GENERAL ELECTRIC CO.: NET REVENUE, 2020-2022 ($MILLION)
- FIGURE 80. GENERAL ELECTRIC CO.: RESEARCH & DEVELOPMENT EXPENDITURE, 2020-2022 ($MILLION)
- FIGURE 81. GENERAL ELECTRIC CO.: REVENUE SHARE BY SEGMENT, 2022 (%)
- FIGURE 82. GENERAL ELECTRIC CO.: REVENUE SHARE BY REGION, 2022 (%)
- FIGURE 83. MICROSOFT CORPORATION.: NET REVENUE, 2019-2021 ($MILLION)
- FIGURE 84. MICROSOFT CORPORATION.: RESEARCH & DEVELOPMENT EXPENDITURE, 2019-2021 ($MILLION)
- FIGURE 85. MICROSOFT CORPORATION.: REVENUE SHARE BY SEGMENT, 2021 (%)
- FIGURE 86. MICROSOFT CORPORATION.: REVENUE SHARE BY REGION, 2021 (%)
- FIGURE 87. THALES GROUP: RESEARCH & DEVELOPMENT EXPENDITURE, 2019-2021
- FIGURE 88. THALES GROUP: NET SALES, 2019-2021 ($MILLION)
- FIGURE 89. THALES GROUP: REVENUE SHARE BY SEGMENT, 2021 (%)
- FIGURE 90. THALES GROUP: REVENUE SHARE BY REGION, 2021 (%)

