
PUBLISHER: Allied Market Research | PRODUCT CODE: 1344438

PUBLISHER: Allied Market Research | PRODUCT CODE: 1344438
Display Dielectric Material Market By Technology (LCD, LED, OLED, TFT-LCD, Others), By Application (Transparent, Conventional, 3D, Flexible Display): Global Opportunity Analysis and Industry Forecast, 2023-2032
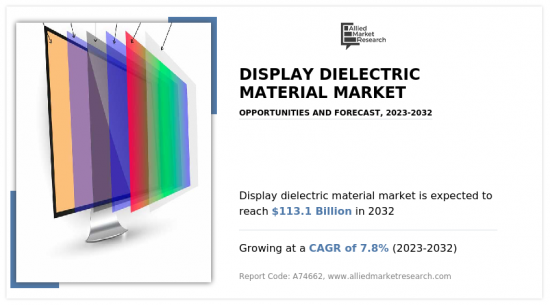
According to a new report published by Allied Market Research, titled, "Display Dielectric Material Market," The display dielectric material market was valued at $53.33 billion in 2022, and is estimated to reach $113.1 billion by 2032, growing at a CAGR of 7.8% from 2023 to 2032.
A display dielectric is used in electronic displays including liquid crystal displays (LCDs) and organic light-emitting diode (OLED) displays. Providing physical insulation for the display is the main function of the display dielectric material. Dielectric materials can store electrical energy in an electric field and have a high electrical resistance. A display's dielectric material aids in the control of the electric fields used to illuminate the pixels. This produces high-quality photos as a result.
Ceramics, liquid crystals, paper, mica, dielectric gases, etc. are some of the types of the dielectric materials. The performance requirements and manufacturing process, among other factors, influence the choice of dielectric materials used in displays. Breakdown voltage, dielectric constant, dielectric polarization, and thermal stability are the main properties of dielectric materials. Development of novel dielectric materials with enhanced capabilities to support cutting-edge display technology is the objective of dielectric materials research.
One of the key factors propelling the market for display dielectric materials is the rising demand for LCD and OLED displays. The need for dielectric materials rising along with the demand for LCDs and OLEDs. Dielectric materials are crucial in the production of LCDs, OLEDs, LEDs, and other display types. The need for dielectric materials is expanding as a result of the growing demand for high-resolution screens with accurate color and good clarity. High dielectric constant and low loss tangent dielectric materials are being used in highly sensitive and precise touch screen capacitive displays. The rising popularity of flexible screens is another factor driving the demand for dielectric materials that can resist high temperatures and provide improved insulation.
Despite the display industry's growing need for dielectric materials, some significant obstacles may restrain market expansion. The high price of dielectric materials, which can prevent their usage in mass production, is one such significant impediment. Furthermore, it is challenging to source dielectric materials with the properties required for the creation of cutting-edge display technologies.
Due to the growing need for cutting-edge displays, there are ample opportunities in the market for display dielectric materials. Dielectric materials that can endure repeated bending and stretching without losing their properties are in higher demand. The development of 5G technology, which requires the use of dielectric materials with high dielectric constant and low loss tangents, is also expected to offer ample growth opportunities. It is also anticipated that technological developments, such as the creation of energy-efficient displays, would open up new possibilities for investments in the display dielectric materials market.
The COVID-19 pandemic has had significant impact on the market for dielectric display materials. As a result of the COVID-19 outbreak's uncertainties, several businesses around the world experienced serious financial losses. The market for display dielectric materials was moderately impacted by the pandemic. Due to a drop in consumer electronics demand during the early months of the outbreak, there was less of a demand for dielectric materials. The demand for the dielectric materials used in the displays was also hampered by supply chain issues, the closure of manufacturing facilities, and a global economic recession. But due to the outbreak, many people chose to work remotely. As a result, there was a noticeable rise in the demand for smartphones and laptops. The demand for dielectric materials used in display applications consequently rose.
The key players profiled in this report include: Corning Incorporated, Merck KGaA, DuPont, SAMSUNG SDI CO., LTD., Nippon Chemical Industrial CO., LTD., SAKAI CHEMICAL INDUSTRY CO., LTD., LG Chem, DONGJIN SEMICHEM CO LTD., Nitto Denko Corporation, and ENF Technology. The market players are continuously striving to achieve an upper hand in this competitive market using strategies such as collaborations and acquisitions.
Key Benefits For Stakeholders
- This report provides a quantitative analysis of the market segments, current trends, estimations, and dynamics of the display dielectric material market analysis from 2022 to 2032 to identify the prevailing display dielectric material market opportunities.
- The market research is offered along with information related to key drivers, restraints, and opportunities.
- Porter's five forces analysis highlights the potency of buyers and suppliers to enable stakeholders make profit-oriented business decisions and strengthen their supplier-buyer network.
- In-depth analysis of the display dielectric material market segmentation assists to determine the prevailing market opportunities.
- Major countries in each region are mapped according to their revenue contribution to the global market.
- Market player positioning facilitates benchmarking and provides a clear understanding of the present position of the market players.
- The report includes the analysis of the regional as well as global display dielectric material market trends, key players, market segments, application areas, and market growth strategies.
Key Market Segments
By Technology
- LCD
- LED
- OLED
- TFT-LCD
- Others
By Application
- Transparent
- Conventional
- 3D
- Flexible Display
By Region
- North America
- U.S.
- Canada
- Mexico
- Europe
- Germany
- UK
- France
- Spain
- Italy
- Rest of Europe
- Asia-Pacific
- China
- Japan
- India
- South Korea
- Australia
- Rest of Asia-Pacific
- LAMEA
- Brazil
- United Arab Emirates
- Saudi Arabia
- South Africa
- Rest of LAMEA
Key Market Players:
- Corning Incorporated
- Merck KGaA
- DuPont
- SAMSUNG SDI CO.,LTD.
- Nippon Chemical Industrial CO., LTD.
- SAKAI CHEMICAL INDUSTRY CO.,LTD.
- LG Chem
- DONGJIN SEMICHEM CO LTD.
- Nitto Denko Corporation
- ENF Technology
TABLE OF CONTENTS
CHAPTER 1: INTRODUCTION
- 1.1. Report description
- 1.2. Key market segments
- 1.3. Key benefits to the stakeholders
- 1.4. Research Methodology
- 1.4.1. Primary research
- 1.4.2. Secondary research
- 1.4.3. Analyst tools and models
CHAPTER 2: EXECUTIVE SUMMARY
- 2.1. CXO Perspective
CHAPTER 3: MARKET OVERVIEW
- 3.1. Market definition and scope
- 3.2. Key findings
- 3.2.1. Top impacting factors
- 3.2.2. Top investment pockets
- 3.3. Porter's five forces analysis
- 3.4. Market dynamics
- 3.4.1. Drivers
- 3.4.2. Restraints
- 3.4.3. Opportunities
- 3.5. COVID-19 Impact Analysis on the market
- 3.6. Brand Share Analysis
- 3.7. Key Regulation Analysis
- 3.8. Market Share Analysis
- 3.9. Patent Landscape
- 3.10. Regulatory Guidelines
- 3.11. Value Chain Analysis
CHAPTER 4: DISPLAY DIELECTRIC MATERIAL MARKET, BY TECHNOLOGY
- 4.1. Overview
- 4.1.1. Market size and forecast
- 4.2. LCD
- 4.2.1. Key market trends, growth factors and opportunities
- 4.2.2. Market size and forecast, by region
- 4.2.3. Market share analysis by country
- 4.3. LED
- 4.3.1. Key market trends, growth factors and opportunities
- 4.3.2. Market size and forecast, by region
- 4.3.3. Market share analysis by country
- 4.4. OLED
- 4.4.1. Key market trends, growth factors and opportunities
- 4.4.2. Market size and forecast, by region
- 4.4.3. Market share analysis by country
- 4.5. TFT-LCD
- 4.5.1. Key market trends, growth factors and opportunities
- 4.5.2. Market size and forecast, by region
- 4.5.3. Market share analysis by country
- 4.6. Others
- 4.6.1. Key market trends, growth factors and opportunities
- 4.6.2. Market size and forecast, by region
- 4.6.3. Market share analysis by country
CHAPTER 5: DISPLAY DIELECTRIC MATERIAL MARKET, BY APPLICATION
- 5.1. Overview
- 5.1.1. Market size and forecast
- 5.2. Transparent
- 5.2.1. Key market trends, growth factors and opportunities
- 5.2.2. Market size and forecast, by region
- 5.2.3. Market share analysis by country
- 5.3. Conventional
- 5.3.1. Key market trends, growth factors and opportunities
- 5.3.2. Market size and forecast, by region
- 5.3.3. Market share analysis by country
- 5.4. 3D
- 5.4.1. Key market trends, growth factors and opportunities
- 5.4.2. Market size and forecast, by region
- 5.4.3. Market share analysis by country
- 5.5. Flexible Display
- 5.5.1. Key market trends, growth factors and opportunities
- 5.5.2. Market size and forecast, by region
- 5.5.3. Market share analysis by country
CHAPTER 6: DISPLAY DIELECTRIC MATERIAL MARKET, BY REGION
- 6.1. Overview
- 6.1.1. Market size and forecast By Region
- 6.2. North America
- 6.2.1. Key trends and opportunities
- 6.2.2. Market size and forecast, by Technology
- 6.2.3. Market size and forecast, by Application
- 6.2.4. Market size and forecast, by country
- 6.2.4.1. U.S.
- 6.2.4.1.1. Key market trends, growth factors and opportunities
- 6.2.4.1.2. Market size and forecast, by Technology
- 6.2.4.1.3. Market size and forecast, by Application
- 6.2.4.2. Canada
- 6.2.4.2.1. Key market trends, growth factors and opportunities
- 6.2.4.2.2. Market size and forecast, by Technology
- 6.2.4.2.3. Market size and forecast, by Application
- 6.2.4.3. Mexico
- 6.2.4.3.1. Key market trends, growth factors and opportunities
- 6.2.4.3.2. Market size and forecast, by Technology
- 6.2.4.3.3. Market size and forecast, by Application
- 6.3. Europe
- 6.3.1. Key trends and opportunities
- 6.3.2. Market size and forecast, by Technology
- 6.3.3. Market size and forecast, by Application
- 6.3.4. Market size and forecast, by country
- 6.3.4.1. Germany
- 6.3.4.1.1. Key market trends, growth factors and opportunities
- 6.3.4.1.2. Market size and forecast, by Technology
- 6.3.4.1.3. Market size and forecast, by Application
- 6.3.4.2. UK
- 6.3.4.2.1. Key market trends, growth factors and opportunities
- 6.3.4.2.2. Market size and forecast, by Technology
- 6.3.4.2.3. Market size and forecast, by Application
- 6.3.4.3. France
- 6.3.4.3.1. Key market trends, growth factors and opportunities
- 6.3.4.3.2. Market size and forecast, by Technology
- 6.3.4.3.3. Market size and forecast, by Application
- 6.3.4.4. Spain
- 6.3.4.4.1. Key market trends, growth factors and opportunities
- 6.3.4.4.2. Market size and forecast, by Technology
- 6.3.4.4.3. Market size and forecast, by Application
- 6.3.4.5. Italy
- 6.3.4.5.1. Key market trends, growth factors and opportunities
- 6.3.4.5.2. Market size and forecast, by Technology
- 6.3.4.5.3. Market size and forecast, by Application
- 6.3.4.6. Rest of Europe
- 6.3.4.6.1. Key market trends, growth factors and opportunities
- 6.3.4.6.2. Market size and forecast, by Technology
- 6.3.4.6.3. Market size and forecast, by Application
- 6.4. Asia-Pacific
- 6.4.1. Key trends and opportunities
- 6.4.2. Market size and forecast, by Technology
- 6.4.3. Market size and forecast, by Application
- 6.4.4. Market size and forecast, by country
- 6.4.4.1. China
- 6.4.4.1.1. Key market trends, growth factors and opportunities
- 6.4.4.1.2. Market size and forecast, by Technology
- 6.4.4.1.3. Market size and forecast, by Application
- 6.4.4.2. Japan
- 6.4.4.2.1. Key market trends, growth factors and opportunities
- 6.4.4.2.2. Market size and forecast, by Technology
- 6.4.4.2.3. Market size and forecast, by Application
- 6.4.4.3. India
- 6.4.4.3.1. Key market trends, growth factors and opportunities
- 6.4.4.3.2. Market size and forecast, by Technology
- 6.4.4.3.3. Market size and forecast, by Application
- 6.4.4.4. South Korea
- 6.4.4.4.1. Key market trends, growth factors and opportunities
- 6.4.4.4.2. Market size and forecast, by Technology
- 6.4.4.4.3. Market size and forecast, by Application
- 6.4.4.5. Australia
- 6.4.4.5.1. Key market trends, growth factors and opportunities
- 6.4.4.5.2. Market size and forecast, by Technology
- 6.4.4.5.3. Market size and forecast, by Application
- 6.4.4.6. Rest of Asia-Pacific
- 6.4.4.6.1. Key market trends, growth factors and opportunities
- 6.4.4.6.2. Market size and forecast, by Technology
- 6.4.4.6.3. Market size and forecast, by Application
- 6.5. LAMEA
- 6.5.1. Key trends and opportunities
- 6.5.2. Market size and forecast, by Technology
- 6.5.3. Market size and forecast, by Application
- 6.5.4. Market size and forecast, by country
- 6.5.4.1. Brazil
- 6.5.4.1.1. Key market trends, growth factors and opportunities
- 6.5.4.1.2. Market size and forecast, by Technology
- 6.5.4.1.3. Market size and forecast, by Application
- 6.5.4.2. United Arab Emirates
- 6.5.4.2.1. Key market trends, growth factors and opportunities
- 6.5.4.2.2. Market size and forecast, by Technology
- 6.5.4.2.3. Market size and forecast, by Application
- 6.5.4.3. Saudi Arabia
- 6.5.4.3.1. Key market trends, growth factors and opportunities
- 6.5.4.3.2. Market size and forecast, by Technology
- 6.5.4.3.3. Market size and forecast, by Application
- 6.5.4.4. South Africa
- 6.5.4.4.1. Key market trends, growth factors and opportunities
- 6.5.4.4.2. Market size and forecast, by Technology
- 6.5.4.4.3. Market size and forecast, by Application
- 6.5.4.5. Rest of LAMEA
- 6.5.4.5.1. Key market trends, growth factors and opportunities
- 6.5.4.5.2. Market size and forecast, by Technology
- 6.5.4.5.3. Market size and forecast, by Application
CHAPTER 7: COMPETITIVE LANDSCAPE
- 7.1. Introduction
- 7.2. Top winning strategies
- 7.3. Product Mapping of Top 10 Player
- 7.4. Competitive Dashboard
- 7.5. Competitive Heatmap
- 7.6. Top player positioning, 2022
CHAPTER 8: COMPANY PROFILES
- 8.1. Corning Incorporated
- 8.1.1. Company overview
- 8.1.2. Key Executives
- 8.1.3. Company snapshot
- 8.2. Merck KGaA
- 8.2.1. Company overview
- 8.2.2. Key Executives
- 8.2.3. Company snapshot
- 8.3. DuPont
- 8.3.1. Company overview
- 8.3.2. Key Executives
- 8.3.3. Company snapshot
- 8.4. SAMSUNG SDI CO.,LTD.
- 8.4.1. Company overview
- 8.4.2. Key Executives
- 8.4.3. Company snapshot
- 8.5. Nippon Chemical Industrial CO., LTD.
- 8.5.1. Company overview
- 8.5.2. Key Executives
- 8.5.3. Company snapshot
- 8.6. SAKAI CHEMICAL INDUSTRY CO.,LTD.
- 8.6.1. Company overview
- 8.6.2. Key Executives
- 8.6.3. Company snapshot
- 8.7. LG Chem
- 8.7.1. Company overview
- 8.7.2. Key Executives
- 8.7.3. Company snapshot
- 8.8. DONGJIN SEMICHEM CO LTD.
- 8.8.1. Company overview
- 8.8.2. Key Executives
- 8.8.3. Company snapshot
- 8.9. Nitto Denko Corporation
- 8.9.1. Company overview
- 8.9.2. Key Executives
- 8.9.3. Company snapshot
- 8.10. ENF Technology
- 8.10.1. Company overview
- 8.10.2. Key Executives
- 8.10.3. Company snapshot
LIST OF TABLES
- TABLE 01. GLOBAL DISPLAY DIELECTRIC MATERIAL MARKET, BY TECHNOLOGY, 2022-2032 ($BILLION)
- TABLE 02. DISPLAY DIELECTRIC MATERIAL MARKET FOR LCD, BY REGION, 2022-2032 ($BILLION)
- TABLE 03. DISPLAY DIELECTRIC MATERIAL MARKET FOR LED, BY REGION, 2022-2032 ($BILLION)
- TABLE 04. DISPLAY DIELECTRIC MATERIAL MARKET FOR OLED, BY REGION, 2022-2032 ($BILLION)
- TABLE 05. DISPLAY DIELECTRIC MATERIAL MARKET FOR TFT-LCD, BY REGION, 2022-2032 ($BILLION)
- TABLE 06. DISPLAY DIELECTRIC MATERIAL MARKET FOR OTHERS, BY REGION, 2022-2032 ($BILLION)
- TABLE 07. GLOBAL DISPLAY DIELECTRIC MATERIAL MARKET, BY APPLICATION, 2022-2032 ($BILLION)
- TABLE 08. DISPLAY DIELECTRIC MATERIAL MARKET FOR TRANSPARENT, BY REGION, 2022-2032 ($BILLION)
- TABLE 09. DISPLAY DIELECTRIC MATERIAL MARKET FOR CONVENTIONAL, BY REGION, 2022-2032 ($BILLION)
- TABLE 10. DISPLAY DIELECTRIC MATERIAL MARKET FOR 3D, BY REGION, 2022-2032 ($BILLION)
- TABLE 11. DISPLAY DIELECTRIC MATERIAL MARKET FOR FLEXIBLE DISPLAY, BY REGION, 2022-2032 ($BILLION)
- TABLE 12. DISPLAY DIELECTRIC MATERIAL MARKET, BY REGION, 2022-2032 ($BILLION)
- TABLE 13. NORTH AMERICA DISPLAY DIELECTRIC MATERIAL MARKET, BY TECHNOLOGY, 2022-2032 ($BILLION)
- TABLE 14. NORTH AMERICA DISPLAY DIELECTRIC MATERIAL MARKET, BY APPLICATION, 2022-2032 ($BILLION)
- TABLE 15. NORTH AMERICA DISPLAY DIELECTRIC MATERIAL MARKET, BY COUNTRY, 2022-2032 ($BILLION)
- TABLE 16. U.S. DISPLAY DIELECTRIC MATERIAL MARKET, BY TECHNOLOGY, 2022-2032 ($BILLION)
- TABLE 17. U.S. DISPLAY DIELECTRIC MATERIAL MARKET, BY APPLICATION, 2022-2032 ($BILLION)
- TABLE 18. CANADA DISPLAY DIELECTRIC MATERIAL MARKET, BY TECHNOLOGY, 2022-2032 ($BILLION)
- TABLE 19. CANADA DISPLAY DIELECTRIC MATERIAL MARKET, BY APPLICATION, 2022-2032 ($BILLION)
- TABLE 20. MEXICO DISPLAY DIELECTRIC MATERIAL MARKET, BY TECHNOLOGY, 2022-2032 ($BILLION)
- TABLE 21. MEXICO DISPLAY DIELECTRIC MATERIAL MARKET, BY APPLICATION, 2022-2032 ($BILLION)
- TABLE 22. EUROPE DISPLAY DIELECTRIC MATERIAL MARKET, BY TECHNOLOGY, 2022-2032 ($BILLION)
- TABLE 23. EUROPE DISPLAY DIELECTRIC MATERIAL MARKET, BY APPLICATION, 2022-2032 ($BILLION)
- TABLE 24. EUROPE DISPLAY DIELECTRIC MATERIAL MARKET, BY COUNTRY, 2022-2032 ($BILLION)
- TABLE 25. GERMANY DISPLAY DIELECTRIC MATERIAL MARKET, BY TECHNOLOGY, 2022-2032 ($BILLION)
- TABLE 26. GERMANY DISPLAY DIELECTRIC MATERIAL MARKET, BY APPLICATION, 2022-2032 ($BILLION)
- TABLE 27. UK DISPLAY DIELECTRIC MATERIAL MARKET, BY TECHNOLOGY, 2022-2032 ($BILLION)
- TABLE 28. UK DISPLAY DIELECTRIC MATERIAL MARKET, BY APPLICATION, 2022-2032 ($BILLION)
- TABLE 29. FRANCE DISPLAY DIELECTRIC MATERIAL MARKET, BY TECHNOLOGY, 2022-2032 ($BILLION)
- TABLE 30. FRANCE DISPLAY DIELECTRIC MATERIAL MARKET, BY APPLICATION, 2022-2032 ($BILLION)
- TABLE 31. SPAIN DISPLAY DIELECTRIC MATERIAL MARKET, BY TECHNOLOGY, 2022-2032 ($BILLION)
- TABLE 32. SPAIN DISPLAY DIELECTRIC MATERIAL MARKET, BY APPLICATION, 2022-2032 ($BILLION)
- TABLE 33. ITALY DISPLAY DIELECTRIC MATERIAL MARKET, BY TECHNOLOGY, 2022-2032 ($BILLION)
- TABLE 34. ITALY DISPLAY DIELECTRIC MATERIAL MARKET, BY APPLICATION, 2022-2032 ($BILLION)
- TABLE 35. REST OF EUROPE DISPLAY DIELECTRIC MATERIAL MARKET, BY TECHNOLOGY, 2022-2032 ($BILLION)
- TABLE 36. REST OF EUROPE DISPLAY DIELECTRIC MATERIAL MARKET, BY APPLICATION, 2022-2032 ($BILLION)
- TABLE 37. ASIA-PACIFIC DISPLAY DIELECTRIC MATERIAL MARKET, BY TECHNOLOGY, 2022-2032 ($BILLION)
- TABLE 38. ASIA-PACIFIC DISPLAY DIELECTRIC MATERIAL MARKET, BY APPLICATION, 2022-2032 ($BILLION)
- TABLE 39. ASIA-PACIFIC DISPLAY DIELECTRIC MATERIAL MARKET, BY COUNTRY, 2022-2032 ($BILLION)
- TABLE 40. CHINA DISPLAY DIELECTRIC MATERIAL MARKET, BY TECHNOLOGY, 2022-2032 ($BILLION)
- TABLE 41. CHINA DISPLAY DIELECTRIC MATERIAL MARKET, BY APPLICATION, 2022-2032 ($BILLION)
- TABLE 42. JAPAN DISPLAY DIELECTRIC MATERIAL MARKET, BY TECHNOLOGY, 2022-2032 ($BILLION)
- TABLE 43. JAPAN DISPLAY DIELECTRIC MATERIAL MARKET, BY APPLICATION, 2022-2032 ($BILLION)
- TABLE 44. INDIA DISPLAY DIELECTRIC MATERIAL MARKET, BY TECHNOLOGY, 2022-2032 ($BILLION)
- TABLE 45. INDIA DISPLAY DIELECTRIC MATERIAL MARKET, BY APPLICATION, 2022-2032 ($BILLION)
- TABLE 46. SOUTH KOREA DISPLAY DIELECTRIC MATERIAL MARKET, BY TECHNOLOGY, 2022-2032 ($BILLION)
- TABLE 47. SOUTH KOREA DISPLAY DIELECTRIC MATERIAL MARKET, BY APPLICATION, 2022-2032 ($BILLION)
- TABLE 48. AUSTRALIA DISPLAY DIELECTRIC MATERIAL MARKET, BY TECHNOLOGY, 2022-2032 ($BILLION)
- TABLE 49. AUSTRALIA DISPLAY DIELECTRIC MATERIAL MARKET, BY APPLICATION, 2022-2032 ($BILLION)
- TABLE 50. REST OF ASIA-PACIFIC DISPLAY DIELECTRIC MATERIAL MARKET, BY TECHNOLOGY, 2022-2032 ($BILLION)
- TABLE 51. REST OF ASIA-PACIFIC DISPLAY DIELECTRIC MATERIAL MARKET, BY APPLICATION, 2022-2032 ($BILLION)
- TABLE 52. LAMEA DISPLAY DIELECTRIC MATERIAL MARKET, BY TECHNOLOGY, 2022-2032 ($BILLION)
- TABLE 53. LAMEA DISPLAY DIELECTRIC MATERIAL MARKET, BY APPLICATION, 2022-2032 ($BILLION)
- TABLE 54. LAMEA DISPLAY DIELECTRIC MATERIAL MARKET, BY COUNTRY, 2022-2032 ($BILLION)
- TABLE 55. BRAZIL DISPLAY DIELECTRIC MATERIAL MARKET, BY TECHNOLOGY, 2022-2032 ($BILLION)
- TABLE 56. BRAZIL DISPLAY DIELECTRIC MATERIAL MARKET, BY APPLICATION, 2022-2032 ($BILLION)
- TABLE 57. UNITED ARAB EMIRATES DISPLAY DIELECTRIC MATERIAL MARKET, BY TECHNOLOGY, 2022-2032 ($BILLION)
- TABLE 58. UNITED ARAB EMIRATES DISPLAY DIELECTRIC MATERIAL MARKET, BY APPLICATION, 2022-2032 ($BILLION)
- TABLE 59. SAUDI ARABIA DISPLAY DIELECTRIC MATERIAL MARKET, BY TECHNOLOGY, 2022-2032 ($BILLION)
- TABLE 60. SAUDI ARABIA DISPLAY DIELECTRIC MATERIAL MARKET, BY APPLICATION, 2022-2032 ($BILLION)
- TABLE 61. SOUTH AFRICA DISPLAY DIELECTRIC MATERIAL MARKET, BY TECHNOLOGY, 2022-2032 ($BILLION)
- TABLE 62. SOUTH AFRICA DISPLAY DIELECTRIC MATERIAL MARKET, BY APPLICATION, 2022-2032 ($BILLION)
- TABLE 63. REST OF LAMEA DISPLAY DIELECTRIC MATERIAL MARKET, BY TECHNOLOGY, 2022-2032 ($BILLION)
- TABLE 64. REST OF LAMEA DISPLAY DIELECTRIC MATERIAL MARKET, BY APPLICATION, 2022-2032 ($BILLION)
- TABLE 65. CORNING INCORPORATED: KEY EXECUTIVES
- TABLE 66. CORNING INCORPORATED: COMPANY SNAPSHOT
- TABLE 67. MERCK KGAA: KEY EXECUTIVES
- TABLE 68. MERCK KGAA: COMPANY SNAPSHOT
- TABLE 69. DUPONT: KEY EXECUTIVES
- TABLE 70. DUPONT: COMPANY SNAPSHOT
- TABLE 71. SAMSUNG SDI CO.,LTD.: KEY EXECUTIVES
- TABLE 72. SAMSUNG SDI CO.,LTD.: COMPANY SNAPSHOT
- TABLE 73. NIPPON CHEMICAL INDUSTRIAL CO., LTD.: KEY EXECUTIVES
- TABLE 74. NIPPON CHEMICAL INDUSTRIAL CO., LTD.: COMPANY SNAPSHOT
- TABLE 75. SAKAI CHEMICAL INDUSTRY CO.,LTD.: KEY EXECUTIVES
- TABLE 76. SAKAI CHEMICAL INDUSTRY CO.,LTD.: COMPANY SNAPSHOT
- TABLE 77. LG CHEM: KEY EXECUTIVES
- TABLE 78. LG CHEM: COMPANY SNAPSHOT
- TABLE 79. DONGJIN SEMICHEM CO LTD.: KEY EXECUTIVES
- TABLE 80. DONGJIN SEMICHEM CO LTD.: COMPANY SNAPSHOT
- TABLE 81. NITTO DENKO CORPORATION: KEY EXECUTIVES
- TABLE 82. NITTO DENKO CORPORATION: COMPANY SNAPSHOT
- TABLE 83. ENF TECHNOLOGY: KEY EXECUTIVES
- TABLE 84. ENF TECHNOLOGY: COMPANY SNAPSHOT
LIST OF FIGURES
- FIGURE 01. DISPLAY DIELECTRIC MATERIAL MARKET, 2022-2032
- FIGURE 02. SEGMENTATION OF DISPLAY DIELECTRIC MATERIAL MARKET, 2022-2032
- FIGURE 03. TOP INVESTMENT POCKETS IN DISPLAY DIELECTRIC MATERIAL MARKET (2023-2032)
- FIGURE 04. PORTER FIVE-1
- FIGURE 05. PORTER FIVE-2
- FIGURE 06. PORTER FIVE-3
- FIGURE 07. PORTER FIVE-4
- FIGURE 08. PORTER FIVE-5
- FIGURE 09. DRIVERS, RESTRAINTS AND OPPORTUNITIES: GLOBALDISPLAY DIELECTRIC MATERIAL MARKET
- FIGURE 10. IMPACT OF KEY REGULATION: DISPLAY DIELECTRIC MATERIAL MARKET
- FIGURE 11. MARKET SHARE ANALYSIS: DISPLAY DIELECTRIC MATERIAL MARKET
- FIGURE 12. PATENT ANALYSIS BY COMPANY
- FIGURE 13. PATENT ANALYSIS BY COUNTRY
- FIGURE 14. REGULATORY GUIDELINES: DISPLAY DIELECTRIC MATERIAL MARKET
- FIGURE 15. VALUE CHAIN ANALYSIS: DISPLAY DIELECTRIC MATERIAL MARKET
- FIGURE 16. DISPLAY DIELECTRIC MATERIAL MARKET, BY TECHNOLOGY, 2022(%)
- FIGURE 17. COMPARATIVE SHARE ANALYSIS OF DISPLAY DIELECTRIC MATERIAL MARKET FOR LCD, BY COUNTRY 2022 AND 2032(%)
- FIGURE 18. COMPARATIVE SHARE ANALYSIS OF DISPLAY DIELECTRIC MATERIAL MARKET FOR LED, BY COUNTRY 2022 AND 2032(%)
- FIGURE 19. COMPARATIVE SHARE ANALYSIS OF DISPLAY DIELECTRIC MATERIAL MARKET FOR OLED, BY COUNTRY 2022 AND 2032(%)
- FIGURE 20. COMPARATIVE SHARE ANALYSIS OF DISPLAY DIELECTRIC MATERIAL MARKET FOR TFT-LCD, BY COUNTRY 2022 AND 2032(%)
- FIGURE 21. COMPARATIVE SHARE ANALYSIS OF DISPLAY DIELECTRIC MATERIAL MARKET FOR OTHERS, BY COUNTRY 2022 AND 2032(%)
- FIGURE 22. DISPLAY DIELECTRIC MATERIAL MARKET, BY APPLICATION, 2022(%)
- FIGURE 23. COMPARATIVE SHARE ANALYSIS OF DISPLAY DIELECTRIC MATERIAL MARKET FOR TRANSPARENT, BY COUNTRY 2022 AND 2032(%)
- FIGURE 24. COMPARATIVE SHARE ANALYSIS OF DISPLAY DIELECTRIC MATERIAL MARKET FOR CONVENTIONAL, BY COUNTRY 2022 AND 2032(%)
- FIGURE 25. COMPARATIVE SHARE ANALYSIS OF DISPLAY DIELECTRIC MATERIAL MARKET FOR 3D, BY COUNTRY 2022 AND 2032(%)
- FIGURE 26. COMPARATIVE SHARE ANALYSIS OF DISPLAY DIELECTRIC MATERIAL MARKET FOR FLEXIBLE DISPLAY, BY COUNTRY 2022 AND 2032(%)
- FIGURE 27. DISPLAY DIELECTRIC MATERIAL MARKET BY REGION, 2022
- FIGURE 28. U.S. DISPLAY DIELECTRIC MATERIAL MARKET, 2022-2032 ($BILLION)
- FIGURE 29. CANADA DISPLAY DIELECTRIC MATERIAL MARKET, 2022-2032 ($BILLION)
- FIGURE 30. MEXICO DISPLAY DIELECTRIC MATERIAL MARKET, 2022-2032 ($BILLION)
- FIGURE 31. GERMANY DISPLAY DIELECTRIC MATERIAL MARKET, 2022-2032 ($BILLION)
- FIGURE 32. UK DISPLAY DIELECTRIC MATERIAL MARKET, 2022-2032 ($BILLION)
- FIGURE 33. FRANCE DISPLAY DIELECTRIC MATERIAL MARKET, 2022-2032 ($BILLION)
- FIGURE 34. SPAIN DISPLAY DIELECTRIC MATERIAL MARKET, 2022-2032 ($BILLION)
- FIGURE 35. ITALY DISPLAY DIELECTRIC MATERIAL MARKET, 2022-2032 ($BILLION)
- FIGURE 36. REST OF EUROPE DISPLAY DIELECTRIC MATERIAL MARKET, 2022-2032 ($BILLION)
- FIGURE 37. CHINA DISPLAY DIELECTRIC MATERIAL MARKET, 2022-2032 ($BILLION)
- FIGURE 38. JAPAN DISPLAY DIELECTRIC MATERIAL MARKET, 2022-2032 ($BILLION)
- FIGURE 39. INDIA DISPLAY DIELECTRIC MATERIAL MARKET, 2022-2032 ($BILLION)
- FIGURE 40. SOUTH KOREA DISPLAY DIELECTRIC MATERIAL MARKET, 2022-2032 ($BILLION)
- FIGURE 41. AUSTRALIA DISPLAY DIELECTRIC MATERIAL MARKET, 2022-2032 ($BILLION)
- FIGURE 42. REST OF ASIA-PACIFIC DISPLAY DIELECTRIC MATERIAL MARKET, 2022-2032 ($BILLION)
- FIGURE 43. BRAZIL DISPLAY DIELECTRIC MATERIAL MARKET, 2022-2032 ($BILLION)
- FIGURE 44. UNITED ARAB EMIRATES DISPLAY DIELECTRIC MATERIAL MARKET, 2022-2032 ($BILLION)
- FIGURE 45. SAUDI ARABIA DISPLAY DIELECTRIC MATERIAL MARKET, 2022-2032 ($BILLION)
- FIGURE 46. SOUTH AFRICA DISPLAY DIELECTRIC MATERIAL MARKET, 2022-2032 ($BILLION)
- FIGURE 47. REST OF LAMEA DISPLAY DIELECTRIC MATERIAL MARKET, 2022-2032 ($BILLION)
- FIGURE 48. TOP WINNING STRATEGIES, BY YEAR
- FIGURE 49. TOP WINNING STRATEGIES, BY DEVELOPMENT
- FIGURE 50. TOP WINNING STRATEGIES, BY COMPANY
- FIGURE 51. PRODUCT MAPPING OF TOP 10 PLAYERS
- FIGURE 52. COMPETITIVE DASHBOARD
- FIGURE 53. COMPETITIVE HEATMAP: DISPLAY DIELECTRIC MATERIAL MARKET
- FIGURE 54. TOP PLAYER POSITIONING, 2022

