
PUBLISHER: Allied Market Research | PRODUCT CODE: 1344481

PUBLISHER: Allied Market Research | PRODUCT CODE: 1344481
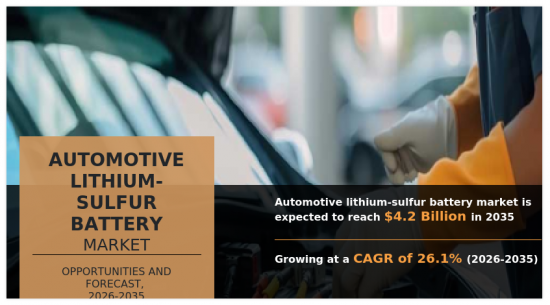
Automotive Lithium-sulfur Battery Market By Battery Capacity, By Propulsion Type, By Vehicle Type : Global Opportunity Analysis and Industry Forecast, 2026-2035
The automotive lithium-sulfur battery market is expected to experience a significant growth rate of 26.1% from 2026 to 2035 owing to growth in demand for electric vehicles, increased energy density across the globe - Allied Market Research
Various battery manufacturers, automotive OEMs (original equipment manufacturers), research institutions, and suppliers of raw materials and components are working on development of advanced automotive lithium-sulfur battery to further help in driving demand for the market. For instance, in January 2022, a team of researchers at the University of Michigan successfully developed a next-generation lithium-sulfur battery by incorporating recycled Kevlar. They have created a bio-inspired battery membrane, which allows the batteries to be charged repeatedly for commercial applications, including electric vehicles (EVs).
Factors, such as growth in demand for electric vehicles, increased energy density, and cost reduction, are anticipated to drive the market growth. However, safety concerns and limited cycle life hinder the market growth. Further, increase in investment of government association and private enterprises and research and technological advancements are some of the factors that are expected to offer lucrative opportunities for the market growth during the forecast period.
The market is segmented on the basis of battery capacity, propulsion type, vehicle type, and region. By battery capacity, it is categorized into less than 500mAh, between 501 to 1000 mAh, and more than 1000 mAh. By propulsion type, it is categorized into battery electric vehicle, hybrid electric vehicle, and plug-in hybrid electric vehicles. By vehicle type, it is categorized into two-wheeler, passenger vehicle, and commercial vehicle. Region-wise, it is analysed across North America, Europe, Asia-Pacific, and LAMEA.
The major companies profiled in the automotive lithium battery market include Giner, Inc., Ilika, Johnson Matthey, LG Chem, Lyten Inc., Morrow Batteries, NexTech Batteries, PPBC and its licensees, Sion Power Corporation, and Williams Advanced Limited.
Key Benefits For Stakeholders
- This report provides a quantitative analysis of the market segments, current trends, estimations, and dynamics of the automotive lithium-sulfur battery market analysis from 2025 to 2035 to identify the prevailing automotive lithium-sulfur battery market opportunities.
- The market research is offered along with information related to key drivers, restraints, and opportunities.
- Porter's five forces analysis highlights the potency of buyers and suppliers to enable stakeholders make profit-oriented business decisions and strengthen their supplier-buyer network.
- In-depth analysis of the automotive lithium-sulfur battery market segmentation assists to determine the prevailing market opportunities.
- Major countries in each region are mapped according to their revenue contribution to the global market.
- Market player positioning facilitates benchmarking and provides a clear understanding of the present position of the market players.
- The report includes the analysis of the regional as well as global automotive lithium-sulfur battery market trends, key players, market segments, application areas, and market growth strategies.
Key Market Segments
By Battery Capacity
- Less than 500mAh
- Between 501 to 1000 mAh
- More than 1000 mAh
By Propulsion Type
- Battery Electric Vehicle
- Hybrid Electric Vehicle
- Plug-in hybrid Electric Vehicles
By Vehicle Type
- Two-wheeler
- Passenger Vehicle
- Commercial Vehicle
By Region
- North America
- U.S.
- Canada
- Mexico
- Europe
- UK
- Germany
- Netherlands
- Norway
- Rest of Europe
- Asia-Pacific
- China
- Japan
- India
- South Korea
- Rest of Asia-Pacific
- LAMEA
- Latin America
- Middle East
- Africa
Key Market Players:
- Giner Inc.
- Ilika
- Johnson Matthey
- LG Chem
- Lyten, Inc.
- Morrow Batteries
- NexTech Batteries
- PPBC and its licensees
- Sion Power Corporation
- WAE Technologies Limited
TABLE OF CONTENTS
CHAPTER 1: INTRODUCTION
- 1.1. Report description
- 1.2. Key market segments
- 1.3. Key benefits to the stakeholders
- 1.4. Research Methodology
- 1.4.1. Primary research
- 1.4.2. Secondary research
- 1.4.3. Analyst tools and models
CHAPTER 2: EXECUTIVE SUMMARY
- 2.1. CXO Perspective
CHAPTER 3: MARKET OVERVIEW
- 3.1. Market definition and scope
- 3.2. Key findings
- 3.2.1. Top impacting factors
- 3.2.2. Top investment pockets
- 3.3. Porter's five forces analysis
- 3.3.1. Low-moderate bargaining power of suppliers
- 3.3.2. Moderate-high threat of new entrants
- 3.3.3. Low-moderate threat of substitutes
- 3.3.4. Moderate-high intensity of rivalry
- 3.3.5. Moderate bargaining power of buyers
- 3.4. Market dynamics
- 3.4.1. Drivers
- 3.4.1.1. Growth in demand for electric vehicle
- 3.4.1.2. Increased energy density
- 3.4.1.3. Cost reduction
- 3.4.1. Drivers
- 3.4.2. Restraints
- 3.4.2.1. Safety concerns
- 3.4.2.2. Limited cycle life
- 3.4.3. Opportunities
- 3.4.3.1. Increase in investment of government association and private enterprises
- 3.4.3.2. Research and technological advancements
- 3.5. COVID-19 Impact Analysis on the market
CHAPTER 4: AUTOMOTIVE LITHIUM-SULFUR BATTERY MARKET, BY BATTERY CAPACITY
- 4.1. Overview
- 4.1.1. Market size and forecast
- 4.2. Less than 500mAh
- 4.2.1. Key market trends, growth factors and opportunities
- 4.2.2. Market size and forecast, by region
- 4.2.3. Market share analysis by country
- 4.3. Between 501 to 1000 mAh
- 4.3.1. Key market trends, growth factors and opportunities
- 4.3.2. Market size and forecast, by region
- 4.3.3. Market share analysis by country
- 4.4. More than 1000 mAh
- 4.4.1. Key market trends, growth factors and opportunities
- 4.4.2. Market size and forecast, by region
- 4.4.3. Market share analysis by country
CHAPTER 5: AUTOMOTIVE LITHIUM-SULFUR BATTERY MARKET, BY PROPULSION TYPE
- 5.1. Overview
- 5.1.1. Market size and forecast
- 5.2. Battery Electric Vehicle
- 5.2.1. Key market trends, growth factors and opportunities
- 5.2.2. Market size and forecast, by region
- 5.2.3. Market share analysis by country
- 5.3. Hybrid Electric Vehicle
- 5.3.1. Key market trends, growth factors and opportunities
- 5.3.2. Market size and forecast, by region
- 5.3.3. Market share analysis by country
- 5.4. Plug-in hybrid Electric Vehicles
- 5.4.1. Key market trends, growth factors and opportunities
- 5.4.2. Market size and forecast, by region
- 5.4.3. Market share analysis by country
CHAPTER 6: AUTOMOTIVE LITHIUM-SULFUR BATTERY MARKET, BY VEHICLE TYPE
- 6.1. Overview
- 6.1.1. Market size and forecast
- 6.2. Two-wheeler
- 6.2.1. Key market trends, growth factors and opportunities
- 6.2.2. Market size and forecast, by region
- 6.2.3. Market share analysis by country
- 6.3. Passenger Vehicle
- 6.3.1. Key market trends, growth factors and opportunities
- 6.3.2. Market size and forecast, by region
- 6.3.3. Market share analysis by country
- 6.4. Commercial Vehicle
- 6.4.1. Key market trends, growth factors and opportunities
- 6.4.2. Market size and forecast, by region
- 6.4.3. Market share analysis by country
CHAPTER 7: AUTOMOTIVE LITHIUM-SULFUR BATTERY MARKET, BY REGION
- 7.1. Overview
- 7.1.1. Market size and forecast By Region
- 7.2. North America
- 7.2.1. Key trends and opportunities
- 7.2.2. Market size and forecast, by Battery Capacity
- 7.2.3. Market size and forecast, by Propulsion Type
- 7.2.4. Market size and forecast, by Vehicle Type
- 7.2.5. Market size and forecast, by country
- 7.2.5.1. U.S.
- 7.2.5.1.1. Key market trends, growth factors and opportunities
- 7.2.5.1.2. Market size and forecast, by Battery Capacity
- 7.2.5.1.3. Market size and forecast, by Propulsion Type
- 7.2.5.1.4. Market size and forecast, by Vehicle Type
- 7.2.5.2. Canada
- 7.2.5.2.1. Key market trends, growth factors and opportunities
- 7.2.5.2.2. Market size and forecast, by Battery Capacity
- 7.2.5.2.3. Market size and forecast, by Propulsion Type
- 7.2.5.2.4. Market size and forecast, by Vehicle Type
- 7.2.5.3. Mexico
- 7.2.5.3.1. Key market trends, growth factors and opportunities
- 7.2.5.3.2. Market size and forecast, by Battery Capacity
- 7.2.5.3.3. Market size and forecast, by Propulsion Type
- 7.2.5.3.4. Market size and forecast, by Vehicle Type
- 7.3. Europe
- 7.3.1. Key trends and opportunities
- 7.3.2. Market size and forecast, by Battery Capacity
- 7.3.3. Market size and forecast, by Propulsion Type
- 7.3.4. Market size and forecast, by Vehicle Type
- 7.3.5. Market size and forecast, by country
- 7.3.5.1. UK
- 7.3.5.1.1. Key market trends, growth factors and opportunities
- 7.3.5.1.2. Market size and forecast, by Battery Capacity
- 7.3.5.1.3. Market size and forecast, by Propulsion Type
- 7.3.5.1.4. Market size and forecast, by Vehicle Type
- 7.3.5.2. Germany
- 7.3.5.2.1. Key market trends, growth factors and opportunities
- 7.3.5.2.2. Market size and forecast, by Battery Capacity
- 7.3.5.2.3. Market size and forecast, by Propulsion Type
- 7.3.5.2.4. Market size and forecast, by Vehicle Type
- 7.3.5.3. Netherlands
- 7.3.5.3.1. Key market trends, growth factors and opportunities
- 7.3.5.3.2. Market size and forecast, by Battery Capacity
- 7.3.5.3.3. Market size and forecast, by Propulsion Type
- 7.3.5.3.4. Market size and forecast, by Vehicle Type
- 7.3.5.4. Norway
- 7.3.5.4.1. Key market trends, growth factors and opportunities
- 7.3.5.4.2. Market size and forecast, by Battery Capacity
- 7.3.5.4.3. Market size and forecast, by Propulsion Type
- 7.3.5.4.4. Market size and forecast, by Vehicle Type
- 7.3.5.5. Rest of Europe
- 7.3.5.5.1. Key market trends, growth factors and opportunities
- 7.3.5.5.2. Market size and forecast, by Battery Capacity
- 7.3.5.5.3. Market size and forecast, by Propulsion Type
- 7.3.5.5.4. Market size and forecast, by Vehicle Type
- 7.4. Asia-Pacific
- 7.4.1. Key trends and opportunities
- 7.4.2. Market size and forecast, by Battery Capacity
- 7.4.3. Market size and forecast, by Propulsion Type
- 7.4.4. Market size and forecast, by Vehicle Type
- 7.4.5. Market size and forecast, by country
- 7.4.5.1. China
- 7.4.5.1.1. Key market trends, growth factors and opportunities
- 7.4.5.1.2. Market size and forecast, by Battery Capacity
- 7.4.5.1.3. Market size and forecast, by Propulsion Type
- 7.4.5.1.4. Market size and forecast, by Vehicle Type
- 7.4.5.2. Japan
- 7.4.5.2.1. Key market trends, growth factors and opportunities
- 7.4.5.2.2. Market size and forecast, by Battery Capacity
- 7.4.5.2.3. Market size and forecast, by Propulsion Type
- 7.4.5.2.4. Market size and forecast, by Vehicle Type
- 7.4.5.3. India
- 7.4.5.3.1. Key market trends, growth factors and opportunities
- 7.4.5.3.2. Market size and forecast, by Battery Capacity
- 7.4.5.3.3. Market size and forecast, by Propulsion Type
- 7.4.5.3.4. Market size and forecast, by Vehicle Type
- 7.4.5.4. South Korea
- 7.4.5.4.1. Key market trends, growth factors and opportunities
- 7.4.5.4.2. Market size and forecast, by Battery Capacity
- 7.4.5.4.3. Market size and forecast, by Propulsion Type
- 7.4.5.4.4. Market size and forecast, by Vehicle Type
- 7.4.5.5. Rest of Asia-Pacific
- 7.4.5.5.1. Key market trends, growth factors and opportunities
- 7.4.5.5.2. Market size and forecast, by Battery Capacity
- 7.4.5.5.3. Market size and forecast, by Propulsion Type
- 7.4.5.5.4. Market size and forecast, by Vehicle Type
- 7.5. LAMEA
- 7.5.1. Key trends and opportunities
- 7.5.2. Market size and forecast, by Battery Capacity
- 7.5.3. Market size and forecast, by Propulsion Type
- 7.5.4. Market size and forecast, by Vehicle Type
- 7.5.5. Market size and forecast, by country
- 7.5.5.1. Latin America
- 7.5.5.1.1. Key market trends, growth factors and opportunities
- 7.5.5.1.2. Market size and forecast, by Battery Capacity
- 7.5.5.1.3. Market size and forecast, by Propulsion Type
- 7.5.5.1.4. Market size and forecast, by Vehicle Type
- 7.5.5.2. Middle East
- 7.5.5.2.1. Key market trends, growth factors and opportunities
- 7.5.5.2.2. Market size and forecast, by Battery Capacity
- 7.5.5.2.3. Market size and forecast, by Propulsion Type
- 7.5.5.2.4. Market size and forecast, by Vehicle Type
- 7.5.5.3. Africa
- 7.5.5.3.1. Key market trends, growth factors and opportunities
- 7.5.5.3.2. Market size and forecast, by Battery Capacity
- 7.5.5.3.3. Market size and forecast, by Propulsion Type
- 7.5.5.3.4. Market size and forecast, by Vehicle Type
CHAPTER 8: COMPETITIVE LANDSCAPE
- 8.1. Introduction
- 8.2. Top winning strategies
- 8.3. Product Mapping of Top 10 Player
- 8.4. Competitive Dashboard
- 8.5. Competitive Heatmap
- 8.6. Top player positioning, 2025
CHAPTER 9: COMPANY PROFILES
- 9.1. Giner Inc.
- 9.1.1. Company overview
- 9.1.2. Key Executives
- 9.1.3. Company snapshot
- 9.1.4. Operating business segments
- 9.1.5. Product portfolio
- 9.2. Ilika
- 9.2.1. Company overview
- 9.2.2. Key Executives
- 9.2.3. Company snapshot
- 9.2.4. Operating business segments
- 9.2.5. Product portfolio
- 9.2.6. Business performance
- 9.3. Johnson Matthey
- 9.3.1. Company overview
- 9.3.2. Key Executives
- 9.3.3. Company snapshot
- 9.3.4. Operating business segments
- 9.3.5. Product portfolio
- 9.3.6. Business performance
- 9.3.7. Key strategic moves and developments
- 9.4. LG Chem
- 9.4.1. Company overview
- 9.4.2. Key Executives
- 9.4.3. Company snapshot
- 9.4.4. Operating business segments
- 9.4.5. Product portfolio
- 9.4.6. Business performance
- 9.4.7. Key strategic moves and developments
- 9.5. Lyten, Inc.
- 9.5.1. Company overview
- 9.5.2. Key Executives
- 9.5.3. Company snapshot
- 9.5.4. Operating business segments
- 9.5.5. Product portfolio
- 9.5.6. Key strategic moves and developments
- 9.6. Morrow Batteries
- 9.6.1. Company overview
- 9.6.2. Key Executives
- 9.6.3. Company snapshot
- 9.6.4. Operating business segments
- 9.6.5. Product portfolio
- 9.6.6. Key strategic moves and developments
- 9.7. NexTech Batteries
- 9.7.1. Company overview
- 9.7.2. Key Executives
- 9.7.3. Company snapshot
- 9.7.4. Operating business segments
- 9.7.5. Product portfolio
- 9.7.6. Key strategic moves and developments
- 9.8. PPBC and its licensees
- 9.8.1. Company overview
- 9.8.2. Key Executives
- 9.8.3. Company snapshot
- 9.8.4. Operating business segments
- 9.8.5. Product portfolio
- 9.9. Sion Power Corporation
- 9.9.1. Company overview
- 9.9.2. Key Executives
- 9.9.3. Company snapshot
- 9.9.4. Operating business segments
- 9.9.5. Product portfolio
- 9.10. WAE Technologies Limited
- 9.10.1. Company overview
- 9.10.2. Key Executives
- 9.10.3. Company snapshot
- 9.10.4. Operating business segments
- 9.10.5. Product portfolio
LIST OF TABLES
- TABLE 01. GLOBAL AUTOMOTIVE LITHIUM-SULFUR BATTERY MARKET, BY BATTERY CAPACITY, 2025-2035 ($MILLION)
- TABLE 02. AUTOMOTIVE LITHIUM-SULFUR BATTERY MARKET FOR LESS THAN 500MAH, BY REGION, 2025-2035 ($MILLION)
- TABLE 03. AUTOMOTIVE LITHIUM-SULFUR BATTERY MARKET FOR BETWEEN 501 TO 1000 MAH, BY REGION, 2025-2035 ($MILLION)
- TABLE 04. AUTOMOTIVE LITHIUM-SULFUR BATTERY MARKET FOR MORE THAN 1000 MAH, BY REGION, 2025-2035 ($MILLION)
- TABLE 05. GLOBAL AUTOMOTIVE LITHIUM-SULFUR BATTERY MARKET, BY PROPULSION TYPE, 2025-2035 ($MILLION)
- TABLE 06. AUTOMOTIVE LITHIUM-SULFUR BATTERY MARKET FOR BATTERY ELECTRIC VEHICLE, BY REGION, 2025-2035 ($MILLION)
- TABLE 07. AUTOMOTIVE LITHIUM-SULFUR BATTERY MARKET FOR HYBRID ELECTRIC VEHICLE, BY REGION, 2025-2035 ($MILLION)
- TABLE 08. AUTOMOTIVE LITHIUM-SULFUR BATTERY MARKET FOR PLUG-IN HYBRID ELECTRIC VEHICLES, BY REGION, 2025-2035 ($MILLION)
- TABLE 09. GLOBAL AUTOMOTIVE LITHIUM-SULFUR BATTERY MARKET, BY VEHICLE TYPE, 2025-2035 ($MILLION)
- TABLE 10. AUTOMOTIVE LITHIUM-SULFUR BATTERY MARKET FOR TWO-WHEELER, BY REGION, 2025-2035 ($MILLION)
- TABLE 11. AUTOMOTIVE LITHIUM-SULFUR BATTERY MARKET FOR PASSENGER VEHICLE, BY REGION, 2025-2035 ($MILLION)
- TABLE 12. AUTOMOTIVE LITHIUM-SULFUR BATTERY MARKET FOR COMMERCIAL VEHICLE, BY REGION, 2025-2035 ($MILLION)
- TABLE 13. AUTOMOTIVE LITHIUM-SULFUR BATTERY MARKET, BY REGION, 2025-2035 ($MILLION)
- TABLE 14. NORTH AMERICA AUTOMOTIVE LITHIUM-SULFUR BATTERY MARKET, BY BATTERY CAPACITY, 2025-2035 ($MILLION)
- TABLE 15. NORTH AMERICA AUTOMOTIVE LITHIUM-SULFUR BATTERY MARKET, BY PROPULSION TYPE, 2025-2035 ($MILLION)
- TABLE 16. NORTH AMERICA AUTOMOTIVE LITHIUM-SULFUR BATTERY MARKET, BY VEHICLE TYPE, 2025-2035 ($MILLION)
- TABLE 17. NORTH AMERICA AUTOMOTIVE LITHIUM-SULFUR BATTERY MARKET, BY COUNTRY, 2025-2035 ($MILLION)
- TABLE 18. U.S. AUTOMOTIVE LITHIUM-SULFUR BATTERY MARKET, BY BATTERY CAPACITY, 2025-2035 ($MILLION)
- TABLE 19. U.S. AUTOMOTIVE LITHIUM-SULFUR BATTERY MARKET, BY PROPULSION TYPE, 2025-2035 ($MILLION)
- TABLE 20. U.S. AUTOMOTIVE LITHIUM-SULFUR BATTERY MARKET, BY VEHICLE TYPE, 2025-2035 ($MILLION)
- TABLE 21. CANADA AUTOMOTIVE LITHIUM-SULFUR BATTERY MARKET, BY BATTERY CAPACITY, 2025-2035 ($MILLION)
- TABLE 22. CANADA AUTOMOTIVE LITHIUM-SULFUR BATTERY MARKET, BY PROPULSION TYPE, 2025-2035 ($MILLION)
- TABLE 23. CANADA AUTOMOTIVE LITHIUM-SULFUR BATTERY MARKET, BY VEHICLE TYPE, 2025-2035 ($MILLION)
- TABLE 24. MEXICO AUTOMOTIVE LITHIUM-SULFUR BATTERY MARKET, BY BATTERY CAPACITY, 2025-2035 ($MILLION)
- TABLE 25. MEXICO AUTOMOTIVE LITHIUM-SULFUR BATTERY MARKET, BY PROPULSION TYPE, 2025-2035 ($MILLION)
- TABLE 26. MEXICO AUTOMOTIVE LITHIUM-SULFUR BATTERY MARKET, BY VEHICLE TYPE, 2025-2035 ($MILLION)
- TABLE 27. EUROPE AUTOMOTIVE LITHIUM-SULFUR BATTERY MARKET, BY BATTERY CAPACITY, 2025-2035 ($MILLION)
- TABLE 28. EUROPE AUTOMOTIVE LITHIUM-SULFUR BATTERY MARKET, BY PROPULSION TYPE, 2025-2035 ($MILLION)
- TABLE 29. EUROPE AUTOMOTIVE LITHIUM-SULFUR BATTERY MARKET, BY VEHICLE TYPE, 2025-2035 ($MILLION)
- TABLE 30. EUROPE AUTOMOTIVE LITHIUM-SULFUR BATTERY MARKET, BY COUNTRY, 2025-2035 ($MILLION)
- TABLE 31. UK AUTOMOTIVE LITHIUM-SULFUR BATTERY MARKET, BY BATTERY CAPACITY, 2025-2035 ($MILLION)
- TABLE 32. UK AUTOMOTIVE LITHIUM-SULFUR BATTERY MARKET, BY PROPULSION TYPE, 2025-2035 ($MILLION)
- TABLE 33. UK AUTOMOTIVE LITHIUM-SULFUR BATTERY MARKET, BY VEHICLE TYPE, 2025-2035 ($MILLION)
- TABLE 34. GERMANY AUTOMOTIVE LITHIUM-SULFUR BATTERY MARKET, BY BATTERY CAPACITY, 2025-2035 ($MILLION)
- TABLE 35. GERMANY AUTOMOTIVE LITHIUM-SULFUR BATTERY MARKET, BY PROPULSION TYPE, 2025-2035 ($MILLION)
- TABLE 36. GERMANY AUTOMOTIVE LITHIUM-SULFUR BATTERY MARKET, BY VEHICLE TYPE, 2025-2035 ($MILLION)
- TABLE 37. NETHERLANDS AUTOMOTIVE LITHIUM-SULFUR BATTERY MARKET, BY BATTERY CAPACITY, 2025-2035 ($MILLION)
- TABLE 38. NETHERLANDS AUTOMOTIVE LITHIUM-SULFUR BATTERY MARKET, BY PROPULSION TYPE, 2025-2035 ($MILLION)
- TABLE 39. NETHERLANDS AUTOMOTIVE LITHIUM-SULFUR BATTERY MARKET, BY VEHICLE TYPE, 2025-2035 ($MILLION)
- TABLE 40. NORWAY AUTOMOTIVE LITHIUM-SULFUR BATTERY MARKET, BY BATTERY CAPACITY, 2025-2035 ($MILLION)
- TABLE 41. NORWAY AUTOMOTIVE LITHIUM-SULFUR BATTERY MARKET, BY PROPULSION TYPE, 2025-2035 ($MILLION)
- TABLE 42. NORWAY AUTOMOTIVE LITHIUM-SULFUR BATTERY MARKET, BY VEHICLE TYPE, 2025-2035 ($MILLION)
- TABLE 43. REST OF EUROPE AUTOMOTIVE LITHIUM-SULFUR BATTERY MARKET, BY BATTERY CAPACITY, 2025-2035 ($MILLION)
- TABLE 44. REST OF EUROPE AUTOMOTIVE LITHIUM-SULFUR BATTERY MARKET, BY PROPULSION TYPE, 2025-2035 ($MILLION)
- TABLE 45. REST OF EUROPE AUTOMOTIVE LITHIUM-SULFUR BATTERY MARKET, BY VEHICLE TYPE, 2025-2035 ($MILLION)
- TABLE 46. ASIA-PACIFIC AUTOMOTIVE LITHIUM-SULFUR BATTERY MARKET, BY BATTERY CAPACITY, 2025-2035 ($MILLION)
- TABLE 47. ASIA-PACIFIC AUTOMOTIVE LITHIUM-SULFUR BATTERY MARKET, BY PROPULSION TYPE, 2025-2035 ($MILLION)
- TABLE 48. ASIA-PACIFIC AUTOMOTIVE LITHIUM-SULFUR BATTERY MARKET, BY VEHICLE TYPE, 2025-2035 ($MILLION)
- TABLE 49. ASIA-PACIFIC AUTOMOTIVE LITHIUM-SULFUR BATTERY MARKET, BY COUNTRY, 2025-2035 ($MILLION)
- TABLE 50. CHINA AUTOMOTIVE LITHIUM-SULFUR BATTERY MARKET, BY BATTERY CAPACITY, 2025-2035 ($MILLION)
- TABLE 51. CHINA AUTOMOTIVE LITHIUM-SULFUR BATTERY MARKET, BY PROPULSION TYPE, 2025-2035 ($MILLION)
- TABLE 52. CHINA AUTOMOTIVE LITHIUM-SULFUR BATTERY MARKET, BY VEHICLE TYPE, 2025-2035 ($MILLION)
- TABLE 53. JAPAN AUTOMOTIVE LITHIUM-SULFUR BATTERY MARKET, BY BATTERY CAPACITY, 2025-2035 ($MILLION)
- TABLE 54. JAPAN AUTOMOTIVE LITHIUM-SULFUR BATTERY MARKET, BY PROPULSION TYPE, 2025-2035 ($MILLION)
- TABLE 55. JAPAN AUTOMOTIVE LITHIUM-SULFUR BATTERY MARKET, BY VEHICLE TYPE, 2025-2035 ($MILLION)
- TABLE 56. INDIA AUTOMOTIVE LITHIUM-SULFUR BATTERY MARKET, BY BATTERY CAPACITY, 2025-2035 ($MILLION)
- TABLE 57. INDIA AUTOMOTIVE LITHIUM-SULFUR BATTERY MARKET, BY PROPULSION TYPE, 2025-2035 ($MILLION)
- TABLE 58. INDIA AUTOMOTIVE LITHIUM-SULFUR BATTERY MARKET, BY VEHICLE TYPE, 2025-2035 ($MILLION)
- TABLE 59. SOUTH KOREA AUTOMOTIVE LITHIUM-SULFUR BATTERY MARKET, BY BATTERY CAPACITY, 2025-2035 ($MILLION)
- TABLE 60. SOUTH KOREA AUTOMOTIVE LITHIUM-SULFUR BATTERY MARKET, BY PROPULSION TYPE, 2025-2035 ($MILLION)
- TABLE 61. SOUTH KOREA AUTOMOTIVE LITHIUM-SULFUR BATTERY MARKET, BY VEHICLE TYPE, 2025-2035 ($MILLION)
- TABLE 62. REST OF ASIA-PACIFIC AUTOMOTIVE LITHIUM-SULFUR BATTERY MARKET, BY BATTERY CAPACITY, 2025-2035 ($MILLION)
- TABLE 63. REST OF ASIA-PACIFIC AUTOMOTIVE LITHIUM-SULFUR BATTERY MARKET, BY PROPULSION TYPE, 2025-2035 ($MILLION)
- TABLE 64. REST OF ASIA-PACIFIC AUTOMOTIVE LITHIUM-SULFUR BATTERY MARKET, BY VEHICLE TYPE, 2025-2035 ($MILLION)
- TABLE 65. LAMEA AUTOMOTIVE LITHIUM-SULFUR BATTERY MARKET, BY BATTERY CAPACITY, 2025-2035 ($MILLION)
- TABLE 66. LAMEA AUTOMOTIVE LITHIUM-SULFUR BATTERY MARKET, BY PROPULSION TYPE, 2025-2035 ($MILLION)
- TABLE 67. LAMEA AUTOMOTIVE LITHIUM-SULFUR BATTERY MARKET, BY VEHICLE TYPE, 2025-2035 ($MILLION)
- TABLE 68. LAMEA AUTOMOTIVE LITHIUM-SULFUR BATTERY MARKET, BY COUNTRY, 2025-2035 ($MILLION)
- TABLE 69. LATIN AMERICA AUTOMOTIVE LITHIUM-SULFUR BATTERY MARKET, BY BATTERY CAPACITY, 2025-2035 ($MILLION)
- TABLE 70. LATIN AMERICA AUTOMOTIVE LITHIUM-SULFUR BATTERY MARKET, BY PROPULSION TYPE, 2025-2035 ($MILLION)
- TABLE 71. LATIN AMERICA AUTOMOTIVE LITHIUM-SULFUR BATTERY MARKET, BY VEHICLE TYPE, 2025-2035 ($MILLION)
- TABLE 72. MIDDLE EAST AUTOMOTIVE LITHIUM-SULFUR BATTERY MARKET, BY BATTERY CAPACITY, 2025-2035 ($MILLION)
- TABLE 73. MIDDLE EAST AUTOMOTIVE LITHIUM-SULFUR BATTERY MARKET, BY PROPULSION TYPE, 2025-2035 ($MILLION)
- TABLE 74. MIDDLE EAST AUTOMOTIVE LITHIUM-SULFUR BATTERY MARKET, BY VEHICLE TYPE, 2025-2035 ($MILLION)
- TABLE 75. AFRICA AUTOMOTIVE LITHIUM-SULFUR BATTERY MARKET, BY BATTERY CAPACITY, 2025-2035 ($MILLION)
- TABLE 76. AFRICA AUTOMOTIVE LITHIUM-SULFUR BATTERY MARKET, BY PROPULSION TYPE, 2025-2035 ($MILLION)
- TABLE 77. AFRICA AUTOMOTIVE LITHIUM-SULFUR BATTERY MARKET, BY VEHICLE TYPE, 2025-2035 ($MILLION)
- TABLE 78. GINER INC.: KEY EXECUTIVES
- TABLE 79. GINER INC.: COMPANY SNAPSHOT
- TABLE 80. GINER INC.: PRODUCT SEGMENTS
- TABLE 81. GINER INC.: PRODUCT PORTFOLIO
- TABLE 82. ILIKA: KEY EXECUTIVES
- TABLE 83. ILIKA: COMPANY SNAPSHOT
- TABLE 84. ILIKA: PRODUCT SEGMENTS
- TABLE 85. ILIKA: PRODUCT PORTFOLIO
- TABLE 86. JOHNSON MATTHEY: KEY EXECUTIVES
- TABLE 87. JOHNSON MATTHEY: COMPANY SNAPSHOT
- TABLE 88. JOHNSON MATTHEY: PRODUCT SEGMENTS
- TABLE 89. JOHNSON MATTHEY: PRODUCT PORTFOLIO
- TABLE 90. JOHNSON MATTHEY: KEY STRATERGIES
- TABLE 91. LG CHEM: KEY EXECUTIVES
- TABLE 92. LG CHEM: COMPANY SNAPSHOT
- TABLE 93. LG CHEM: PRODUCT SEGMENTS
- TABLE 94. LG CHEM: PRODUCT PORTFOLIO
- TABLE 95. LG CHEM: KEY STRATERGIES
- TABLE 96. LYTEN, INC.: KEY EXECUTIVES
- TABLE 97. LYTEN, INC.: COMPANY SNAPSHOT
- TABLE 98. LYTEN, INC.: PRODUCT SEGMENTS
- TABLE 99. LYTEN, INC.: PRODUCT PORTFOLIO
- TABLE 100. LYTEN, INC.: KEY STRATERGIES
- TABLE 101. MORROW BATTERIES: KEY EXECUTIVES
- TABLE 102. MORROW BATTERIES: COMPANY SNAPSHOT
- TABLE 103. MORROW BATTERIES: PRODUCT SEGMENTS
- TABLE 104. MORROW BATTERIES: PRODUCT PORTFOLIO
- TABLE 105. MORROW BATTERIES: KEY STRATERGIES
- TABLE 106. NEXTECH BATTERIES: KEY EXECUTIVES
- TABLE 107. NEXTECH BATTERIES: COMPANY SNAPSHOT
- TABLE 108. NEXTECH BATTERIES: PRODUCT SEGMENTS
- TABLE 109. NEXTECH BATTERIES: PRODUCT PORTFOLIO
- TABLE 110. NEXTECH BATTERIES: KEY STRATERGIES
- TABLE 111. PPBC AND ITS LICENSEES: KEY EXECUTIVES
- TABLE 112. PPBC AND ITS LICENSEES: COMPANY SNAPSHOT
- TABLE 113. PPBC AND ITS LICENSEES: PRODUCT SEGMENTS
- TABLE 114. PPBC AND ITS LICENSEES: PRODUCT PORTFOLIO
- TABLE 115. SION POWER CORPORATION: KEY EXECUTIVES
- TABLE 116. SION POWER CORPORATION: COMPANY SNAPSHOT
- TABLE 117. SION POWER CORPORATION: PRODUCT SEGMENTS
- TABLE 118. SION POWER CORPORATION: PRODUCT PORTFOLIO
- TABLE 119. WAE TECHNOLOGIES LIMITED: KEY EXECUTIVES
- TABLE 120. WAE TECHNOLOGIES LIMITED: COMPANY SNAPSHOT
- TABLE 121. WAE TECHNOLOGIES LIMITED: PRODUCT SEGMENTS
- TABLE 122. WAE TECHNOLOGIES LIMITED: PRODUCT PORTFOLIO
LIST OF FIGURES
- FIGURE 01. AUTOMOTIVE LITHIUM-SULFUR BATTERY MARKET, 2025-2035
- FIGURE 02. SEGMENTATION OF AUTOMOTIVE LITHIUM-SULFUR BATTERY MARKET, 2025-2035
- FIGURE 03. TOP INVESTMENT POCKETS IN AUTOMOTIVE LITHIUM-SULFUR BATTERY MARKET (2026-2035)
- FIGURE 04. LOW-MODERATE BARGAINING POWER OF SUPPLIERS
- FIGURE 05. MODERATE-HIGH THREAT OF NEW ENTRANTS
- FIGURE 06. LOW-MODERATE THREAT OF SUBSTITUTES
- FIGURE 07. MODERATE-HIGH INTENSITY OF RIVALRY
- FIGURE 08. MODERATE BARGAINING POWER OF BUYERS
- FIGURE 09. DRIVERS, RESTRAINTS AND OPPORTUNITIES: GLOBALAUTOMOTIVE LITHIUM-SULFUR BATTERY MARKET
- FIGURE 09. AUTOMOTIVE LITHIUM-SULFUR BATTERY MARKET, BY BATTERY CAPACITY, 2025(%)
- FIGURE 10. COMPARATIVE SHARE ANALYSIS OF AUTOMOTIVE LITHIUM-SULFUR BATTERY MARKET FOR LESS THAN 500MAH, BY COUNTRY 2025 AND 2035(%)
- FIGURE 11. COMPARATIVE SHARE ANALYSIS OF AUTOMOTIVE LITHIUM-SULFUR BATTERY MARKET FOR BETWEEN 501 TO 1000 MAH, BY COUNTRY 2025 AND 2035(%)
- FIGURE 12. COMPARATIVE SHARE ANALYSIS OF AUTOMOTIVE LITHIUM-SULFUR BATTERY MARKET FOR MORE THAN 1000 MAH, BY COUNTRY 2025 AND 2035(%)
- FIGURE 13. AUTOMOTIVE LITHIUM-SULFUR BATTERY MARKET, BY PROPULSION TYPE, 2025(%)
- FIGURE 14. COMPARATIVE SHARE ANALYSIS OF AUTOMOTIVE LITHIUM-SULFUR BATTERY MARKET FOR BATTERY ELECTRIC VEHICLE, BY COUNTRY 2025 AND 2035(%)
- FIGURE 15. COMPARATIVE SHARE ANALYSIS OF AUTOMOTIVE LITHIUM-SULFUR BATTERY MARKET FOR HYBRID ELECTRIC VEHICLE, BY COUNTRY 2025 AND 2035(%)
- FIGURE 16. COMPARATIVE SHARE ANALYSIS OF AUTOMOTIVE LITHIUM-SULFUR BATTERY MARKET FOR PLUG-IN HYBRID ELECTRIC VEHICLES, BY COUNTRY 2025 AND 2035(%)
- FIGURE 17. AUTOMOTIVE LITHIUM-SULFUR BATTERY MARKET, BY VEHICLE TYPE, 2025(%)
- FIGURE 18. COMPARATIVE SHARE ANALYSIS OF AUTOMOTIVE LITHIUM-SULFUR BATTERY MARKET FOR TWO-WHEELER, BY COUNTRY 2025 AND 2035(%)
- FIGURE 19. COMPARATIVE SHARE ANALYSIS OF AUTOMOTIVE LITHIUM-SULFUR BATTERY MARKET FOR PASSENGER VEHICLE, BY COUNTRY 2025 AND 2035(%)
- FIGURE 20. COMPARATIVE SHARE ANALYSIS OF AUTOMOTIVE LITHIUM-SULFUR BATTERY MARKET FOR COMMERCIAL VEHICLE, BY COUNTRY 2025 AND 2035(%)
- FIGURE 21. AUTOMOTIVE LITHIUM-SULFUR BATTERY MARKET BY REGION, 2025
- FIGURE 22. U.S. AUTOMOTIVE LITHIUM-SULFUR BATTERY MARKET, 2025-2035 ($MILLION)
- FIGURE 23. CANADA AUTOMOTIVE LITHIUM-SULFUR BATTERY MARKET, 2025-2035 ($MILLION)
- FIGURE 24. MEXICO AUTOMOTIVE LITHIUM-SULFUR BATTERY MARKET, 2025-2035 ($MILLION)
- FIGURE 25. UK AUTOMOTIVE LITHIUM-SULFUR BATTERY MARKET, 2025-2035 ($MILLION)
- FIGURE 26. GERMANY AUTOMOTIVE LITHIUM-SULFUR BATTERY MARKET, 2025-2035 ($MILLION)
- FIGURE 27. NETHERLANDS AUTOMOTIVE LITHIUM-SULFUR BATTERY MARKET, 2025-2035 ($MILLION)
- FIGURE 28. NORWAY AUTOMOTIVE LITHIUM-SULFUR BATTERY MARKET, 2025-2035 ($MILLION)
- FIGURE 29. REST OF EUROPE AUTOMOTIVE LITHIUM-SULFUR BATTERY MARKET, 2025-2035 ($MILLION)
- FIGURE 30. CHINA AUTOMOTIVE LITHIUM-SULFUR BATTERY MARKET, 2025-2035 ($MILLION)
- FIGURE 31. JAPAN AUTOMOTIVE LITHIUM-SULFUR BATTERY MARKET, 2025-2035 ($MILLION)
- FIGURE 32. INDIA AUTOMOTIVE LITHIUM-SULFUR BATTERY MARKET, 2025-2035 ($MILLION)
- FIGURE 33. SOUTH KOREA AUTOMOTIVE LITHIUM-SULFUR BATTERY MARKET, 2025-2035 ($MILLION)
- FIGURE 34. REST OF ASIA-PACIFIC AUTOMOTIVE LITHIUM-SULFUR BATTERY MARKET, 2025-2035 ($MILLION)
- FIGURE 35. LATIN AMERICA AUTOMOTIVE LITHIUM-SULFUR BATTERY MARKET, 2025-2035 ($MILLION)
- FIGURE 36. MIDDLE EAST AUTOMOTIVE LITHIUM-SULFUR BATTERY MARKET, 2025-2035 ($MILLION)
- FIGURE 37. AFRICA AUTOMOTIVE LITHIUM-SULFUR BATTERY MARKET, 2025-2035 ($MILLION)
- FIGURE 38. TOP WINNING STRATEGIES, BY YEAR
- FIGURE 39. TOP WINNING STRATEGIES, BY DEVELOPMENT
- FIGURE 40. TOP WINNING STRATEGIES, BY COMPANY
- FIGURE 41. PRODUCT MAPPING OF TOP 10 PLAYERS
- FIGURE 42. COMPETITIVE DASHBOARD
- FIGURE 43. COMPETITIVE HEATMAP: AUTOMOTIVE LITHIUM-SULFUR BATTERY MARKET
- FIGURE 44. TOP PLAYER POSITIONING, 2025
- FIGURE 45. ILIKA: RESEARCH & DEVELOPMENT EXPENDITURE, 2019-2021 ($MILLION)
- FIGURE 46. ILIKA: NET SALES, 2019-2021 ($MILLION)
- FIGURE 47. ILIKA: REVENUE SHARE BY REGION, 2021 (%)
- FIGURE 48. ILIKA: REVENUE SHARE BY SEGMENT, 2022 (%)
- FIGURE 49. JOHNSON MATTHEY: NET REVENUE, 2020-2022 ($MILLION)
- FIGURE 50. JOHNSON MATTHEY: RESEARCH & DEVELOPMENT EXPENDITURE, 2020-2022 ($MILLION)
- FIGURE 51. JOHNSON MATTHEY: REVENUE SHARE BY SEGMENT, 2022 (%)
- FIGURE 52. LG CHEM: RESEARCH & DEVELOPMENT EXPENDITURE, 2020-2022 ($MILLION)
- FIGURE 53. LG CHEM: NET SALES, 2020-2022 ($MILLION)
- FIGURE 54. LG CHEM: REVENUE SHARE BY SEGMENT, 2022 (%)
- FIGURE 55. LG CHEM: REVENUE SHARE BY REGION, 2021 (%)

