
PUBLISHER: Allied Market Research | PRODUCT CODE: 1344531

PUBLISHER: Allied Market Research | PRODUCT CODE: 1344531
Water Treatment Equipment Market By Type, By End-use Industry : Global Opportunity Analysis and Industry Forecast, 2023-2032
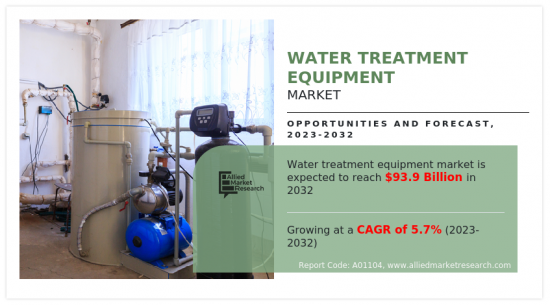
According to a new report published by Allied Market Research, titled, "Water Treatment Equipment Market," The water treatment equipment market was valued at $54.3 billion in 2022, and is estimated to reach $93.9 billion by 2032, growing at a CAGR of 5.7% from 2023 to 2032.
Water treatment equipment treats the wastewater and removes the pollutants making it safer to release to the environment. The report focuses on various types and end-user industry, which include municipal and industrial. Growth in demand for clean water for municipal applications and demand for water for power generation is expected to boost the growth. The rise in awareness of effective waste disposal for animal and human health has resulted in the introduction of various disposal systems and procedures. Waste management organizations are required to dispose of or recycle waste on time owing to the presence of huge amounts of harmful substances in the garbage, such as metals and salts.
The rise in global population and industrialization along with changing laws on water treatment in industries and other sectors drive the global water treatment industry. Urbanization of population during the forecast period lead to an increase in demand for water treatment plants at municipal levels. In some regions, wastewater is already a common water source as safer water sources are not available. In addition, treated wastewater is increasingly being used in agricultural irrigation. A major hindrance to the growth of the global wastewater treatment equipment market is the high upfront and operational costs involved in wastewater treatment plants. However, global water scarcity is expected to be a reality in the coming years as a result of which the capacity to treat wastewater and reuse the same has to be increased. Most population growth occurs in developing countries, mainly in regions that are already experiencing water stress and in areas with limited access to safe drinking water and adequate sanitation facilities. The development of advanced energy efficient water treatment technologies is expected to benefit the market growth in the long run. Therefore, the need for achieving better water treatment rates is projected to offer lucrative opportunities for the global water treatment equipment market growth.
The water treatment equipment market is segmented on the basis of type, end-use industry, and region. On the basis of type, the market is classified into process equipment, mud treatment, filtration systems & media, disinfection, diversions & screens, meters, membranes, and others. On the basis of end-use industry, the market is bifurcated into industrial and municipal. The industrial segment is further segmented into process water treatment, wastewater treatment, and sludge treatment. Moreover, the Municipal segment is further fragmented into process water treatment, wastewater treatment, and sludge treatment. On the basis of region, the market is analyzed across North America, Europe, Asia-Pacific, and LAMEA.
The major players operating in the industry include Calgon Carbon Corporation, Culligan Water, Ecolab, General Electric, Hydranautics, Pentair, Lenntech B.V., Suez, Veolia, and Xylem. These players have adopted product launches as their key strategy to increase their market shares.
Key Benefits For Stakeholders
- This report provides a quantitative analysis of the market segments, current trends, estimations, and dynamics of the water treatment equipment market analysis from 2022 to 2032 to identify the prevailing water treatment equipment market opportunities.
- The market research is offered along with information related to key drivers, restraints, and opportunities.
- Porter's five forces analysis highlights the potency of buyers and suppliers to enable stakeholders make profit-oriented business decisions and strengthen their supplier-buyer network.
- In-depth analysis of the water treatment equipment market segmentation assists to determine the prevailing market opportunities.
- Major countries in each region are mapped according to their revenue contribution to the global market.
- Market player positioning facilitates benchmarking and provides a clear understanding of the present position of the market players.
- The report includes the analysis of the regional as well as global water treatment equipment market trends, key players, market segments, application areas, and market growth strategies.
Key Market Segments
By Type
- Process Equipment
- Mud Treatment
- Filtration Systems and Media
- Disinfection
- Diversions and Screens
- Meters
- Membranes
- Others
By End-use Industry
- Industrial Water Treatment Equipment
- Municipal Water Treatment Equipment
By Region
- North America
- U.S.
- Canada
- Mexico
- Europe
- Germany
- France
- UK
- Italy
- Spain
- Rest of Europe
- Asia-Pacific
- China
- India
- Japan
- South Korea
- Australia
- Rest of Asia-Pacific
- LAMEA
- Brazil
- Saudi Arabia
- South Africa
- UAE
- Rest of LAMEA
Key Market Players:
- Calgon Carbon Corporation
- Culligan Water
- Ecolab
- General Electric
- Hydranautics
- Lenntech B.V.
- Pentair
- Suez
- Veolia
- Xylem
TABLE OF CONTENTS
CHAPTER 1: INTRODUCTION
- 1.1. Report description
- 1.2. Key market segments
- 1.3. Key benefits to the stakeholders
- 1.4. Research Methodology
- 1.4.1. Primary research
- 1.4.2. Secondary research
- 1.4.3. Analyst tools and models
CHAPTER 2: EXECUTIVE SUMMARY
- 2.1. CXO Perspective
CHAPTER 3: MARKET OVERVIEW
- 3.1. Market definition and scope
- 3.2. Key findings
- 3.2.1. Top impacting factors
- 3.2.2. Top investment pockets
- 3.3. Porter's five forces analysis
- 3.3.1. Low bargaining power of suppliers
- 3.3.2. Low threat of new entrants
- 3.3.3. Low threat of substitutes
- 3.3.4. Low intensity of rivalry
- 3.3.5. Low bargaining power of buyers
- 3.4. Market dynamics
- 3.4.1. Drivers
- 3.4.1.1. Increase in industrial water discharge
- 3.4.1.2. Increase in investments in wastewater treatment facilities.
- 3.4.1. Drivers
- 3.4.2. Restraints
- 3.4.2.1. High equipment cost
- 3.4.3. Opportunities
- 3.4.3.1. Surge in demand for energy-efficient technologies
- 3.5. COVID-19 Impact Analysis on the market
- 3.6. Regulatory Guidelines
- 3.7. Patent Landscape
- 3.8. Pricing Analysis
CHAPTER 4: WATER TREATMENT EQUIPMENT MARKET, BY TYPE
- 4.1. Overview
- 4.1.1. Market size and forecast
- 4.2. Process Equipment
- 4.2.1. Key market trends, growth factors and opportunities
- 4.2.2. Market size and forecast, by region
- 4.2.3. Market share analysis by country
- 4.3. Mud Treatment
- 4.3.1. Key market trends, growth factors and opportunities
- 4.3.2. Market size and forecast, by region
- 4.3.3. Market share analysis by country
- 4.4. Filtration Systems and Media
- 4.4.1. Key market trends, growth factors and opportunities
- 4.4.2. Market size and forecast, by region
- 4.4.3. Market share analysis by country
- 4.5. Disinfection
- 4.5.1. Key market trends, growth factors and opportunities
- 4.5.2. Market size and forecast, by region
- 4.5.3. Market share analysis by country
- 4.6. Diversions and Screens
- 4.6.1. Key market trends, growth factors and opportunities
- 4.6.2. Market size and forecast, by region
- 4.6.3. Market share analysis by country
- 4.7. Meters
- 4.7.1. Key market trends, growth factors and opportunities
- 4.7.2. Market size and forecast, by region
- 4.7.3. Market share analysis by country
- 4.8. Membranes
- 4.8.1. Key market trends, growth factors and opportunities
- 4.8.2. Market size and forecast, by region
- 4.8.3. Market share analysis by country
- 4.9. Others
- 4.9.1. Key market trends, growth factors and opportunities
- 4.9.2. Market size and forecast, by region
- 4.9.3. Market share analysis by country
CHAPTER 5: WATER TREATMENT EQUIPMENT MARKET, BY END-USE INDUSTRY
- 5.1. Overview
- 5.1.1. Market size and forecast
- 5.2. Industrial Water Treatment Equipment
- 5.2.1. Key market trends, growth factors and opportunities
- 5.2.2. Market size and forecast, by region
- 5.2.3. Market share analysis by country
- 5.3. Municipal Water Treatment Equipment
- 5.3.1. Key market trends, growth factors and opportunities
- 5.3.2. Market size and forecast, by region
- 5.3.3. Market share analysis by country
CHAPTER 6: WATER TREATMENT EQUIPMENT MARKET, BY REGION
- 6.1. Overview
- 6.1.1. Market size and forecast By Region
- 6.2. North America
- 6.2.1. Key trends and opportunities
- 6.2.2. Market size and forecast, by Type
- 6.2.3. Market size and forecast, by End-use Industry
- 6.2.4. Market size and forecast, by country
- 6.2.4.1. U.S.
- 6.2.4.1.1. Key market trends, growth factors and opportunities
- 6.2.4.1.2. Market size and forecast, by Type
- 6.2.4.1.3. Market size and forecast, by End-use Industry
- 6.2.4.2. Canada
- 6.2.4.2.1. Key market trends, growth factors and opportunities
- 6.2.4.2.2. Market size and forecast, by Type
- 6.2.4.2.3. Market size and forecast, by End-use Industry
- 6.2.4.3. Mexico
- 6.2.4.3.1. Key market trends, growth factors and opportunities
- 6.2.4.3.2. Market size and forecast, by Type
- 6.2.4.3.3. Market size and forecast, by End-use Industry
- 6.3. Europe
- 6.3.1. Key trends and opportunities
- 6.3.2. Market size and forecast, by Type
- 6.3.3. Market size and forecast, by End-use Industry
- 6.3.4. Market size and forecast, by country
- 6.3.4.1. Germany
- 6.3.4.1.1. Key market trends, growth factors and opportunities
- 6.3.4.1.2. Market size and forecast, by Type
- 6.3.4.1.3. Market size and forecast, by End-use Industry
- 6.3.4.2. France
- 6.3.4.2.1. Key market trends, growth factors and opportunities
- 6.3.4.2.2. Market size and forecast, by Type
- 6.3.4.2.3. Market size and forecast, by End-use Industry
- 6.3.4.3. UK
- 6.3.4.3.1. Key market trends, growth factors and opportunities
- 6.3.4.3.2. Market size and forecast, by Type
- 6.3.4.3.3. Market size and forecast, by End-use Industry
- 6.3.4.4. Italy
- 6.3.4.4.1. Key market trends, growth factors and opportunities
- 6.3.4.4.2. Market size and forecast, by Type
- 6.3.4.4.3. Market size and forecast, by End-use Industry
- 6.3.4.5. Spain
- 6.3.4.5.1. Key market trends, growth factors and opportunities
- 6.3.4.5.2. Market size and forecast, by Type
- 6.3.4.5.3. Market size and forecast, by End-use Industry
- 6.3.4.6. Rest of Europe
- 6.3.4.6.1. Key market trends, growth factors and opportunities
- 6.3.4.6.2. Market size and forecast, by Type
- 6.3.4.6.3. Market size and forecast, by End-use Industry
- 6.4. Asia-Pacific
- 6.4.1. Key trends and opportunities
- 6.4.2. Market size and forecast, by Type
- 6.4.3. Market size and forecast, by End-use Industry
- 6.4.4. Market size and forecast, by country
- 6.4.4.1. China
- 6.4.4.1.1. Key market trends, growth factors and opportunities
- 6.4.4.1.2. Market size and forecast, by Type
- 6.4.4.1.3. Market size and forecast, by End-use Industry
- 6.4.4.2. India
- 6.4.4.2.1. Key market trends, growth factors and opportunities
- 6.4.4.2.2. Market size and forecast, by Type
- 6.4.4.2.3. Market size and forecast, by End-use Industry
- 6.4.4.3. Japan
- 6.4.4.3.1. Key market trends, growth factors and opportunities
- 6.4.4.3.2. Market size and forecast, by Type
- 6.4.4.3.3. Market size and forecast, by End-use Industry
- 6.4.4.4. South Korea
- 6.4.4.4.1. Key market trends, growth factors and opportunities
- 6.4.4.4.2. Market size and forecast, by Type
- 6.4.4.4.3. Market size and forecast, by End-use Industry
- 6.4.4.5. Australia
- 6.4.4.5.1. Key market trends, growth factors and opportunities
- 6.4.4.5.2. Market size and forecast, by Type
- 6.4.4.5.3. Market size and forecast, by End-use Industry
- 6.4.4.6. Rest of Asia-Pacific
- 6.4.4.6.1. Key market trends, growth factors and opportunities
- 6.4.4.6.2. Market size and forecast, by Type
- 6.4.4.6.3. Market size and forecast, by End-use Industry
- 6.5. LAMEA
- 6.5.1. Key trends and opportunities
- 6.5.2. Market size and forecast, by Type
- 6.5.3. Market size and forecast, by End-use Industry
- 6.5.4. Market size and forecast, by country
- 6.5.4.1. Brazil
- 6.5.4.1.1. Key market trends, growth factors and opportunities
- 6.5.4.1.2. Market size and forecast, by Type
- 6.5.4.1.3. Market size and forecast, by End-use Industry
- 6.5.4.2. Saudi Arabia
- 6.5.4.2.1. Key market trends, growth factors and opportunities
- 6.5.4.2.2. Market size and forecast, by Type
- 6.5.4.2.3. Market size and forecast, by End-use Industry
- 6.5.4.3. South Africa
- 6.5.4.3.1. Key market trends, growth factors and opportunities
- 6.5.4.3.2. Market size and forecast, by Type
- 6.5.4.3.3. Market size and forecast, by End-use Industry
- 6.5.4.4. UAE
- 6.5.4.4.1. Key market trends, growth factors and opportunities
- 6.5.4.4.2. Market size and forecast, by Type
- 6.5.4.4.3. Market size and forecast, by End-use Industry
- 6.5.4.5. Rest of LAMEA
- 6.5.4.5.1. Key market trends, growth factors and opportunities
- 6.5.4.5.2. Market size and forecast, by Type
- 6.5.4.5.3. Market size and forecast, by End-use Industry
CHAPTER 7: COMPETITIVE LANDSCAPE
- 7.1. Introduction
- 7.2. Top winning strategies
- 7.3. Product Mapping of Top 10 Player
- 7.4. Competitive Dashboard
- 7.5. Competitive Heatmap
- 7.6. Top player positioning, 2022
CHAPTER 8: COMPANY PROFILES
- 8.1. Ecolab
- 8.1.1. Company overview
- 8.1.2. Key Executives
- 8.1.3. Company snapshot
- 8.1.4. Operating business segments
- 8.1.5. Product portfolio
- 8.1.6. Business performance
- 8.2. Hydranautics
- 8.2.1. Company overview
- 8.2.2. Key Executives
- 8.2.3. Company snapshot
- 8.2.4. Operating business segments
- 8.2.5. Product portfolio
- 8.2.6. Business performance
- 8.2.7. Key strategic moves and developments
- 8.3. Veolia
- 8.3.1. Company overview
- 8.3.2. Key Executives
- 8.3.3. Company snapshot
- 8.3.4. Operating business segments
- 8.3.5. Product portfolio
- 8.3.6. Business performance
- 8.4. Xylem
- 8.4.1. Company overview
- 8.4.2. Key Executives
- 8.4.3. Company snapshot
- 8.4.4. Operating business segments
- 8.4.5. Product portfolio
- 8.4.6. Business performance
- 8.4.7. Key strategic moves and developments
- 8.5. Pentair
- 8.5.1. Company overview
- 8.5.2. Key Executives
- 8.5.3. Company snapshot
- 8.5.4. Operating business segments
- 8.5.5. Product portfolio
- 8.5.6. Business performance
- 8.5.7. Key strategic moves and developments
- 8.6. General Electric
- 8.6.1. Company overview
- 8.6.2. Key Executives
- 8.6.3. Company snapshot
- 8.6.4. Operating business segments
- 8.6.5. Product portfolio
- 8.6.6. Business performance
- 8.7. Suez
- 8.7.1. Company overview
- 8.7.2. Key Executives
- 8.7.3. Company snapshot
- 8.7.4. Operating business segments
- 8.7.5. Product portfolio
- 8.7.6. Business performance
- 8.7.7. Key strategic moves and developments
- 8.8. Calgon Carbon Corporation
- 8.8.1. Company overview
- 8.8.2. Key Executives
- 8.8.3. Company snapshot
- 8.8.4. Operating business segments
- 8.8.5. Product portfolio
- 8.9. Culligan Water
- 8.9.1. Company overview
- 8.9.2. Key Executives
- 8.9.3. Company snapshot
- 8.9.4. Operating business segments
- 8.9.5. Product portfolio
- 8.10. Lenntech B.V.
- 8.10.1. Company overview
- 8.10.2. Key Executives
- 8.10.3. Company snapshot
- 8.10.4. Operating business segments
- 8.10.5. Product portfolio
LIST OF TABLES
- TABLE 01. GLOBAL WATER TREATMENT EQUIPMENT MARKET, BY TYPE, 2022-2032 ($MILLION)
- TABLE 02. WATER TREATMENT EQUIPMENT MARKET FOR PROCESS EQUIPMENT, BY REGION, 2022-2032 ($MILLION)
- TABLE 03. WATER TREATMENT EQUIPMENT MARKET FOR MUD TREATMENT, BY REGION, 2022-2032 ($MILLION)
- TABLE 04. WATER TREATMENT EQUIPMENT MARKET FOR FILTRATION SYSTEMS AND MEDIA, BY REGION, 2022-2032 ($MILLION)
- TABLE 05. WATER TREATMENT EQUIPMENT MARKET FOR DISINFECTION, BY REGION, 2022-2032 ($MILLION)
- TABLE 06. WATER TREATMENT EQUIPMENT MARKET FOR DIVERSIONS AND SCREENS, BY REGION, 2022-2032 ($MILLION)
- TABLE 07. WATER TREATMENT EQUIPMENT MARKET FOR METERS, BY REGION, 2022-2032 ($MILLION)
- TABLE 08. WATER TREATMENT EQUIPMENT MARKET FOR MEMBRANES, BY REGION, 2022-2032 ($MILLION)
- TABLE 09. WATER TREATMENT EQUIPMENT MARKET FOR OTHERS, BY REGION, 2022-2032 ($MILLION)
- TABLE 10. GLOBAL WATER TREATMENT EQUIPMENT MARKET, BY END-USE INDUSTRY , 2022-2032 ($MILLION)
- TABLE 11. WATER TREATMENT EQUIPMENT MARKET FOR INDUSTRIAL WATER TREATMENT EQUIPMENT, BY REGION, 2022-2032 ($MILLION)
- TABLE 12. WATER TREATMENT EQUIPMENT MARKET FOR MUNICIPAL WATER TREATMENT EQUIPMENT, BY REGION, 2022-2032 ($MILLION)
- TABLE 13. WATER TREATMENT EQUIPMENT MARKET, BY REGION, 2022-2032 ($MILLION)
- TABLE 14. NORTH AMERICA WATER TREATMENT EQUIPMENT MARKET, BY TYPE, 2022-2032 ($MILLION)
- TABLE 15. NORTH AMERICA WATER TREATMENT EQUIPMENT MARKET, BY END-USE INDUSTRY , 2022-2032 ($MILLION)
- TABLE 16. NORTH AMERICA WATER TREATMENT EQUIPMENT MARKET, BY COUNTRY, 2022-2032 ($MILLION)
- TABLE 17. U.S. WATER TREATMENT EQUIPMENT MARKET, BY TYPE, 2022-2032 ($MILLION)
- TABLE 18. U.S. WATER TREATMENT EQUIPMENT MARKET, BY END-USE INDUSTRY , 2022-2032 ($MILLION)
- TABLE 19. CANADA WATER TREATMENT EQUIPMENT MARKET, BY TYPE, 2022-2032 ($MILLION)
- TABLE 20. CANADA WATER TREATMENT EQUIPMENT MARKET, BY END-USE INDUSTRY , 2022-2032 ($MILLION)
- TABLE 21. MEXICO WATER TREATMENT EQUIPMENT MARKET, BY TYPE, 2022-2032 ($MILLION)
- TABLE 22. MEXICO WATER TREATMENT EQUIPMENT MARKET, BY END-USE INDUSTRY , 2022-2032 ($MILLION)
- TABLE 23. EUROPE WATER TREATMENT EQUIPMENT MARKET, BY TYPE, 2022-2032 ($MILLION)
- TABLE 24. EUROPE WATER TREATMENT EQUIPMENT MARKET, BY END-USE INDUSTRY , 2022-2032 ($MILLION)
- TABLE 25. EUROPE WATER TREATMENT EQUIPMENT MARKET, BY COUNTRY, 2022-2032 ($MILLION)
- TABLE 26. GERMANY WATER TREATMENT EQUIPMENT MARKET, BY TYPE, 2022-2032 ($MILLION)
- TABLE 27. GERMANY WATER TREATMENT EQUIPMENT MARKET, BY END-USE INDUSTRY , 2022-2032 ($MILLION)
- TABLE 28. FRANCE WATER TREATMENT EQUIPMENT MARKET, BY TYPE, 2022-2032 ($MILLION)
- TABLE 29. FRANCE WATER TREATMENT EQUIPMENT MARKET, BY END-USE INDUSTRY , 2022-2032 ($MILLION)
- TABLE 30. UK WATER TREATMENT EQUIPMENT MARKET, BY TYPE, 2022-2032 ($MILLION)
- TABLE 31. UK WATER TREATMENT EQUIPMENT MARKET, BY END-USE INDUSTRY , 2022-2032 ($MILLION)
- TABLE 32. ITALY WATER TREATMENT EQUIPMENT MARKET, BY TYPE, 2022-2032 ($MILLION)
- TABLE 33. ITALY WATER TREATMENT EQUIPMENT MARKET, BY END-USE INDUSTRY , 2022-2032 ($MILLION)
- TABLE 34. SPAIN WATER TREATMENT EQUIPMENT MARKET, BY TYPE, 2022-2032 ($MILLION)
- TABLE 35. SPAIN WATER TREATMENT EQUIPMENT MARKET, BY END-USE INDUSTRY , 2022-2032 ($MILLION)
- TABLE 36. REST OF EUROPE WATER TREATMENT EQUIPMENT MARKET, BY TYPE, 2022-2032 ($MILLION)
- TABLE 37. REST OF EUROPE WATER TREATMENT EQUIPMENT MARKET, BY END-USE INDUSTRY , 2022-2032 ($MILLION)
- TABLE 38. ASIA-PACIFIC WATER TREATMENT EQUIPMENT MARKET, BY TYPE, 2022-2032 ($MILLION)
- TABLE 39. ASIA-PACIFIC WATER TREATMENT EQUIPMENT MARKET, BY END-USE INDUSTRY , 2022-2032 ($MILLION)
- TABLE 40. ASIA-PACIFIC WATER TREATMENT EQUIPMENT MARKET, BY COUNTRY, 2022-2032 ($MILLION)
- TABLE 41. CHINA WATER TREATMENT EQUIPMENT MARKET, BY TYPE, 2022-2032 ($MILLION)
- TABLE 42. CHINA WATER TREATMENT EQUIPMENT MARKET, BY END-USE INDUSTRY , 2022-2032 ($MILLION)
- TABLE 43. INDIA WATER TREATMENT EQUIPMENT MARKET, BY TYPE, 2022-2032 ($MILLION)
- TABLE 44. INDIA WATER TREATMENT EQUIPMENT MARKET, BY END-USE INDUSTRY , 2022-2032 ($MILLION)
- TABLE 45. JAPAN WATER TREATMENT EQUIPMENT MARKET, BY TYPE, 2022-2032 ($MILLION)
- TABLE 46. JAPAN WATER TREATMENT EQUIPMENT MARKET, BY END-USE INDUSTRY , 2022-2032 ($MILLION)
- TABLE 47. SOUTH KOREA WATER TREATMENT EQUIPMENT MARKET, BY TYPE, 2022-2032 ($MILLION)
- TABLE 48. SOUTH KOREA WATER TREATMENT EQUIPMENT MARKET, BY END-USE INDUSTRY , 2022-2032 ($MILLION)
- TABLE 49. AUSTRALIA WATER TREATMENT EQUIPMENT MARKET, BY TYPE, 2022-2032 ($MILLION)
- TABLE 50. AUSTRALIA WATER TREATMENT EQUIPMENT MARKET, BY END-USE INDUSTRY , 2022-2032 ($MILLION)
- TABLE 51. REST OF ASIA-PACIFIC WATER TREATMENT EQUIPMENT MARKET, BY TYPE, 2022-2032 ($MILLION)
- TABLE 52. REST OF ASIA-PACIFIC WATER TREATMENT EQUIPMENT MARKET, BY END-USE INDUSTRY , 2022-2032 ($MILLION)
- TABLE 53. LAMEA WATER TREATMENT EQUIPMENT MARKET, BY TYPE, 2022-2032 ($MILLION)
- TABLE 54. LAMEA WATER TREATMENT EQUIPMENT MARKET, BY END-USE INDUSTRY , 2022-2032 ($MILLION)
- TABLE 55. LAMEA WATER TREATMENT EQUIPMENT MARKET, BY COUNTRY, 2022-2032 ($MILLION)
- TABLE 56. BRAZIL WATER TREATMENT EQUIPMENT MARKET, BY TYPE, 2022-2032 ($MILLION)
- TABLE 57. BRAZIL WATER TREATMENT EQUIPMENT MARKET, BY END-USE INDUSTRY , 2022-2032 ($MILLION)
- TABLE 58. SAUDI ARABIA WATER TREATMENT EQUIPMENT MARKET, BY TYPE, 2022-2032 ($MILLION)
- TABLE 59. SAUDI ARABIA WATER TREATMENT EQUIPMENT MARKET, BY END-USE INDUSTRY , 2022-2032 ($MILLION)
- TABLE 60. SOUTH AFRICA WATER TREATMENT EQUIPMENT MARKET, BY TYPE, 2022-2032 ($MILLION)
- TABLE 61. SOUTH AFRICA WATER TREATMENT EQUIPMENT MARKET, BY END-USE INDUSTRY , 2022-2032 ($MILLION)
- TABLE 62. UAE WATER TREATMENT EQUIPMENT MARKET, BY TYPE, 2022-2032 ($MILLION)
- TABLE 63. UAE WATER TREATMENT EQUIPMENT MARKET, BY END-USE INDUSTRY , 2022-2032 ($MILLION)
- TABLE 64. REST OF LAMEA WATER TREATMENT EQUIPMENT MARKET, BY TYPE, 2022-2032 ($MILLION)
- TABLE 65. REST OF LAMEA WATER TREATMENT EQUIPMENT MARKET, BY END-USE INDUSTRY , 2022-2032 ($MILLION)
- TABLE 66. ECOLAB: KEY EXECUTIVES
- TABLE 67. ECOLAB: COMPANY SNAPSHOT
- TABLE 68. ECOLAB: PRODUCT SEGMENTS
- TABLE 69. ECOLAB: PRODUCT PORTFOLIO
- TABLE 70. HYDRANAUTICS: KEY EXECUTIVES
- TABLE 71. HYDRANAUTICS: COMPANY SNAPSHOT
- TABLE 72. HYDRANAUTICS: PRODUCT SEGMENTS
- TABLE 73. HYDRANAUTICS: PRODUCT PORTFOLIO
- TABLE 74. HYDRANAUTICS: KEY STRATERGIES
- TABLE 75. VEOLIA: KEY EXECUTIVES
- TABLE 76. VEOLIA: COMPANY SNAPSHOT
- TABLE 77. VEOLIA: PRODUCT SEGMENTS
- TABLE 78. VEOLIA: PRODUCT PORTFOLIO
- TABLE 79. XYLEM: KEY EXECUTIVES
- TABLE 80. XYLEM: COMPANY SNAPSHOT
- TABLE 81. XYLEM: PRODUCT SEGMENTS
- TABLE 82. XYLEM: PRODUCT PORTFOLIO
- TABLE 83. XYLEM: KEY STRATERGIES
- TABLE 84. PENTAIR: KEY EXECUTIVES
- TABLE 85. PENTAIR: COMPANY SNAPSHOT
- TABLE 86. PENTAIR: PRODUCT SEGMENTS
- TABLE 87. PENTAIR: PRODUCT PORTFOLIO
- TABLE 88. PENTAIR: KEY STRATERGIES
- TABLE 89. GENERAL ELECTRIC: KEY EXECUTIVES
- TABLE 90. GENERAL ELECTRIC: COMPANY SNAPSHOT
- TABLE 91. GENERAL ELECTRIC: PRODUCT SEGMENTS
- TABLE 92. GENERAL ELECTRIC: PRODUCT PORTFOLIO
- TABLE 93. SUEZ: KEY EXECUTIVES
- TABLE 94. SUEZ: COMPANY SNAPSHOT
- TABLE 95. SUEZ: SERVICE SEGMENTS
- TABLE 96. SUEZ: PRODUCT PORTFOLIO
- TABLE 97. SUEZ: KEY STRATERGIES
- TABLE 98. CALGON CARBON CORPORATION: KEY EXECUTIVES
- TABLE 99. CALGON CARBON CORPORATION: COMPANY SNAPSHOT
- TABLE 100. CALGON CARBON CORPORATION: PRODUCT SEGMENTS
- TABLE 101. CALGON CARBON CORPORATION: PRODUCT PORTFOLIO
- TABLE 102. CULLIGAN WATER: KEY EXECUTIVES
- TABLE 103. CULLIGAN WATER: COMPANY SNAPSHOT
- TABLE 104. CULLIGAN WATER: PRODUCT SEGMENTS
- TABLE 105. CULLIGAN WATER: PRODUCT PORTFOLIO
- TABLE 106. LENNTECH B.V.: KEY EXECUTIVES
- TABLE 107. LENNTECH B.V.: COMPANY SNAPSHOT
- TABLE 108. LENNTECH B.V.: PRODUCT SEGMENTS
- TABLE 109. LENNTECH B.V.: PRODUCT PORTFOLIO
LIST OF FIGURES
- FIGURE 01. WATER TREATMENT EQUIPMENT MARKET, 2022-2032
- FIGURE 02. SEGMENTATION OF WATER TREATMENT EQUIPMENT MARKET, 2022-2032
- FIGURE 03. WATER TREATMENT EQUIPMENT MARKET,2022-2032
- FIGURE 04. TOP INVESTMENT POCKETS IN WATER TREATMENT EQUIPMENT MARKET (2023-2032)
- FIGURE 05. LOW BARGAINING POWER OF SUPPLIERS
- FIGURE 06. LOW THREAT OF NEW ENTRANTS
- FIGURE 07. LOW THREAT OF SUBSTITUTES
- FIGURE 08. LOW INTENSITY OF RIVALRY
- FIGURE 09. LOW BARGAINING POWER OF BUYERS
- FIGURE 10. GLOBAL WATER TREATMENT EQUIPMENT MARKET:DRIVERS, RESTRAINTS AND OPPORTUNITIES
- FIGURE 11. REGULATORY GUIDELINES: WATER TREATMENT EQUIPMENT MARKET
- FIGURE 12. PATENT ANALYSIS BY COMPANY
- FIGURE 13. PATENT ANALYSIS BY COUNTRY
- FIGURE 14. PRICING ANALYSIS: WATER TREATMENT EQUIPMENT MARKET 2022 AND 2032
- FIGURE 15. WATER TREATMENT EQUIPMENT MARKET, BY TYPE, 2022(%)
- FIGURE 16. COMPARATIVE SHARE ANALYSIS OF WATER TREATMENT EQUIPMENT MARKET FOR PROCESS EQUIPMENT, BY COUNTRY 2022-2032(%)
- FIGURE 17. COMPARATIVE SHARE ANALYSIS OF WATER TREATMENT EQUIPMENT MARKET FOR MUD TREATMENT, BY COUNTRY 2022-2032(%)
- FIGURE 18. COMPARATIVE SHARE ANALYSIS OF WATER TREATMENT EQUIPMENT MARKET FOR FILTRATION SYSTEMS AND MEDIA, BY COUNTRY 2022-2032(%)
- FIGURE 19. COMPARATIVE SHARE ANALYSIS OF WATER TREATMENT EQUIPMENT MARKET FOR DISINFECTION, BY COUNTRY 2022-2032(%)
- FIGURE 20. COMPARATIVE SHARE ANALYSIS OF WATER TREATMENT EQUIPMENT MARKET FOR DIVERSIONS AND SCREENS, BY COUNTRY 2022-2032(%)
- FIGURE 21. COMPARATIVE SHARE ANALYSIS OF WATER TREATMENT EQUIPMENT MARKET FOR METERS, BY COUNTRY 2022-2032(%)
- FIGURE 22. COMPARATIVE SHARE ANALYSIS OF WATER TREATMENT EQUIPMENT MARKET FOR MEMBRANES, BY COUNTRY 2022-2032(%)
- FIGURE 23. COMPARATIVE SHARE ANALYSIS OF WATER TREATMENT EQUIPMENT MARKET FOR OTHERS, BY COUNTRY 2022-2032(%)
- FIGURE 24. WATER TREATMENT EQUIPMENT MARKET, BY END-USE INDUSTRY , 2022(%)
- FIGURE 25. COMPARATIVE SHARE ANALYSIS OF WATER TREATMENT EQUIPMENT MARKET FOR INDUSTRIAL WATER TREATMENT EQUIPMENT, BY COUNTRY 2022-2032(%)
- FIGURE 26. COMPARATIVE SHARE ANALYSIS OF WATER TREATMENT EQUIPMENT MARKET FOR MUNICIPAL WATER TREATMENT EQUIPMENT, BY COUNTRY 2022-2032(%)
- FIGURE 27. WATER TREATMENT EQUIPMENT MARKET BY REGION, 2022
- FIGURE 28. U.S. WATER TREATMENT EQUIPMENT MARKET, 2022-2032 ($MILLION)
- FIGURE 29. CANADA WATER TREATMENT EQUIPMENT MARKET, 2022-2032 ($MILLION)
- FIGURE 30. MEXICO WATER TREATMENT EQUIPMENT MARKET, 2022-2032 ($MILLION)
- FIGURE 31. GERMANY WATER TREATMENT EQUIPMENT MARKET, 2022-2032 ($MILLION)
- FIGURE 32. FRANCE WATER TREATMENT EQUIPMENT MARKET, 2022-2032 ($MILLION)
- FIGURE 33. UK WATER TREATMENT EQUIPMENT MARKET, 2022-2032 ($MILLION)
- FIGURE 34. ITALY WATER TREATMENT EQUIPMENT MARKET, 2022-2032 ($MILLION)
- FIGURE 35. SPAIN WATER TREATMENT EQUIPMENT MARKET, 2022-2032 ($MILLION)
- FIGURE 36. REST OF EUROPE WATER TREATMENT EQUIPMENT MARKET, 2022-2032 ($MILLION)
- FIGURE 37. CHINA WATER TREATMENT EQUIPMENT MARKET, 2022-2032 ($MILLION)
- FIGURE 38. INDIA WATER TREATMENT EQUIPMENT MARKET, 2022-2032 ($MILLION)
- FIGURE 39. JAPAN WATER TREATMENT EQUIPMENT MARKET, 2022-2032 ($MILLION)
- FIGURE 40. SOUTH KOREA WATER TREATMENT EQUIPMENT MARKET, 2022-2032 ($MILLION)
- FIGURE 41. AUSTRALIA WATER TREATMENT EQUIPMENT MARKET, 2022-2032 ($MILLION)
- FIGURE 42. REST OF ASIA-PACIFIC WATER TREATMENT EQUIPMENT MARKET, 2022-2032 ($MILLION)
- FIGURE 43. BRAZIL WATER TREATMENT EQUIPMENT MARKET, 2022-2032 ($MILLION)
- FIGURE 44. SAUDI ARABIA WATER TREATMENT EQUIPMENT MARKET, 2022-2032 ($MILLION)
- FIGURE 45. SOUTH AFRICA WATER TREATMENT EQUIPMENT MARKET, 2022-2032 ($MILLION)
- FIGURE 46. UAE WATER TREATMENT EQUIPMENT MARKET, 2022-2032 ($MILLION)
- FIGURE 47. REST OF LAMEA WATER TREATMENT EQUIPMENT MARKET, 2022-2032 ($MILLION)
- FIGURE 48. TOP WINNING STRATEGIES, BY YEAR
- FIGURE 49. TOP WINNING STRATEGIES, BY DEVELOPMENT
- FIGURE 50. TOP WINNING STRATEGIES, BY COMPANY
- FIGURE 51. PRODUCT MAPPING OF TOP 10 PLAYERS
- FIGURE 52. COMPETITIVE DASHBOARD
- FIGURE 53. COMPETITIVE HEATMAP: WATER TREATMENT EQUIPMENT MARKET
- FIGURE 54. TOP PLAYER POSITIONING, 2022
- FIGURE 55. ECOLAB: NET SALES, 2020-2022 ($MILLION)
- FIGURE 56. ECOLAB: RESEARCH & DEVELOPMENT EXPENDITURE, 2020-2022 ($MILLION)
- FIGURE 57. ECOLAB: REVENUE SHARE BY SEGMENT, 2022 (%)
- FIGURE 58. ECOLAB: REVENUE SHARE BY REGION, 2022 (%)
- FIGURE 59. HYDRANAUTICS: NET REVENUE, 2020-2022 ($MILLION)
- FIGURE 60. VEOLIA: NET REVENUE, 2020-2022 ($MILLION)
- FIGURE 61. VEOLIA: REVENUE SHARE BY SEGMENT, 2022 (%)
- FIGURE 62. VEOLIA: REVENUE SHARE BY REGION, 2022 (%)
- FIGURE 63. XYLEM: NET REVENUE, 2020-2022 ($MILLION)
- FIGURE 64. XYLEM: RESEARCH & DEVELOPMENT EXPENDITURE, 2020-2022 ($MILLION)
- FIGURE 65. XYLEM: REVENUE SHARE BY SEGMENT, 2022 (%)
- FIGURE 66. XYLEM: REVENUE SHARE BY REGION, 2022 (%)
- FIGURE 67. PENTAIR: NET SALES, 2020-2022 ($MILLION)
- FIGURE 68. PENTAIR: RESEARCH & DEVELOPMENT EXPENDITURE, 2020-2022 ($MILLION)
- FIGURE 69. PENTAIR: REVENUE SHARE BY SEGMENT, 2022 (%)
- FIGURE 70. PENTAIR: REVENUE SHARE BY REGION, 2022 (%)
- FIGURE 71. GENERAL ELECTRIC: NET REVENUE, 2020-2022 ($MILLION)
- FIGURE 72. GENERAL ELECTRIC: RESEARCH & DEVELOPMENT EXPENDITURE, 2020-2022 ($MILLION)
- FIGURE 73. GENERAL ELECTRIC: REVENUE SHARE BY SEGMENT, 2022 (%)
- FIGURE 74. GENERAL ELECTRIC: REVENUE SHARE BY REGION, 2022 (%)
- FIGURE 75. SUEZ: NET REVENUE, 2020-2022 ($MILLION)
- FIGURE 76. SUEZ: REVENUE SHARE BY SEGMENT, 2022 (%)
- FIGURE 77. SUEZ: REVENUE SHARE BY REGION, 2022 (%)

