
PUBLISHER: Allied Market Research | PRODUCT CODE: 1344536

PUBLISHER: Allied Market Research | PRODUCT CODE: 1344536
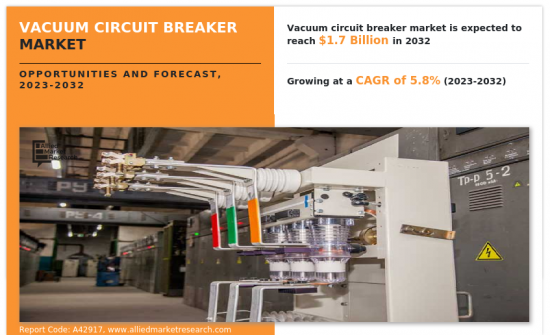
Vacuum Circuit Breaker Market By Voltage (Medium Voltage, High Voltage), By Installation Location (Indoor, Outdoor), By End Use Industry (Residential, Commercial, Industrial, Utilities): Global Opportunity Analysis and Industry Forecast, 2023-2032
According to a new report published by Allied Market Research, titled, "Vacuum Circuit Breaker Market," The vacuum circuit breaker market was valued at $0.9 billion in 2022, and is estimated to reach $1.7 billion by 2032, growing at a CAGR of 5.8% from 2023 to 2032.
A vacuum circuit breaker is an electrical switching device that is used to interrupt or cut off the flow of electric current in a circuit. It employs a vacuum as the arc quenching medium to extinguish the electric arc that forms when the contacts of the breaker open during switching operations or in the event of a fault. Vacuum circuit breakers are widely used in power distribution systems, industrial facilities, commercial buildings, and renewable energy installations to ensure the safe and reliable operation of electrical systems by protecting against overcurrent, short circuits, and other electrical faults.
The vacuum circuit breakers market is anticipated to expand significantly during the forecast period owing to maintenance of free vacuum circuit breakers, grid modernization, increase in adoption of grid-connected renewable energy sources, and surge in demand from the power sector for better and more reliable performance. In addition, during the forecast period, the vacuum circuit breakers market is anticipated to benefit from rise in infrastructural developments. On the other hand, growth in the vacuum circuit breakers market is expected to be restrained as the price of the raw materials is high, which makes it uneconomical to manufacture for voltages exceeding 38 kV, and possibility of overvoltage during switching.
The vacuum circuit breakers market is segmented on the basis of voltage, installation location, end-use industry, and region. On the basis of voltage, the market is bifurcated into medium and high. On the basis of installation location, the market is segregated into indoor and outdoor. On the basis of end-use industry, the market is divided into residential, commercial, industrial, and utilities. Region-wise, the vacuum circuit breakers market trends are analyzed across North America (the U.S., Canada, and Mexico), Europe (the UK, Germany, France, and rest of Europe), Asia-Pacific (China, Japan, India, South Korea, and rest of Asia-Pacific), and LAMEA (Latin America, Middle East, and Africa). Asia-Pacific remain significant participants in the vacuum circuit breakers market.
The key players profiled in the report include: ABB Ltd, ARTECHE, Eaton, Fuji Electric, Huayi Electric Co., Ltd., Legrand, Mitsubishi Electric Corporation, Schneider Electric, Siemens, and Toshiba Energy Systems & Solutions Corporation. Market players have adopted various strategies such as product launch, product development, and acquisition to expand their foothold in the vacuum circuit breakers market.
Key Benefits For Stakeholders
- This report provides a quantitative analysis of the market segments, current trends, estimations, and dynamics of the vacuum circuit breaker market analysis from 2022 to 2032 to identify the prevailing vacuum circuit breaker market opportunities.
- The market research is offered along with information related to key drivers, restraints, and opportunities.
- Porter's five forces analysis highlights the potency of buyers and suppliers to enable stakeholders make profit-oriented business decisions and strengthen their supplier-buyer network.
- In-depth analysis of the vacuum circuit breaker market segmentation assists to determine the prevailing market opportunities.
- Major countries in each region are mapped according to their revenue contribution to the global market.
- Market player positioning facilitates benchmarking and provides a clear understanding of the present position of the market players.
- The report includes the analysis of the regional as well as global vacuum circuit breaker market trends, key players, market segments, application areas, and market growth strategies.
Key Market Segments
By Voltage
- Medium Voltage
- High Voltage
By Installation Location
- Indoor
- Outdoor
By End Use Industry
- Residential
- Commercial
- Industrial
- Utilities
By Region
- North America
- U.S.
- Canada
- Mexico
- Europe
- UK
- Germany
- France
- Spain
- Italy
- Rest of Europe
- Asia-Pacific
- China
- Japan
- India
- South Korea
- Rest of Asia-Pacific
- LAMEA
- Latin America
- Middle East
- Africa
Key Market Players:
- ABB
- ARTECHE
- Eaton
- Fuji Electric Co., Ltd.
- Huayi Electric Co., Ltd.
- Legrand
- Mitsubishi Electric Corporation
- Schneider Electric
- Siemens
- Toshiba Energy Systems & Solutions Corporation
TABLE OF CONTENTS
CHAPTER 1: INTRODUCTION
- 1.1. Report description
- 1.2. Key market segments
- 1.3. Key benefits to the stakeholders
- 1.4. Research Methodology
- 1.4.1. Primary research
- 1.4.2. Secondary research
- 1.4.3. Analyst tools and models
CHAPTER 2: EXECUTIVE SUMMARY
- 2.1. CXO Perspective
CHAPTER 3: MARKET OVERVIEW
- 3.1. Market definition and scope
- 3.2. Key findings
- 3.2.1. Top impacting factors
- 3.2.2. Top investment pockets
- 3.3. Porter's five forces analysis
- 3.3.1. Bargaining power of suppliers
- 3.3.2. Bargaining power of buyers
- 3.3.3. Threat of substitutes
- 3.3.4. Threat of new entrants
- 3.3.5. Intensity of rivalry
- 3.4. Market dynamics
- 3.4.1. Drivers
- 3.4.1.1. Maintenance free vacuum circuit breakers.
- 3.4.1.2. Grid modernization and increasing adoption of grid-connected renewable energy sources.
- 3.4.1.3. Surge in demand from the power sector for better and more reliable performance
- 3.4.1. Drivers
- 3.4.2. Restraints
- 3.4.2.1. The vacuum circuit breakers are uneconomical at voltages exceeding 38 kV.
- 3.4.2.2. Possibility of overvoltage during switching.
- 3.4.3. Opportunities
- 3.4.3.1. Rise in infrastructural developments.
- 3.5. COVID-19 Impact Analysis on the market
CHAPTER 4: VACUUM CIRCUIT BREAKER MARKET, BY VOLTAGE
- 4.1. Overview
- 4.1.1. Market size and forecast
- 4.2. Medium Voltage
- 4.2.1. Key market trends, growth factors and opportunities
- 4.2.2. Market size and forecast, by region
- 4.2.3. Market share analysis by country
- 4.3. High Voltage
- 4.3.1. Key market trends, growth factors and opportunities
- 4.3.2. Market size and forecast, by region
- 4.3.3. Market share analysis by country
CHAPTER 5: VACUUM CIRCUIT BREAKER MARKET, BY INSTALLATION LOCATION
- 5.1. Overview
- 5.1.1. Market size and forecast
- 5.2. Indoor
- 5.2.1. Key market trends, growth factors and opportunities
- 5.2.2. Market size and forecast, by region
- 5.2.3. Market share analysis by country
- 5.3. Outdoor
- 5.3.1. Key market trends, growth factors and opportunities
- 5.3.2. Market size and forecast, by region
- 5.3.3. Market share analysis by country
CHAPTER 6: VACUUM CIRCUIT BREAKER MARKET, BY END USE INDUSTRY
- 6.1. Overview
- 6.1.1. Market size and forecast
- 6.2. Residential
- 6.2.1. Key market trends, growth factors and opportunities
- 6.2.2. Market size and forecast, by region
- 6.2.3. Market share analysis by country
- 6.3. Commercial
- 6.3.1. Key market trends, growth factors and opportunities
- 6.3.2. Market size and forecast, by region
- 6.3.3. Market share analysis by country
- 6.4. Industrial
- 6.4.1. Key market trends, growth factors and opportunities
- 6.4.2. Market size and forecast, by region
- 6.4.3. Market share analysis by country
- 6.5. Utilities
- 6.5.1. Key market trends, growth factors and opportunities
- 6.5.2. Market size and forecast, by region
- 6.5.3. Market share analysis by country
CHAPTER 7: VACUUM CIRCUIT BREAKER MARKET, BY REGION
- 7.1. Overview
- 7.1.1. Market size and forecast By Region
- 7.2. North America
- 7.2.1. Key trends and opportunities
- 7.2.2. Market size and forecast, by Voltage
- 7.2.3. Market size and forecast, by Installation Location
- 7.2.4. Market size and forecast, by End Use Industry
- 7.2.5. Market size and forecast, by country
- 7.2.5.1. U.S.
- 7.2.5.1.1. Key market trends, growth factors and opportunities
- 7.2.5.1.2. Market size and forecast, by Voltage
- 7.2.5.1.3. Market size and forecast, by Installation Location
- 7.2.5.1.4. Market size and forecast, by End Use Industry
- 7.2.5.2. Canada
- 7.2.5.2.1. Key market trends, growth factors and opportunities
- 7.2.5.2.2. Market size and forecast, by Voltage
- 7.2.5.2.3. Market size and forecast, by Installation Location
- 7.2.5.2.4. Market size and forecast, by End Use Industry
- 7.2.5.3. Mexico
- 7.2.5.3.1. Key market trends, growth factors and opportunities
- 7.2.5.3.2. Market size and forecast, by Voltage
- 7.2.5.3.3. Market size and forecast, by Installation Location
- 7.2.5.3.4. Market size and forecast, by End Use Industry
- 7.3. Europe
- 7.3.1. Key trends and opportunities
- 7.3.2. Market size and forecast, by Voltage
- 7.3.3. Market size and forecast, by Installation Location
- 7.3.4. Market size and forecast, by End Use Industry
- 7.3.5. Market size and forecast, by country
- 7.3.5.1. UK
- 7.3.5.1.1. Key market trends, growth factors and opportunities
- 7.3.5.1.2. Market size and forecast, by Voltage
- 7.3.5.1.3. Market size and forecast, by Installation Location
- 7.3.5.1.4. Market size and forecast, by End Use Industry
- 7.3.5.2. Germany
- 7.3.5.2.1. Key market trends, growth factors and opportunities
- 7.3.5.2.2. Market size and forecast, by Voltage
- 7.3.5.2.3. Market size and forecast, by Installation Location
- 7.3.5.2.4. Market size and forecast, by End Use Industry
- 7.3.5.3. France
- 7.3.5.3.1. Key market trends, growth factors and opportunities
- 7.3.5.3.2. Market size and forecast, by Voltage
- 7.3.5.3.3. Market size and forecast, by Installation Location
- 7.3.5.3.4. Market size and forecast, by End Use Industry
- 7.3.5.4. Spain
- 7.3.5.4.1. Key market trends, growth factors and opportunities
- 7.3.5.4.2. Market size and forecast, by Voltage
- 7.3.5.4.3. Market size and forecast, by Installation Location
- 7.3.5.4.4. Market size and forecast, by End Use Industry
- 7.3.5.5. Italy
- 7.3.5.5.1. Key market trends, growth factors and opportunities
- 7.3.5.5.2. Market size and forecast, by Voltage
- 7.3.5.5.3. Market size and forecast, by Installation Location
- 7.3.5.5.4. Market size and forecast, by End Use Industry
- 7.3.5.6. Rest of Europe
- 7.3.5.6.1. Key market trends, growth factors and opportunities
- 7.3.5.6.2. Market size and forecast, by Voltage
- 7.3.5.6.3. Market size and forecast, by Installation Location
- 7.3.5.6.4. Market size and forecast, by End Use Industry
- 7.4. Asia-Pacific
- 7.4.1. Key trends and opportunities
- 7.4.2. Market size and forecast, by Voltage
- 7.4.3. Market size and forecast, by Installation Location
- 7.4.4. Market size and forecast, by End Use Industry
- 7.4.5. Market size and forecast, by country
- 7.4.5.1. China
- 7.4.5.1.1. Key market trends, growth factors and opportunities
- 7.4.5.1.2. Market size and forecast, by Voltage
- 7.4.5.1.3. Market size and forecast, by Installation Location
- 7.4.5.1.4. Market size and forecast, by End Use Industry
- 7.4.5.2. Japan
- 7.4.5.2.1. Key market trends, growth factors and opportunities
- 7.4.5.2.2. Market size and forecast, by Voltage
- 7.4.5.2.3. Market size and forecast, by Installation Location
- 7.4.5.2.4. Market size and forecast, by End Use Industry
- 7.4.5.3. India
- 7.4.5.3.1. Key market trends, growth factors and opportunities
- 7.4.5.3.2. Market size and forecast, by Voltage
- 7.4.5.3.3. Market size and forecast, by Installation Location
- 7.4.5.3.4. Market size and forecast, by End Use Industry
- 7.4.5.4. South Korea
- 7.4.5.4.1. Key market trends, growth factors and opportunities
- 7.4.5.4.2. Market size and forecast, by Voltage
- 7.4.5.4.3. Market size and forecast, by Installation Location
- 7.4.5.4.4. Market size and forecast, by End Use Industry
- 7.4.5.5. Rest of Asia-Pacific
- 7.4.5.5.1. Key market trends, growth factors and opportunities
- 7.4.5.5.2. Market size and forecast, by Voltage
- 7.4.5.5.3. Market size and forecast, by Installation Location
- 7.4.5.5.4. Market size and forecast, by End Use Industry
- 7.5. LAMEA
- 7.5.1. Key trends and opportunities
- 7.5.2. Market size and forecast, by Voltage
- 7.5.3. Market size and forecast, by Installation Location
- 7.5.4. Market size and forecast, by End Use Industry
- 7.5.5. Market size and forecast, by country
- 7.5.5.1. Latin America
- 7.5.5.1.1. Key market trends, growth factors and opportunities
- 7.5.5.1.2. Market size and forecast, by Voltage
- 7.5.5.1.3. Market size and forecast, by Installation Location
- 7.5.5.1.4. Market size and forecast, by End Use Industry
- 7.5.5.2. Middle East
- 7.5.5.2.1. Key market trends, growth factors and opportunities
- 7.5.5.2.2. Market size and forecast, by Voltage
- 7.5.5.2.3. Market size and forecast, by Installation Location
- 7.5.5.2.4. Market size and forecast, by End Use Industry
- 7.5.5.3. Africa
- 7.5.5.3.1. Key market trends, growth factors and opportunities
- 7.5.5.3.2. Market size and forecast, by Voltage
- 7.5.5.3.3. Market size and forecast, by Installation Location
- 7.5.5.3.4. Market size and forecast, by End Use Industry
CHAPTER 8: COMPETITIVE LANDSCAPE
- 8.1. Introduction
- 8.2. Top winning strategies
- 8.3. Product Mapping of Top 10 Player
- 8.4. Competitive Dashboard
- 8.5. Competitive Heatmap
- 8.6. Top player positioning, 2022
CHAPTER 9: COMPANY PROFILES
- 9.1. ABB
- 9.1.1. Company overview
- 9.1.2. Key Executives
- 9.1.3. Company snapshot
- 9.1.4. Operating business segments
- 9.1.5. Product portfolio
- 9.1.6. Business performance
- 9.2. ARTECHE
- 9.2.1. Company overview
- 9.2.2. Key Executives
- 9.2.3. Company snapshot
- 9.2.4. Operating business segments
- 9.2.5. Product portfolio
- 9.2.6. Business performance
- 9.2.7. Key strategic moves and developments
- 9.3. Eaton
- 9.3.1. Company overview
- 9.3.2. Key Executives
- 9.3.3. Company snapshot
- 9.3.4. Operating business segments
- 9.3.5. Product portfolio
- 9.3.6. Business performance
- 9.4. Fuji Electric Co., Ltd.
- 9.4.1. Company overview
- 9.4.2. Key Executives
- 9.4.3. Company snapshot
- 9.4.4. Operating business segments
- 9.4.5. Product portfolio
- 9.4.6. Business performance
- 9.5. Huayi Electric Co., Ltd.
- 9.5.1. Company overview
- 9.5.2. Key Executives
- 9.5.3. Company snapshot
- 9.5.4. Operating business segments
- 9.5.5. Product portfolio
- 9.6. Legrand
- 9.6.1. Company overview
- 9.6.2. Key Executives
- 9.6.3. Company snapshot
- 9.6.4. Operating business segments
- 9.6.5. Product portfolio
- 9.6.6. Business performance
- 9.7. Mitsubishi Electric Corporation
- 9.7.1. Company overview
- 9.7.2. Key Executives
- 9.7.3. Company snapshot
- 9.7.4. Operating business segments
- 9.7.5. Product portfolio
- 9.7.6. Business performance
- 9.7.7. Key strategic moves and developments
- 9.8. Schneider Electric
- 9.8.1. Company overview
- 9.8.2. Key Executives
- 9.8.3. Company snapshot
- 9.8.4. Operating business segments
- 9.8.5. Product portfolio
- 9.8.6. Business performance
- 9.8.7. Key strategic moves and developments
- 9.9. Siemens
- 9.9.1. Company overview
- 9.9.2. Key Executives
- 9.9.3. Company snapshot
- 9.9.4. Operating business segments
- 9.9.5. Product portfolio
- 9.9.6. Business performance
- 9.10. Toshiba Energy Systems & Solutions Corporation
- 9.10.1. Company overview
- 9.10.2. Key Executives
- 9.10.3. Company snapshot
- 9.10.4. Operating business segments
- 9.10.5. Product portfolio
- 9.10.6. Business performance
LIST OF TABLES
- TABLE 01. GLOBAL VACUUM CIRCUIT BREAKER MARKET, BY VOLTAGE, 2022-2032 ($MILLION)
- TABLE 02. VACUUM CIRCUIT BREAKER MARKET FOR MEDIUM VOLTAGE, BY REGION, 2022-2032 ($MILLION)
- TABLE 03. VACUUM CIRCUIT BREAKER MARKET FOR HIGH VOLTAGE, BY REGION, 2022-2032 ($MILLION)
- TABLE 04. GLOBAL VACUUM CIRCUIT BREAKER MARKET, BY INSTALLATION LOCATION, 2022-2032 ($MILLION)
- TABLE 05. VACUUM CIRCUIT BREAKER MARKET FOR INDOOR, BY REGION, 2022-2032 ($MILLION)
- TABLE 06. VACUUM CIRCUIT BREAKER MARKET FOR OUTDOOR, BY REGION, 2022-2032 ($MILLION)
- TABLE 07. GLOBAL VACUUM CIRCUIT BREAKER MARKET, BY END USE INDUSTRY, 2022-2032 ($MILLION)
- TABLE 08. VACUUM CIRCUIT BREAKER MARKET FOR RESIDENTIAL, BY REGION, 2022-2032 ($MILLION)
- TABLE 09. VACUUM CIRCUIT BREAKER MARKET FOR COMMERCIAL, BY REGION, 2022-2032 ($MILLION)
- TABLE 10. VACUUM CIRCUIT BREAKER MARKET FOR INDUSTRIAL, BY REGION, 2022-2032 ($MILLION)
- TABLE 11. VACUUM CIRCUIT BREAKER MARKET FOR UTILITIES, BY REGION, 2022-2032 ($MILLION)
- TABLE 12. VACUUM CIRCUIT BREAKER MARKET, BY REGION, 2022-2032 ($MILLION)
- TABLE 13. NORTH AMERICA VACUUM CIRCUIT BREAKER MARKET, BY VOLTAGE, 2022-2032 ($MILLION)
- TABLE 14. NORTH AMERICA VACUUM CIRCUIT BREAKER MARKET, BY INSTALLATION LOCATION, 2022-2032 ($MILLION)
- TABLE 15. NORTH AMERICA VACUUM CIRCUIT BREAKER MARKET, BY END USE INDUSTRY, 2022-2032 ($MILLION)
- TABLE 16. NORTH AMERICA VACUUM CIRCUIT BREAKER MARKET, BY COUNTRY, 2022-2032 ($MILLION)
- TABLE 17. U.S. VACUUM CIRCUIT BREAKER MARKET, BY VOLTAGE, 2022-2032 ($MILLION)
- TABLE 18. U.S. VACUUM CIRCUIT BREAKER MARKET, BY INSTALLATION LOCATION, 2022-2032 ($MILLION)
- TABLE 19. U.S. VACUUM CIRCUIT BREAKER MARKET, BY END USE INDUSTRY, 2022-2032 ($MILLION)
- TABLE 20. CANADA VACUUM CIRCUIT BREAKER MARKET, BY VOLTAGE, 2022-2032 ($MILLION)
- TABLE 21. CANADA VACUUM CIRCUIT BREAKER MARKET, BY INSTALLATION LOCATION, 2022-2032 ($MILLION)
- TABLE 22. CANADA VACUUM CIRCUIT BREAKER MARKET, BY END USE INDUSTRY, 2022-2032 ($MILLION)
- TABLE 23. MEXICO VACUUM CIRCUIT BREAKER MARKET, BY VOLTAGE, 2022-2032 ($MILLION)
- TABLE 24. MEXICO VACUUM CIRCUIT BREAKER MARKET, BY INSTALLATION LOCATION, 2022-2032 ($MILLION)
- TABLE 25. MEXICO VACUUM CIRCUIT BREAKER MARKET, BY END USE INDUSTRY, 2022-2032 ($MILLION)
- TABLE 26. EUROPE VACUUM CIRCUIT BREAKER MARKET, BY VOLTAGE, 2022-2032 ($MILLION)
- TABLE 27. EUROPE VACUUM CIRCUIT BREAKER MARKET, BY INSTALLATION LOCATION, 2022-2032 ($MILLION)
- TABLE 28. EUROPE VACUUM CIRCUIT BREAKER MARKET, BY END USE INDUSTRY, 2022-2032 ($MILLION)
- TABLE 29. EUROPE VACUUM CIRCUIT BREAKER MARKET, BY COUNTRY, 2022-2032 ($MILLION)
- TABLE 30. UK VACUUM CIRCUIT BREAKER MARKET, BY VOLTAGE, 2022-2032 ($MILLION)
- TABLE 31. UK VACUUM CIRCUIT BREAKER MARKET, BY INSTALLATION LOCATION, 2022-2032 ($MILLION)
- TABLE 32. UK VACUUM CIRCUIT BREAKER MARKET, BY END USE INDUSTRY, 2022-2032 ($MILLION)
- TABLE 33. GERMANY VACUUM CIRCUIT BREAKER MARKET, BY VOLTAGE, 2022-2032 ($MILLION)
- TABLE 34. GERMANY VACUUM CIRCUIT BREAKER MARKET, BY INSTALLATION LOCATION, 2022-2032 ($MILLION)
- TABLE 35. GERMANY VACUUM CIRCUIT BREAKER MARKET, BY END USE INDUSTRY, 2022-2032 ($MILLION)
- TABLE 36. FRANCE VACUUM CIRCUIT BREAKER MARKET, BY VOLTAGE, 2022-2032 ($MILLION)
- TABLE 37. FRANCE VACUUM CIRCUIT BREAKER MARKET, BY INSTALLATION LOCATION, 2022-2032 ($MILLION)
- TABLE 38. FRANCE VACUUM CIRCUIT BREAKER MARKET, BY END USE INDUSTRY, 2022-2032 ($MILLION)
- TABLE 39. SPAIN VACUUM CIRCUIT BREAKER MARKET, BY VOLTAGE, 2022-2032 ($MILLION)
- TABLE 40. SPAIN VACUUM CIRCUIT BREAKER MARKET, BY INSTALLATION LOCATION, 2022-2032 ($MILLION)
- TABLE 41. SPAIN VACUUM CIRCUIT BREAKER MARKET, BY END USE INDUSTRY, 2022-2032 ($MILLION)
- TABLE 42. ITALY VACUUM CIRCUIT BREAKER MARKET, BY VOLTAGE, 2022-2032 ($MILLION)
- TABLE 43. ITALY VACUUM CIRCUIT BREAKER MARKET, BY INSTALLATION LOCATION, 2022-2032 ($MILLION)
- TABLE 44. ITALY VACUUM CIRCUIT BREAKER MARKET, BY END USE INDUSTRY, 2022-2032 ($MILLION)
- TABLE 45. REST OF EUROPE VACUUM CIRCUIT BREAKER MARKET, BY VOLTAGE, 2022-2032 ($MILLION)
- TABLE 46. REST OF EUROPE VACUUM CIRCUIT BREAKER MARKET, BY INSTALLATION LOCATION, 2022-2032 ($MILLION)
- TABLE 47. REST OF EUROPE VACUUM CIRCUIT BREAKER MARKET, BY END USE INDUSTRY, 2022-2032 ($MILLION)
- TABLE 48. ASIA-PACIFIC VACUUM CIRCUIT BREAKER MARKET, BY VOLTAGE, 2022-2032 ($MILLION)
- TABLE 49. ASIA-PACIFIC VACUUM CIRCUIT BREAKER MARKET, BY INSTALLATION LOCATION, 2022-2032 ($MILLION)
- TABLE 50. ASIA-PACIFIC VACUUM CIRCUIT BREAKER MARKET, BY END USE INDUSTRY, 2022-2032 ($MILLION)
- TABLE 51. ASIA-PACIFIC VACUUM CIRCUIT BREAKER MARKET, BY COUNTRY, 2022-2032 ($MILLION)
- TABLE 52. CHINA VACUUM CIRCUIT BREAKER MARKET, BY VOLTAGE, 2022-2032 ($MILLION)
- TABLE 53. CHINA VACUUM CIRCUIT BREAKER MARKET, BY INSTALLATION LOCATION, 2022-2032 ($MILLION)
- TABLE 54. CHINA VACUUM CIRCUIT BREAKER MARKET, BY END USE INDUSTRY, 2022-2032 ($MILLION)
- TABLE 55. JAPAN VACUUM CIRCUIT BREAKER MARKET, BY VOLTAGE, 2022-2032 ($MILLION)
- TABLE 56. JAPAN VACUUM CIRCUIT BREAKER MARKET, BY INSTALLATION LOCATION, 2022-2032 ($MILLION)
- TABLE 57. JAPAN VACUUM CIRCUIT BREAKER MARKET, BY END USE INDUSTRY, 2022-2032 ($MILLION)
- TABLE 58. INDIA VACUUM CIRCUIT BREAKER MARKET, BY VOLTAGE, 2022-2032 ($MILLION)
- TABLE 59. INDIA VACUUM CIRCUIT BREAKER MARKET, BY INSTALLATION LOCATION, 2022-2032 ($MILLION)
- TABLE 60. INDIA VACUUM CIRCUIT BREAKER MARKET, BY END USE INDUSTRY, 2022-2032 ($MILLION)
- TABLE 61. SOUTH KOREA VACUUM CIRCUIT BREAKER MARKET, BY VOLTAGE, 2022-2032 ($MILLION)
- TABLE 62. SOUTH KOREA VACUUM CIRCUIT BREAKER MARKET, BY INSTALLATION LOCATION, 2022-2032 ($MILLION)
- TABLE 63. SOUTH KOREA VACUUM CIRCUIT BREAKER MARKET, BY END USE INDUSTRY, 2022-2032 ($MILLION)
- TABLE 64. REST OF ASIA-PACIFIC VACUUM CIRCUIT BREAKER MARKET, BY VOLTAGE, 2022-2032 ($MILLION)
- TABLE 65. REST OF ASIA-PACIFIC VACUUM CIRCUIT BREAKER MARKET, BY INSTALLATION LOCATION, 2022-2032 ($MILLION)
- TABLE 66. REST OF ASIA-PACIFIC VACUUM CIRCUIT BREAKER MARKET, BY END USE INDUSTRY, 2022-2032 ($MILLION)
- TABLE 67. LAMEA VACUUM CIRCUIT BREAKER MARKET, BY VOLTAGE, 2022-2032 ($MILLION)
- TABLE 68. LAMEA VACUUM CIRCUIT BREAKER MARKET, BY INSTALLATION LOCATION, 2022-2032 ($MILLION)
- TABLE 69. LAMEA VACUUM CIRCUIT BREAKER MARKET, BY END USE INDUSTRY, 2022-2032 ($MILLION)
- TABLE 70. LAMEA VACUUM CIRCUIT BREAKER MARKET, BY COUNTRY, 2022-2032 ($MILLION)
- TABLE 71. LATIN AMERICA VACUUM CIRCUIT BREAKER MARKET, BY VOLTAGE, 2022-2032 ($MILLION)
- TABLE 72. LATIN AMERICA VACUUM CIRCUIT BREAKER MARKET, BY INSTALLATION LOCATION, 2022-2032 ($MILLION)
- TABLE 73. LATIN AMERICA VACUUM CIRCUIT BREAKER MARKET, BY END USE INDUSTRY, 2022-2032 ($MILLION)
- TABLE 74. MIDDLE EAST VACUUM CIRCUIT BREAKER MARKET, BY VOLTAGE, 2022-2032 ($MILLION)
- TABLE 75. MIDDLE EAST VACUUM CIRCUIT BREAKER MARKET, BY INSTALLATION LOCATION, 2022-2032 ($MILLION)
- TABLE 76. MIDDLE EAST VACUUM CIRCUIT BREAKER MARKET, BY END USE INDUSTRY, 2022-2032 ($MILLION)
- TABLE 77. AFRICA VACUUM CIRCUIT BREAKER MARKET, BY VOLTAGE, 2022-2032 ($MILLION)
- TABLE 78. AFRICA VACUUM CIRCUIT BREAKER MARKET, BY INSTALLATION LOCATION, 2022-2032 ($MILLION)
- TABLE 79. AFRICA VACUUM CIRCUIT BREAKER MARKET, BY END USE INDUSTRY, 2022-2032 ($MILLION)
- TABLE 80. ABB: KEY EXECUTIVES
- TABLE 81. ABB: COMPANY SNAPSHOT
- TABLE 82. ABB: PRODUCT SEGMENTS
- TABLE 83. ABB: PRODUCT PORTFOLIO
- TABLE 84. ARTECHE: KEY EXECUTIVES
- TABLE 85. ARTECHE: COMPANY SNAPSHOT
- TABLE 86. ARTECHE: SERVICE SEGMENTS
- TABLE 87. ARTECHE: PRODUCT PORTFOLIO
- TABLE 88. ARTECHE: KEY STRATERGIES
- TABLE 89. EATON: KEY EXECUTIVES
- TABLE 90. EATON: COMPANY SNAPSHOT
- TABLE 91. EATON: SERVICE SEGMENTS
- TABLE 92. EATON: PRODUCT PORTFOLIO
- TABLE 93. FUJI ELECTRIC CO., LTD.: KEY EXECUTIVES
- TABLE 94. FUJI ELECTRIC CO., LTD.: COMPANY SNAPSHOT
- TABLE 95. FUJI ELECTRIC CO., LTD.: PRODUCT SEGMENTS
- TABLE 96. FUJI ELECTRIC CO., LTD.: PRODUCT PORTFOLIO
- TABLE 97. HUAYI ELECTRIC CO., LTD.: KEY EXECUTIVES
- TABLE 98. HUAYI ELECTRIC CO., LTD.: COMPANY SNAPSHOT
- TABLE 99. HUAYI ELECTRIC CO., LTD.: PRODUCT SEGMENTS
- TABLE 100. HUAYI ELECTRIC CO., LTD.: PRODUCT PORTFOLIO
- TABLE 101. LEGRAND: KEY EXECUTIVES
- TABLE 102. LEGRAND: COMPANY SNAPSHOT
- TABLE 103. LEGRAND: SERVICE SEGMENTS
- TABLE 104. LEGRAND: PRODUCT PORTFOLIO
- TABLE 105. MITSUBISHI ELECTRIC CORPORATION: KEY EXECUTIVES
- TABLE 106. MITSUBISHI ELECTRIC CORPORATION: COMPANY SNAPSHOT
- TABLE 107. MITSUBISHI ELECTRIC CORPORATION: PRODUCT SEGMENTS
- TABLE 108. MITSUBISHI ELECTRIC CORPORATION: PRODUCT PORTFOLIO
- TABLE 109. MITSUBISHI ELECTRIC CORPORATION: KEY STRATERGIES
- TABLE 110. SCHNEIDER ELECTRIC: KEY EXECUTIVES
- TABLE 111. SCHNEIDER ELECTRIC: COMPANY SNAPSHOT
- TABLE 112. SCHNEIDER ELECTRIC: SERVICE SEGMENTS
- TABLE 113. SCHNEIDER ELECTRIC: PRODUCT PORTFOLIO
- TABLE 114. SCHNEIDER ELECTRIC: KEY STRATERGIES
- TABLE 115. SIEMENS: KEY EXECUTIVES
- TABLE 116. SIEMENS: COMPANY SNAPSHOT
- TABLE 117. SIEMENS: PRODUCT SEGMENTS
- TABLE 118. SIEMENS: PRODUCT PORTFOLIO
- TABLE 119. TOSHIBA ENERGY SYSTEMS & SOLUTIONS CORPORATION: KEY EXECUTIVES
- TABLE 120. TOSHIBA ENERGY SYSTEMS & SOLUTIONS CORPORATION: COMPANY SNAPSHOT
- TABLE 121. TOSHIBA ENERGY SYSTEMS & SOLUTIONS CORPORATION: SERVICE SEGMENTS
- TABLE 122. TOSHIBA ENERGY SYSTEMS & SOLUTIONS CORPORATION: PRODUCT PORTFOLIO
LIST OF FIGURES
- FIGURE 01. VACUUM CIRCUIT BREAKER MARKET, 2022-2032
- FIGURE 02. SEGMENTATION OF VACUUM CIRCUIT BREAKER MARKET, 2022-2032
- FIGURE 03. TOP INVESTMENT POCKETS IN VACUUM CIRCUIT BREAKER MARKET (2023-2032)
- FIGURE 04. MODERATE TO HIGH BARGAINING POWER OF SUPPLIERS
- FIGURE 05. LOW BARGAINING POWER OF BUYERS
- FIGURE 06. MODERATE TO HIGH THREAT OF SUBSTITUTES
- FIGURE 07. MODERATE TO HIGH THREAT OF NEW ENTRANTS
- FIGURE 08. MODERATE TO HIGH INTENSITY OF RIVALRY
- FIGURE 09. DRIVERS, RESTRAINTS AND OPPORTUNITIES: GLOBALVACUUM CIRCUIT BREAKER MARKET
- FIGURE 10. VACUUM CIRCUIT BREAKER MARKET, BY VOLTAGE, 2022(%)
- FIGURE 11. COMPARATIVE SHARE ANALYSIS OF VACUUM CIRCUIT BREAKER MARKET FOR MEDIUM VOLTAGE, BY COUNTRY 2022 AND 2032(%)
- FIGURE 12. COMPARATIVE SHARE ANALYSIS OF VACUUM CIRCUIT BREAKER MARKET FOR HIGH VOLTAGE, BY COUNTRY 2022 AND 2032(%)
- FIGURE 13. VACUUM CIRCUIT BREAKER MARKET, BY INSTALLATION LOCATION, 2022(%)
- FIGURE 14. COMPARATIVE SHARE ANALYSIS OF VACUUM CIRCUIT BREAKER MARKET FOR INDOOR, BY COUNTRY 2022 AND 2032(%)
- FIGURE 15. COMPARATIVE SHARE ANALYSIS OF VACUUM CIRCUIT BREAKER MARKET FOR OUTDOOR, BY COUNTRY 2022 AND 2032(%)
- FIGURE 16. VACUUM CIRCUIT BREAKER MARKET, BY END USE INDUSTRY, 2022(%)
- FIGURE 17. COMPARATIVE SHARE ANALYSIS OF VACUUM CIRCUIT BREAKER MARKET FOR RESIDENTIAL, BY COUNTRY 2022 AND 2032(%)
- FIGURE 18. COMPARATIVE SHARE ANALYSIS OF VACUUM CIRCUIT BREAKER MARKET FOR COMMERCIAL, BY COUNTRY 2022 AND 2032(%)
- FIGURE 19. COMPARATIVE SHARE ANALYSIS OF VACUUM CIRCUIT BREAKER MARKET FOR INDUSTRIAL, BY COUNTRY 2022 AND 2032(%)
- FIGURE 20. COMPARATIVE SHARE ANALYSIS OF VACUUM CIRCUIT BREAKER MARKET FOR UTILITIES, BY COUNTRY 2022 AND 2032(%)
- FIGURE 21. VACUUM CIRCUIT BREAKER MARKET BY REGION, 2022
- FIGURE 22. U.S. VACUUM CIRCUIT BREAKER MARKET, 2022-2032 ($MILLION)
- FIGURE 23. CANADA VACUUM CIRCUIT BREAKER MARKET, 2022-2032 ($MILLION)
- FIGURE 24. MEXICO VACUUM CIRCUIT BREAKER MARKET, 2022-2032 ($MILLION)
- FIGURE 25. UK VACUUM CIRCUIT BREAKER MARKET, 2022-2032 ($MILLION)
- FIGURE 26. GERMANY VACUUM CIRCUIT BREAKER MARKET, 2022-2032 ($MILLION)
- FIGURE 27. FRANCE VACUUM CIRCUIT BREAKER MARKET, 2022-2032 ($MILLION)
- FIGURE 28. SPAIN VACUUM CIRCUIT BREAKER MARKET, 2022-2032 ($MILLION)
- FIGURE 29. ITALY VACUUM CIRCUIT BREAKER MARKET, 2022-2032 ($MILLION)
- FIGURE 30. REST OF EUROPE VACUUM CIRCUIT BREAKER MARKET, 2022-2032 ($MILLION)
- FIGURE 31. CHINA VACUUM CIRCUIT BREAKER MARKET, 2022-2032 ($MILLION)
- FIGURE 32. JAPAN VACUUM CIRCUIT BREAKER MARKET, 2022-2032 ($MILLION)
- FIGURE 33. INDIA VACUUM CIRCUIT BREAKER MARKET, 2022-2032 ($MILLION)
- FIGURE 34. SOUTH KOREA VACUUM CIRCUIT BREAKER MARKET, 2022-2032 ($MILLION)
- FIGURE 35. REST OF ASIA-PACIFIC VACUUM CIRCUIT BREAKER MARKET, 2022-2032 ($MILLION)
- FIGURE 36. LATIN AMERICA VACUUM CIRCUIT BREAKER MARKET, 2022-2032 ($MILLION)
- FIGURE 37. MIDDLE EAST VACUUM CIRCUIT BREAKER MARKET, 2022-2032 ($MILLION)
- FIGURE 38. AFRICA VACUUM CIRCUIT BREAKER MARKET, 2022-2032 ($MILLION)
- FIGURE 39. TOP WINNING STRATEGIES, BY YEAR
- FIGURE 40. TOP WINNING STRATEGIES, BY DEVELOPMENT
- FIGURE 41. TOP WINNING STRATEGIES, BY COMPANY
- FIGURE 42. PRODUCT MAPPING OF TOP 10 PLAYERS
- FIGURE 43. COMPETITIVE DASHBOARD
- FIGURE 44. COMPETITIVE HEATMAP: VACUUM CIRCUIT BREAKER MARKET
- FIGURE 45. TOP PLAYER POSITIONING, 2022
- FIGURE 46. ABB: NET REVENUE, 2020-2022 ($MILLION)
- FIGURE 47. ABB: REVENUE SHARE BY SEGMENT, 2022 (%)
- FIGURE 48. ABB: REVENUE SHARE BY REGION, 2022 (%)
- FIGURE 49. ARTECHE: NET REVENUE, 2020-2022 ($MILLION)
- FIGURE 50. EATON: NET SALES, 2020-2022 ($MILLION)
- FIGURE 51. EATON: RESEARCH & DEVELOPMENT EXPENDITURE, 2020-2022 ($MILLION)
- FIGURE 52. EATON: REVENUE SHARE BY REGION, 2022 (%)
- FIGURE 53. EATON: REVENUE SHARE BY SEGMENT, 2022 (%)
- FIGURE 54. FUJI ELECTRIC CO., LTD.: NET SALES, 2020-2022 ($MILLION)
- FIGURE 55. FUJI ELECTRIC CO., LTD.: RESEARCH & DEVELOPMENT EXPENDITURE, 2020-2022 ($MILLION)
- FIGURE 56. FUJI ELECTRIC CO., LTD.: REVENUE SHARE BY REGION, 2022 (%)
- FIGURE 57. FUJI ELECTRIC CO., LTD.: REVENUE SHARE BY SEGMENT, 2022 (%)
- FIGURE 58. LEGRAND: NET SALES, 2020-2022 ($MILLION)
- FIGURE 59. LEGRAND: RESEARCH & DEVELOPMENT EXPENDITURE, 2020-2022 ($MILLION)
- FIGURE 60. LEGRAND: REVENUE SHARE BY REGION, 2022 (%)
- FIGURE 61. MITSUBISHI ELECTRIC CORPORATION: NET REVENUE, 2020-2022 ($MILLION)
- FIGURE 62. MITSUBISHI ELECTRIC CORPORATION: RESEARCH & DEVELOPMENT EXPENDITURE, 2020-2022 ($MILLION)
- FIGURE 63. MITSUBISHI ELECTRIC CORPORATION: REVENUE SHARE BY SEGMENT, 2022 (%)
- FIGURE 64. MITSUBISHI ELECTRIC CORPORATION: REVENUE SHARE BY REGION, 2022 (%)
- FIGURE 65. SCHNEIDER ELECTRIC: NET REVENUE, 2020-2022 ($MILLION)
- FIGURE 66. SCHNEIDER ELECTRIC: REVENUE SHARE BY SEGMENT, 2022 (%)
- FIGURE 67. SCHNEIDER ELECTRIC: REVENUE SHARE BY REGION, 2022 (%)
- FIGURE 68. SIEMENS: NET REVENUE, 2020-2022 ($MILLION)
- FIGURE 69. SIEMENS: REVENUE SHARE BY SEGMENT, 2022 (%)
- FIGURE 70. SIEMENS: REVENUE SHARE BY REGION, 2022 (%)
- FIGURE 71. TOSHIBA ENERGY SYSTEMS & SOLUTIONS CORPORATION: NET REVENUE, 2020-2022 ($MILLION)
- FIGURE 72. TOSHIBA ENERGY SYSTEMS & SOLUTIONS CORPORATION: RESEARCH & DEVELOPMENT EXPENDITURE, 2020-2022 ($MILL
- FIGURE 73. TOSHIBA ENERGY SYSTEMS & SOLUTIONS CORPORATION: REVENUE SHARE BY SEGMENT, 2022 (%)
- FIGURE 74. TOSHIBA ENERGY SYSTEMS & SOLUTIONS CORPORATION: REVENUE SHARE BY REGION, 2022 (%)

