
PUBLISHER: Allied Market Research | PRODUCT CODE: 1365582

PUBLISHER: Allied Market Research | PRODUCT CODE: 1365582
Biomass Boiler Market By Feedstock Type (Woody Biomass, Agriculture and Forest Residues, Biogas and Energy Crops, Urban Residues), By End-Use (Residential, Commercial, Industrial): Global Opportunity Analysis and Industry Forecast, 2023-2032
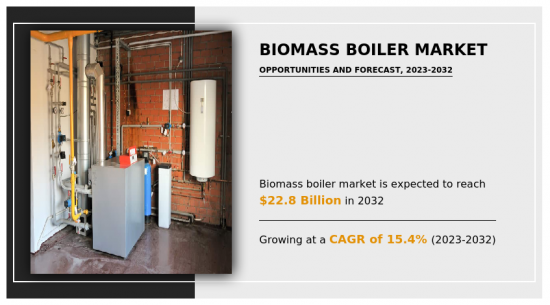
According to a new report published by Allied Market Research, titled, "Biomass Boiler Market," The biomass boiler market was valued at $5.5 billion in 2022, and is estimated to reach $22.8 billion by 2032, growing at a CAGR of 15.4% from 2023 to 2032.
A biomass boiler is a type of boiler that uses organic materials derived from plants or animal waste as fuel to generate heat or electricity. It works by burning biomass fuel in a combustion chamber, transferring the released heat to water, and producing steam or hot water for heating purposes or power generation. Biomass boilers can utilize a wide range of biomass feedstocks such as wood pellets, wood chips, agricultural residues such as straw or corn stover, energy crops such as switchgrass or miscanthus, and even dedicated biomass crops grown specifically for energy production.
These boilers consist of components such as fuel storage, a fuel delivery system, a combustion chamber, heat exchangers, control systems, and emission control technologies. Biomass boilers provide a sustainable and environment-friendly alternative to fossil fuel-based boilers by harnessing renewable biomass resources. They contribute toward reducing carbon emissions, promoting energy security, and utilizing locally available biomass materials. Biomass boilers have a wide range of applications across various sectors. These boilers are used to generate heat or electricity by burning organic materials derived from plants or animal waste. One of the primary use of biomass boilers is for heating homes and buildings. They are used in residential, commercial, and industrial settings, providing efficient and sustainable space heating solutions.
The biomass boiler industry is segmented on the basis of feedstock, end user, and region. By feedstock, the market is segmented into woody biomass, agricultural & forest residue, urban residue, and biogas & energy crops. By end user, the market is divided into residential, commercial, and industrial. By region, the market is analyzed across North America, Europe, Asia-Pacific, and LAMEA.
The report covers strategies adopted by key players in the market to sustain the competitive environment and increase their biomass boiler market share. The key players operating in the biomass boiler market include Viessmann Group, ETA Heiztechnik GmbH, HARGASSNER GesmbH, Guntamatic Heiztechnik GmbH, Froling Heizkessel- und Behalterbau Ges.m.b.H., Woodco, Thermax Limited., Forbes Marshall, Hurst Boiler & Welding Co, Inc., and HDG Bavaria GmbH. In addition, the market drivers, restraints, and opportunities are explained in the report.
Key Benefits For Stakeholders
- This report provides a quantitative analysis of the market segments, current trends, estimations, and dynamics of the biomass boiler market analysis from 2022 to 2032 to identify the prevailing biomass boiler market opportunities.
- The market research is offered along with information related to key drivers, restraints, and opportunities.
- Porter's five forces analysis highlights the potency of buyers and suppliers to enable stakeholders make profit-oriented business decisions and strengthen their supplier-buyer network.
- In-depth analysis of the biomass boiler market segmentation assists to determine the prevailing market size.
- Major countries in each region are mapped according to their revenue contribution to the global market.
- Market player positioning facilitates benchmarking and provides a clear understanding of the present position of the market players.
- The report includes the analysis of the regional as well as global biomass boiler market trends, key players, market segments, application areas, and biomass boiler market growth strategies.
Additional benefits you will get with this purchase are:
- Quarterly Update and* (only available with a corporate license, on listed price)
- 5 additional Company Profile of client Choice pre- or Post-purchase, as a free update.
- Free Upcoming Version on the Purchase of Five and Enterprise User License.
- 16 analyst hours of support* (post-purchase, if you find additional data requirements upon review of the report, you may receive support amounting to 16 analyst hours to solve questions, and post-sale queries)
- 15% Free Customization* (in case the scope or segment of the report does not match your requirements, 20% is equivalent to 3 working days of free work, applicable once)
- Free data Pack on the Five and Enterprise User License. (Excel version of the report)
- Free Updated report if the report is 6-12 months old or older.
- 24-hour priority response*
- Free Industry updates and white papers.
Possible Customization with this report (with additional cost and timeline talk to the sales executive to know more)
- End user preferences and pain points
- Technology Trend Analysis
- New Product Development/ Product Matrix of Key Players
- Regulatory Guidelines
- Strategic Recommedations
- Additional company profiles with specific to client's interest
- Additional country or region analysis- market size and forecast
- Expanded list for Company Profiles
- Historic market data
- Key player details (including location, contact details, supplier/vendor network etc. in excel format)
- List of customers/consumers/raw material suppliers- value chain analysis
- Market share analysis of players at global/region/country level
Key Market Segments
By Feedstock Type
- Woody Biomass
- Agriculture and Forest Residues
- Biogas and Energy Crops
- Urban Residues
By End-Use
- Residential
- Commercial
- Industrial
By Region
- North America
- U.S.
- Canada
- Mexico
- Europe
- Germany
- France
- Italy
- Spain
- UK
- Rest of Europe
- Asia-Pacific
- China
- Japan
- India
- South Korea
- Australia
- Rest of Asia-Pacific
- LAMEA
- Brazil
- Saudi Arabia
- South Africa
- Rest of LAMEA
Key Market Players:
- Viessmann Group
- HDG Bavaria GmbH
- HARGASSNER GesmbH
- Woodco
- Thermax Limited
- Guntamatic Heiztechnik GmbH
- Forbes Marshall Private Limited
- ETA Heiztechnik GmbH
- Froling Heizkessel- und Behalterbau Ges.m.b.H.
- Hurst Boiler & Welding Co, Inc.
TABLE OF CONTENTS
CHAPTER 1: INTRODUCTION
- 1.1. Report description
- 1.2. Key market segments
- 1.3. Key benefits to the stakeholders
- 1.4. Research Methodology
- 1.4.1. Primary research
- 1.4.2. Secondary research
- 1.4.3. Analyst tools and models
CHAPTER 2: EXECUTIVE SUMMARY
- 2.1. CXO Perspective
CHAPTER 3: MARKET OVERVIEW
- 3.1. Market definition and scope
- 3.2. Key findings
- 3.2.1. Top impacting factors
- 3.2.2. Top investment pockets
- 3.3. Porter's five forces analysis
- 3.3.1. Low bargaining power of suppliers
- 3.3.2. Low threat of new entrants
- 3.3.3. Low threat of substitutes
- 3.3.4. Low intensity of rivalry
- 3.3.5. Low bargaining power of buyers
- 3.4. Market dynamics
- 3.4.1. Drivers
- 3.4.1.1. Increase in focus toward decarbonization
- 3.4.1.2. Rise in energy efficiency and technological advancements
- 3.4.1. Drivers
- 3.4.2. Restraints
- 3.4.2.1. Emission of pollutants and ash deposition
- 3.4.3. Opportunities
- 3.4.3.1. Favorable Government Incentives and Policies
- 3.4.3.2. Waste utilization and circular economy
- 3.5. COVID-19 Impact Analysis on the market
- 3.6. Value Chain Analysis
- 3.7. Key Regulation Analysis
- 3.8. Patent Landscape
CHAPTER 4: BIOMASS BOILER MARKET, BY FEEDSTOCK TYPE
- 4.1. Overview
- 4.1.1. Market size and forecast
- 4.2. Woody Biomass
- 4.2.1. Key market trends, growth factors and opportunities
- 4.2.2. Market size and forecast, by region
- 4.2.3. Market share analysis by country
- 4.3. Agriculture and Forest Residues
- 4.3.1. Key market trends, growth factors and opportunities
- 4.3.2. Market size and forecast, by region
- 4.3.3. Market share analysis by country
- 4.4. Biogas and Energy Crops
- 4.4.1. Key market trends, growth factors and opportunities
- 4.4.2. Market size and forecast, by region
- 4.4.3. Market share analysis by country
- 4.5. Urban Residues
- 4.5.1. Key market trends, growth factors and opportunities
- 4.5.2. Market size and forecast, by region
- 4.5.3. Market share analysis by country
CHAPTER 5: BIOMASS BOILER MARKET, BY END-USE
- 5.1. Overview
- 5.1.1. Market size and forecast
- 5.2. Residential
- 5.2.1. Key market trends, growth factors and opportunities
- 5.2.2. Market size and forecast, by region
- 5.2.3. Market share analysis by country
- 5.3. Commercial
- 5.3.1. Key market trends, growth factors and opportunities
- 5.3.2. Market size and forecast, by region
- 5.3.3. Market share analysis by country
- 5.4. Industrial
- 5.4.1. Key market trends, growth factors and opportunities
- 5.4.2. Market size and forecast, by region
- 5.4.3. Market share analysis by country
CHAPTER 6: BIOMASS BOILER MARKET, BY REGION
- 6.1. Overview
- 6.1.1. Market size and forecast By Region
- 6.2. North America
- 6.2.1. Key trends and opportunities
- 6.2.2. Market size and forecast, by Feedstock Type
- 6.2.3. Market size and forecast, by End-Use
- 6.2.4. Market size and forecast, by country
- 6.2.4.1. U.S.
- 6.2.4.1.1. Key market trends, growth factors and opportunities
- 6.2.4.1.2. Market size and forecast, by Feedstock Type
- 6.2.4.1.3. Market size and forecast, by End-Use
- 6.2.4.2. Canada
- 6.2.4.2.1. Key market trends, growth factors and opportunities
- 6.2.4.2.2. Market size and forecast, by Feedstock Type
- 6.2.4.2.3. Market size and forecast, by End-Use
- 6.2.4.3. Mexico
- 6.2.4.3.1. Key market trends, growth factors and opportunities
- 6.2.4.3.2. Market size and forecast, by Feedstock Type
- 6.2.4.3.3. Market size and forecast, by End-Use
- 6.3. Europe
- 6.3.1. Key trends and opportunities
- 6.3.2. Market size and forecast, by Feedstock Type
- 6.3.3. Market size and forecast, by End-Use
- 6.3.4. Market size and forecast, by country
- 6.3.4.1. Germany
- 6.3.4.1.1. Key market trends, growth factors and opportunities
- 6.3.4.1.2. Market size and forecast, by Feedstock Type
- 6.3.4.1.3. Market size and forecast, by End-Use
- 6.3.4.2. France
- 6.3.4.2.1. Key market trends, growth factors and opportunities
- 6.3.4.2.2. Market size and forecast, by Feedstock Type
- 6.3.4.2.3. Market size and forecast, by End-Use
- 6.3.4.3. Italy
- 6.3.4.3.1. Key market trends, growth factors and opportunities
- 6.3.4.3.2. Market size and forecast, by Feedstock Type
- 6.3.4.3.3. Market size and forecast, by End-Use
- 6.3.4.4. Spain
- 6.3.4.4.1. Key market trends, growth factors and opportunities
- 6.3.4.4.2. Market size and forecast, by Feedstock Type
- 6.3.4.4.3. Market size and forecast, by End-Use
- 6.3.4.5. UK
- 6.3.4.5.1. Key market trends, growth factors and opportunities
- 6.3.4.5.2. Market size and forecast, by Feedstock Type
- 6.3.4.5.3. Market size and forecast, by End-Use
- 6.3.4.6. Rest of Europe
- 6.3.4.6.1. Key market trends, growth factors and opportunities
- 6.3.4.6.2. Market size and forecast, by Feedstock Type
- 6.3.4.6.3. Market size and forecast, by End-Use
- 6.4. Asia-Pacific
- 6.4.1. Key trends and opportunities
- 6.4.2. Market size and forecast, by Feedstock Type
- 6.4.3. Market size and forecast, by End-Use
- 6.4.4. Market size and forecast, by country
- 6.4.4.1. China
- 6.4.4.1.1. Key market trends, growth factors and opportunities
- 6.4.4.1.2. Market size and forecast, by Feedstock Type
- 6.4.4.1.3. Market size and forecast, by End-Use
- 6.4.4.2. Japan
- 6.4.4.2.1. Key market trends, growth factors and opportunities
- 6.4.4.2.2. Market size and forecast, by Feedstock Type
- 6.4.4.2.3. Market size and forecast, by End-Use
- 6.4.4.3. India
- 6.4.4.3.1. Key market trends, growth factors and opportunities
- 6.4.4.3.2. Market size and forecast, by Feedstock Type
- 6.4.4.3.3. Market size and forecast, by End-Use
- 6.4.4.4. South Korea
- 6.4.4.4.1. Key market trends, growth factors and opportunities
- 6.4.4.4.2. Market size and forecast, by Feedstock Type
- 6.4.4.4.3. Market size and forecast, by End-Use
- 6.4.4.5. Australia
- 6.4.4.5.1. Key market trends, growth factors and opportunities
- 6.4.4.5.2. Market size and forecast, by Feedstock Type
- 6.4.4.5.3. Market size and forecast, by End-Use
- 6.4.4.6. Rest of Asia-Pacific
- 6.4.4.6.1. Key market trends, growth factors and opportunities
- 6.4.4.6.2. Market size and forecast, by Feedstock Type
- 6.4.4.6.3. Market size and forecast, by End-Use
- 6.5. LAMEA
- 6.5.1. Key trends and opportunities
- 6.5.2. Market size and forecast, by Feedstock Type
- 6.5.3. Market size and forecast, by End-Use
- 6.5.4. Market size and forecast, by country
- 6.5.4.1. Brazil
- 6.5.4.1.1. Key market trends, growth factors and opportunities
- 6.5.4.1.2. Market size and forecast, by Feedstock Type
- 6.5.4.1.3. Market size and forecast, by End-Use
- 6.5.4.2. Saudi Arabia
- 6.5.4.2.1. Key market trends, growth factors and opportunities
- 6.5.4.2.2. Market size and forecast, by Feedstock Type
- 6.5.4.2.3. Market size and forecast, by End-Use
- 6.5.4.3. South Africa
- 6.5.4.3.1. Key market trends, growth factors and opportunities
- 6.5.4.3.2. Market size and forecast, by Feedstock Type
- 6.5.4.3.3. Market size and forecast, by End-Use
- 6.5.4.4. Rest of LAMEA
- 6.5.4.4.1. Key market trends, growth factors and opportunities
- 6.5.4.4.2. Market size and forecast, by Feedstock Type
- 6.5.4.4.3. Market size and forecast, by End-Use
CHAPTER 7: COMPETITIVE LANDSCAPE
- 7.1. Introduction
- 7.2. Top winning strategies
- 7.3. Product Mapping of Top 10 Player
- 7.4. Competitive Dashboard
- 7.5. Competitive Heatmap
- 7.6. Top player positioning, 2022
CHAPTER 8: COMPANY PROFILES
- 8.1. Viessmann Group
- 8.1.1. Company overview
- 8.1.2. Key Executives
- 8.1.3. Company snapshot
- 8.1.4. Operating business segments
- 8.1.5. Product portfolio
- 8.1.6. Key strategic moves and developments
- 8.2. ETA Heiztechnik GmbH
- 8.2.1. Company overview
- 8.2.2. Key Executives
- 8.2.3. Company snapshot
- 8.2.4. Operating business segments
- 8.2.5. Product portfolio
- 8.3. HARGASSNER GesmbH
- 8.3.1. Company overview
- 8.3.2. Key Executives
- 8.3.3. Company snapshot
- 8.3.4. Operating business segments
- 8.3.5. Product portfolio
- 8.4. Guntamatic Heiztechnik GmbH
- 8.4.1. Company overview
- 8.4.2. Key Executives
- 8.4.3. Company snapshot
- 8.4.4. Operating business segments
- 8.4.5. Product portfolio
- 8.5. Froling Heizkessel- und Behalterbau Ges.m.b.H.
- 8.5.1. Company overview
- 8.5.2. Key Executives
- 8.5.3. Company snapshot
- 8.5.4. Operating business segments
- 8.5.5. Product portfolio
- 8.6. Woodco
- 8.6.1. Company overview
- 8.6.2. Key Executives
- 8.6.3. Company snapshot
- 8.6.4. Operating business segments
- 8.6.5. Product portfolio
- 8.7. Thermax Limited
- 8.7.1. Company overview
- 8.7.2. Key Executives
- 8.7.3. Company snapshot
- 8.7.4. Operating business segments
- 8.7.5. Product portfolio
- 8.7.6. Business performance
- 8.8. Forbes Marshall Private Limited
- 8.8.1. Company overview
- 8.8.2. Key Executives
- 8.8.3. Company snapshot
- 8.8.4. Operating business segments
- 8.8.5. Product portfolio
- 8.9. Hurst Boiler & Welding Co, Inc.
- 8.9.1. Company overview
- 8.9.2. Key Executives
- 8.9.3. Company snapshot
- 8.9.4. Operating business segments
- 8.9.5. Product portfolio
- 8.10. HDG Bavaria GmbH
- 8.10.1. Company overview
- 8.10.2. Key Executives
- 8.10.3. Company snapshot
- 8.10.4. Operating business segments
- 8.10.5. Product portfolio
LIST OF TABLES
- TABLE 01. GLOBAL BIOMASS BOILER MARKET, BY FEEDSTOCK TYPE, 2022-2032 ($MILLION)
- TABLE 02. BIOMASS BOILER MARKET FOR WOODY BIOMASS, BY REGION, 2022-2032 ($MILLION)
- TABLE 03. BIOMASS BOILER MARKET FOR AGRICULTURE AND FOREST RESIDUES, BY REGION, 2022-2032 ($MILLION)
- TABLE 04. BIOMASS BOILER MARKET FOR BIOGAS AND ENERGY CROPS, BY REGION, 2022-2032 ($MILLION)
- TABLE 05. BIOMASS BOILER MARKET FOR URBAN RESIDUES, BY REGION, 2022-2032 ($MILLION)
- TABLE 06. GLOBAL BIOMASS BOILER MARKET, BY END-USE, 2022-2032 ($MILLION)
- TABLE 07. BIOMASS BOILER MARKET FOR RESIDENTIAL, BY REGION, 2022-2032 ($MILLION)
- TABLE 08. BIOMASS BOILER MARKET FOR COMMERCIAL, BY REGION, 2022-2032 ($MILLION)
- TABLE 09. BIOMASS BOILER MARKET FOR INDUSTRIAL, BY REGION, 2022-2032 ($MILLION)
- TABLE 10. BIOMASS BOILER MARKET, BY REGION, 2022-2032 ($MILLION)
- TABLE 11. NORTH AMERICA BIOMASS BOILER MARKET, BY FEEDSTOCK TYPE, 2022-2032 ($MILLION)
- TABLE 12. NORTH AMERICA BIOMASS BOILER MARKET, BY END-USE, 2022-2032 ($MILLION)
- TABLE 13. NORTH AMERICA BIOMASS BOILER MARKET, BY COUNTRY, 2022-2032 ($MILLION)
- TABLE 14. U.S. BIOMASS BOILER MARKET, BY FEEDSTOCK TYPE, 2022-2032 ($MILLION)
- TABLE 15. U.S. BIOMASS BOILER MARKET, BY END-USE, 2022-2032 ($MILLION)
- TABLE 16. CANADA BIOMASS BOILER MARKET, BY FEEDSTOCK TYPE, 2022-2032 ($MILLION)
- TABLE 17. CANADA BIOMASS BOILER MARKET, BY END-USE, 2022-2032 ($MILLION)
- TABLE 18. MEXICO BIOMASS BOILER MARKET, BY FEEDSTOCK TYPE, 2022-2032 ($MILLION)
- TABLE 19. MEXICO BIOMASS BOILER MARKET, BY END-USE, 2022-2032 ($MILLION)
- TABLE 20. EUROPE BIOMASS BOILER MARKET, BY FEEDSTOCK TYPE, 2022-2032 ($MILLION)
- TABLE 21. EUROPE BIOMASS BOILER MARKET, BY END-USE, 2022-2032 ($MILLION)
- TABLE 22. EUROPE BIOMASS BOILER MARKET, BY COUNTRY, 2022-2032 ($MILLION)
- TABLE 23. GERMANY BIOMASS BOILER MARKET, BY FEEDSTOCK TYPE, 2022-2032 ($MILLION)
- TABLE 24. GERMANY BIOMASS BOILER MARKET, BY END-USE, 2022-2032 ($MILLION)
- TABLE 25. FRANCE BIOMASS BOILER MARKET, BY FEEDSTOCK TYPE, 2022-2032 ($MILLION)
- TABLE 26. FRANCE BIOMASS BOILER MARKET, BY END-USE, 2022-2032 ($MILLION)
- TABLE 27. ITALY BIOMASS BOILER MARKET, BY FEEDSTOCK TYPE, 2022-2032 ($MILLION)
- TABLE 28. ITALY BIOMASS BOILER MARKET, BY END-USE, 2022-2032 ($MILLION)
- TABLE 29. SPAIN BIOMASS BOILER MARKET, BY FEEDSTOCK TYPE, 2022-2032 ($MILLION)
- TABLE 30. SPAIN BIOMASS BOILER MARKET, BY END-USE, 2022-2032 ($MILLION)
- TABLE 31. UK BIOMASS BOILER MARKET, BY FEEDSTOCK TYPE, 2022-2032 ($MILLION)
- TABLE 32. UK BIOMASS BOILER MARKET, BY END-USE, 2022-2032 ($MILLION)
- TABLE 33. REST OF EUROPE BIOMASS BOILER MARKET, BY FEEDSTOCK TYPE, 2022-2032 ($MILLION)
- TABLE 34. REST OF EUROPE BIOMASS BOILER MARKET, BY END-USE, 2022-2032 ($MILLION)
- TABLE 35. ASIA-PACIFIC BIOMASS BOILER MARKET, BY FEEDSTOCK TYPE, 2022-2032 ($MILLION)
- TABLE 36. ASIA-PACIFIC BIOMASS BOILER MARKET, BY END-USE, 2022-2032 ($MILLION)
- TABLE 37. ASIA-PACIFIC BIOMASS BOILER MARKET, BY COUNTRY, 2022-2032 ($MILLION)
- TABLE 38. CHINA BIOMASS BOILER MARKET, BY FEEDSTOCK TYPE, 2022-2032 ($MILLION)
- TABLE 39. CHINA BIOMASS BOILER MARKET, BY END-USE, 2022-2032 ($MILLION)
- TABLE 40. JAPAN BIOMASS BOILER MARKET, BY FEEDSTOCK TYPE, 2022-2032 ($MILLION)
- TABLE 41. JAPAN BIOMASS BOILER MARKET, BY END-USE, 2022-2032 ($MILLION)
- TABLE 42. INDIA BIOMASS BOILER MARKET, BY FEEDSTOCK TYPE, 2022-2032 ($MILLION)
- TABLE 43. INDIA BIOMASS BOILER MARKET, BY END-USE, 2022-2032 ($MILLION)
- TABLE 44. SOUTH KOREA BIOMASS BOILER MARKET, BY FEEDSTOCK TYPE, 2022-2032 ($MILLION)
- TABLE 45. SOUTH KOREA BIOMASS BOILER MARKET, BY END-USE, 2022-2032 ($MILLION)
- TABLE 46. AUSTRALIA BIOMASS BOILER MARKET, BY FEEDSTOCK TYPE, 2022-2032 ($MILLION)
- TABLE 47. AUSTRALIA BIOMASS BOILER MARKET, BY END-USE, 2022-2032 ($MILLION)
- TABLE 48. REST OF ASIA-PACIFIC BIOMASS BOILER MARKET, BY FEEDSTOCK TYPE, 2022-2032 ($MILLION)
- TABLE 49. REST OF ASIA-PACIFIC BIOMASS BOILER MARKET, BY END-USE, 2022-2032 ($MILLION)
- TABLE 50. LAMEA BIOMASS BOILER MARKET, BY FEEDSTOCK TYPE, 2022-2032 ($MILLION)
- TABLE 51. LAMEA BIOMASS BOILER MARKET, BY END-USE, 2022-2032 ($MILLION)
- TABLE 52. LAMEA BIOMASS BOILER MARKET, BY COUNTRY, 2022-2032 ($MILLION)
- TABLE 53. BRAZIL BIOMASS BOILER MARKET, BY FEEDSTOCK TYPE, 2022-2032 ($MILLION)
- TABLE 54. BRAZIL BIOMASS BOILER MARKET, BY END-USE, 2022-2032 ($MILLION)
- TABLE 55. SAUDI ARABIA BIOMASS BOILER MARKET, BY FEEDSTOCK TYPE, 2022-2032 ($MILLION)
- TABLE 56. SAUDI ARABIA BIOMASS BOILER MARKET, BY END-USE, 2022-2032 ($MILLION)
- TABLE 57. SOUTH AFRICA BIOMASS BOILER MARKET, BY FEEDSTOCK TYPE, 2022-2032 ($MILLION)
- TABLE 58. SOUTH AFRICA BIOMASS BOILER MARKET, BY END-USE, 2022-2032 ($MILLION)
- TABLE 59. REST OF LAMEA BIOMASS BOILER MARKET, BY FEEDSTOCK TYPE, 2022-2032 ($MILLION)
- TABLE 60. REST OF LAMEA BIOMASS BOILER MARKET, BY END-USE, 2022-2032 ($MILLION)
- TABLE 61. VIESSMANN GROUP: KEY EXECUTIVES
- TABLE 62. VIESSMANN GROUP: COMPANY SNAPSHOT
- TABLE 63. VIESSMANN GROUP: PRODUCT SEGMENTS
- TABLE 64. VIESSMANN GROUP: PRODUCT PORTFOLIO
- TABLE 65. VIESSMANN GROUP: KEY STRATERGIES
- TABLE 66. ETA HEIZTECHNIK GMBH: KEY EXECUTIVES
- TABLE 67. ETA HEIZTECHNIK GMBH: COMPANY SNAPSHOT
- TABLE 68. ETA HEIZTECHNIK GMBH: PRODUCT SEGMENTS
- TABLE 69. ETA HEIZTECHNIK GMBH: PRODUCT PORTFOLIO
- TABLE 70. HARGASSNER GESMBH: KEY EXECUTIVES
- TABLE 71. HARGASSNER GESMBH: COMPANY SNAPSHOT
- TABLE 72. HARGASSNER GESMBH: PRODUCT SEGMENTS
- TABLE 73. HARGASSNER GESMBH: PRODUCT PORTFOLIO
- TABLE 74. GUNTAMATIC HEIZTECHNIK GMBH: KEY EXECUTIVES
- TABLE 75. GUNTAMATIC HEIZTECHNIK GMBH: COMPANY SNAPSHOT
- TABLE 76. GUNTAMATIC HEIZTECHNIK GMBH: PRODUCT SEGMENTS
- TABLE 77. GUNTAMATIC HEIZTECHNIK GMBH: PRODUCT PORTFOLIO
- TABLE 78. FROLING HEIZKESSEL- UND BEHALTERBAU GES.M.B.H.: KEY EXECUTIVES
- TABLE 79. FROLING HEIZKESSEL- UND BEHALTERBAU GES.M.B.H.: COMPANY SNAPSHOT
- TABLE 80. FROLING HEIZKESSEL- UND BEHALTERBAU GES.M.B.H.: PRODUCT SEGMENTS
- TABLE 81. FROLING HEIZKESSEL- UND BEHALTERBAU GES.M.B.H.: PRODUCT PORTFOLIO
- TABLE 82. WOODCO: KEY EXECUTIVES
- TABLE 83. WOODCO: COMPANY SNAPSHOT
- TABLE 84. WOODCO: PRODUCT SEGMENTS
- TABLE 85. WOODCO: PRODUCT PORTFOLIO
- TABLE 86. THERMAX LIMITED: KEY EXECUTIVES
- TABLE 87. THERMAX LIMITED: COMPANY SNAPSHOT
- TABLE 88. THERMAX LIMITED: PRODUCT SEGMENTS
- TABLE 89. THERMAX LIMITED: PRODUCT PORTFOLIO
- TABLE 90. FORBES MARSHALL PRIVATE LIMITED: KEY EXECUTIVES
- TABLE 91. FORBES MARSHALL PRIVATE LIMITED: COMPANY SNAPSHOT
- TABLE 92. FORBES MARSHALL PRIVATE LIMITED: PRODUCT SEGMENTS
- TABLE 93. FORBES MARSHALL PRIVATE LIMITED: PRODUCT PORTFOLIO
- TABLE 94. HURST BOILER & WELDING CO, INC.: KEY EXECUTIVES
- TABLE 95. HURST BOILER & WELDING CO, INC.: COMPANY SNAPSHOT
- TABLE 96. HURST BOILER & WELDING CO, INC.: PRODUCT SEGMENTS
- TABLE 97. HURST BOILER & WELDING CO, INC.: PRODUCT PORTFOLIO
- TABLE 98. HDG BAVARIA GMBH: KEY EXECUTIVES
- TABLE 99. HDG BAVARIA GMBH: COMPANY SNAPSHOT
- TABLE 100. HDG BAVARIA GMBH: PRODUCT SEGMENTS
- TABLE 101. HDG BAVARIA GMBH: PRODUCT PORTFOLIO
LIST OF FIGURES
- FIGURE 01. BIOMASS BOILER MARKET, 2022-2032
- FIGURE 02. SEGMENTATION OF BIOMASS BOILER MARKET,2022-2032
- FIGURE 03. TOP INVESTMENT POCKETS IN BIOMASS BOILER MARKET (2023-2032)
- FIGURE 04. LOW BARGAINING POWER OF SUPPLIERS
- FIGURE 05. LOW THREAT OF NEW ENTRANTS
- FIGURE 06. LOW THREAT OF SUBSTITUTES
- FIGURE 07. LOW INTENSITY OF RIVALRY
- FIGURE 08. LOW BARGAINING POWER OF BUYERS
- FIGURE 09. GLOBAL BIOMASS BOILER MARKET:DRIVERS, RESTRAINTS AND OPPORTUNITIES
- FIGURE 10. IMPACT OF KEY REGULATION: BIOMASS BOILER MARKET
- FIGURE 11. PATENT ANALYSIS BY COMPANY
- FIGURE 12. PATENT ANALYSIS BY COUNTRY
- FIGURE 13. BIOMASS BOILER MARKET, BY FEEDSTOCK TYPE, 2022(%)
- FIGURE 14. COMPARATIVE SHARE ANALYSIS OF BIOMASS BOILER MARKET FOR WOODY BIOMASS, BY COUNTRY 2022 AND 2032(%)
- FIGURE 15. COMPARATIVE SHARE ANALYSIS OF BIOMASS BOILER MARKET FOR AGRICULTURE AND FOREST RESIDUES, BY COUNTRY 2022 AND 2032(%)
- FIGURE 16. COMPARATIVE SHARE ANALYSIS OF BIOMASS BOILER MARKET FOR BIOGAS AND ENERGY CROPS, BY COUNTRY 2022 AND 2032(%)
- FIGURE 17. COMPARATIVE SHARE ANALYSIS OF BIOMASS BOILER MARKET FOR URBAN RESIDUES, BY COUNTRY 2022 AND 2032(%)
- FIGURE 18. BIOMASS BOILER MARKET, BY END-USE, 2022(%)
- FIGURE 19. COMPARATIVE SHARE ANALYSIS OF BIOMASS BOILER MARKET FOR RESIDENTIAL, BY COUNTRY 2022 AND 2032(%)
- FIGURE 20. COMPARATIVE SHARE ANALYSIS OF BIOMASS BOILER MARKET FOR COMMERCIAL, BY COUNTRY 2022 AND 2032(%)
- FIGURE 21. COMPARATIVE SHARE ANALYSIS OF BIOMASS BOILER MARKET FOR INDUSTRIAL, BY COUNTRY 2022 AND 2032(%)
- FIGURE 22. BIOMASS BOILER MARKET BY REGION, 2022(%)
- FIGURE 23. U.S. BIOMASS BOILER MARKET, 2022-2032 ($MILLION)
- FIGURE 24. CANADA BIOMASS BOILER MARKET, 2022-2032 ($MILLION)
- FIGURE 25. MEXICO BIOMASS BOILER MARKET, 2022-2032 ($MILLION)
- FIGURE 26. GERMANY BIOMASS BOILER MARKET, 2022-2032 ($MILLION)
- FIGURE 27. FRANCE BIOMASS BOILER MARKET, 2022-2032 ($MILLION)
- FIGURE 28. ITALY BIOMASS BOILER MARKET, 2022-2032 ($MILLION)
- FIGURE 29. SPAIN BIOMASS BOILER MARKET, 2022-2032 ($MILLION)
- FIGURE 30. UK BIOMASS BOILER MARKET, 2022-2032 ($MILLION)
- FIGURE 31. REST OF EUROPE BIOMASS BOILER MARKET, 2022-2032 ($MILLION)
- FIGURE 32. CHINA BIOMASS BOILER MARKET, 2022-2032 ($MILLION)
- FIGURE 33. JAPAN BIOMASS BOILER MARKET, 2022-2032 ($MILLION)
- FIGURE 34. INDIA BIOMASS BOILER MARKET, 2022-2032 ($MILLION)
- FIGURE 35. SOUTH KOREA BIOMASS BOILER MARKET, 2022-2032 ($MILLION)
- FIGURE 36. AUSTRALIA BIOMASS BOILER MARKET, 2022-2032 ($MILLION)
- FIGURE 37. REST OF ASIA-PACIFIC BIOMASS BOILER MARKET, 2022-2032 ($MILLION)
- FIGURE 38. BRAZIL BIOMASS BOILER MARKET, 2022-2032 ($MILLION)
- FIGURE 39. SAUDI ARABIA BIOMASS BOILER MARKET, 2022-2032 ($MILLION)
- FIGURE 40. SOUTH AFRICA BIOMASS BOILER MARKET, 2022-2032 ($MILLION)
- FIGURE 41. REST OF LAMEA BIOMASS BOILER MARKET, 2022-2032 ($MILLION)
- FIGURE 42. TOP WINNING STRATEGIES, BY YEAR
- FIGURE 43. TOP WINNING STRATEGIES, BY DEVELOPMENT
- FIGURE 44. TOP WINNING STRATEGIES, BY COMPANY
- FIGURE 45. PRODUCT MAPPING OF TOP 10 PLAYERS
- FIGURE 46. COMPETITIVE DASHBOARD
- FIGURE 47. COMPETITIVE HEATMAP: BIOMASS BOILER MARKET
- FIGURE 48. TOP PLAYER POSITIONING, 2022
- FIGURE 49. THERMAX LIMITED: NET SALES, 2020-2022 ($MILLION)
- FIGURE 50. THERMAX LIMITED: REVENUE SHARE BY SEGMENT, 2022 (%)
- FIGURE 51. THERMAX LIMITED: REVENUE SHARE BY REGION, 2022 (%)

