
PUBLISHER: Allied Market Research | PRODUCT CODE: 1365636

PUBLISHER: Allied Market Research | PRODUCT CODE: 1365636
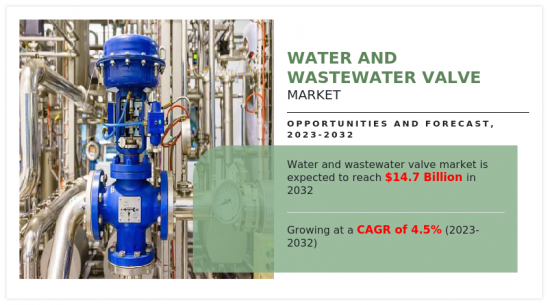
Water And Wastewater Valve Market By Type, By Material, By End User Industry : Global Opportunity Analysis and Industry Forecast, 2023-2032
According to a new report published by Allied Market Research, titled, "Water And Wastewater Valve Market," The water and wastewater valve market was valued at $8.3 billion in 2020, and is estimated to reach $14.7 billion by 2032, growing at a CAGR of 4.5% from 2023 to 2032.
Owing to the increase in urbanization and the increasing rate of population growth, infrastructure and water are in more demand. In addition, urbanization, the need for clean water supply, and the need for wastewater management systems require the installation of water valves in treatment facilities, distribution networks, and pumping stations. Water scarcity is another issue that is of global significance because it affects many different geographic areas, including Africa. To maximize water usage, reduce waste, and ensure reliable distribution, efficient water management systems are needed, including the use of cutting-edge valves. Therefore, such a benefit might accelerate the market's expansion.
However, the saturation in industrial growth in major developed countries such as Germany, the U.S., the UK, and others is anticipated to affect the growth in trend for industrial valves significantly. The demand for new industrial valves is extremely slow paced in the previously mentioned countries mainly due to the developed industrial infrastructure. This is expected to restrain the growth of the industrial valves market.
Moreover, the development of oil & gas industry in North America thus drives the industrial valves market growth globally. Moreover, the demand for industrial valves has significantly increased from the food & beverage industry, mainly from the developing nations in Asia-Pacific and Latin America. The food & beverage processing industry has shown high growth in countries such as India, Brazil, and others, with the surge in agriculture and risen demand for processed food. This, in turn, has created a high demand for industrial valves; thereby, driving the growth of the industrial valves industry.
The water and wastewater valve market are segmented based on type, material, end-user industry, and region. On the basis of type, the market is categorized into gate, ball, butterfly, globe and others. The ball segment dominated the market in 2022. On the basis of material, it is segregated into cast iron, steel, alloy based and others. The steel segment dominated the market in 2022. Based on end-user industry, it is differentiated into oil and gas, chemical, power generation and others. The oil and gas segment dominated the market in 2022.
Region wise, the market is analyzed across North America (the U.S., Canada, and Mexico), Europe (Germany, the UK, France, Italy, and rest of Europe), Asia-Pacific (China, India, Japan, South Korea, and rest of Asia-Pacific), and LAMEA (Latin America, Middle East, and Africa).
In 2022, Asia-Pacific was the key shareholder, and is anticipated to secure a leading position during the forecast period.
COMPETITION ANALYSIS
Key companies profiled in the water and wastewater valve market report include AVK Holding, Anything Flows LLC, Avcon Controls Pvt. Ltd., Bohmer GmbHCrane, Davis Valve, EG Valves Manufacturing Co., Ltd., Emerson Electric Co., Flow Control Technology Valve, Flowserve Corp. And Fluid Chem Valves (India) Pvt. Ltd
KEY BENEFITS FOR STAKEHOLDERS
- The report provides an extensive analysis of the current trends, future estimations, and dynamics of the water and wastewater valve market.
- In-depth market analysis is conducted by constructing market estimations for the key market segments between 2022 and 2032.
- Extensive analysis of the water and wastewater valve market is conducted by following key product positioning and monitoring of the top competitors within the market framework.
- A comprehensive analysis of all regions is provided to determine the prevailing opportunities.
- The key market players within the water and wastewater valve market are profiled in this report and their strategies are analyzed thoroughly, to understand the competitive outlook of the water and wastewater valve industry.
Additional benefits you will get with this purchase are:
- Quarterly Update and* (only available with a corporate license, on listed price)
- 5 additional Company Profile of client Choice pre- or Post-purchase, as a free update.
- Free Upcoming Version on the Purchase of Five and Enterprise User License.
- 16 analyst hours of support* (post-purchase, if you find additional data requirements upon review of the report, you may receive support amounting to 16 analyst hours to solve questions, and post-sale queries)
- 15% Free Customization* (in case the scope or segment of the report does not match your requirements, 20% is equivalent to 3 working days of free work, applicable once)
- Free data Pack on the Five and Enterprise User License. (Excel version of the report)
- Free Updated report if the report is 6-12 months old or older.
- 24-hour priority response*
- Free Industry updates and white papers.
Possible Customization with this report (with additional cost and timeline talk to the sales executive to know more)
- End user preferences and pain points
- Average Consumer Expenditure
- Strategic Recommedations
- Additional company profiles with specific to client's interest
- Additional country or region analysis- market size and forecast
- Average Selling Price Analysis / Price Point Analysis
- Brands Share Analysis
- Criss-cross segment analysis- market size and forecast
- Expanded list for Company Profiles
- Historic market data
- Import Export Analysis/Data
- Key player details (including location, contact details, supplier/vendor network etc. in excel format)
- List of customers/consumers/raw material suppliers- value chain analysis
- Market share analysis of players at global/region/country level
- Per Capita Consumption Trends
- Product Consumption Analysis
- Reimbursement Scenario
- SWOT Analysis
- Volume Market Size and Forecast
Key Market Segments
By Type
- Gate
- Ball
- Butterfly
- Globe
- Others
By Material
- Cast Iron
- Steel
- Alloy Based
- Others
By End User Industry
- Oil and Gas
- Chemical
- Power Generation
- Others
By Region
- North America
- U.S.
- Canada
- Mexico
- Europe
- Germany
- UK
- France
- Italy
- Rest of Europe
- Asia-Pacific
- China
- Japan
- India
- South Korea
- Rest of Asia-Pacific
- LAMEA
- Latin America
- Middle East
- Africa
Key Market Players:
- Anything Flows LLC
- Avcon Controls Pvt. Ltd.
- AVK Holdings
- Bohmer GmbH
- Davis Valve
- EG Valves Manufacturing Co., Ltd.
- Emerson Electric Co.
- Flow Control Technology Valve
- Flowserve Corp.
- Fluidchem Valves (India) Pvt. Ltd.
TABLE OF CONTENTS
CHAPTER 1: INTRODUCTION
- 1.1. Report description
- 1.2. Key market segments
- 1.3. Key benefits to the stakeholders
- 1.4. Research Methodology
- 1.4.1. Primary research
- 1.4.2. Secondary research
- 1.4.3. Analyst tools and models
CHAPTER 2: EXECUTIVE SUMMARY
- 2.1. CXO Perspective
CHAPTER 3: MARKET OVERVIEW
- 3.1. Market definition and scope
- 3.2. Key findings
- 3.2.1. Top impacting factors
- 3.2.2. Top investment pockets
- 3.3. Porter's five forces analysis
- 3.3.1. Low bargaining power of suppliers
- 3.3.2. Low threat of new entrants
- 3.3.3. Low threat of substitutes
- 3.3.4. Low intensity of rivalry
- 3.3.5. Low bargaining power of buyers
- 3.4. Market dynamics
- 3.4.1. Drivers
- 3.4.1.1. Increase water scarcity, growing population, and urbanization
- 3.4.1.2. Surge in investments in the oil and gas industry in North America
- 3.4.1. Drivers
- 3.4.2. Restraints
- 3.4.2.1. The increased tariff on raw materials
- 3.4.3. Opportunities
- 3.4.3.1. Advancements in technology
- 3.5. COVID-19 Impact Analysis on the market
CHAPTER 4: WATER AND WASTEWATER VALVE MARKET, BY TYPE
- 4.1. Overview
- 4.1.1. Market size and forecast
- 4.2. Gate
- 4.2.1. Key market trends, growth factors and opportunities
- 4.2.2. Market size and forecast, by region
- 4.2.3. Market share analysis by country
- 4.3. Ball
- 4.3.1. Key market trends, growth factors and opportunities
- 4.3.2. Market size and forecast, by region
- 4.3.3. Market share analysis by country
- 4.4. Butterfly
- 4.4.1. Key market trends, growth factors and opportunities
- 4.4.2. Market size and forecast, by region
- 4.4.3. Market share analysis by country
- 4.5. Globe
- 4.5.1. Key market trends, growth factors and opportunities
- 4.5.2. Market size and forecast, by region
- 4.5.3. Market share analysis by country
- 4.6. Others
- 4.6.1. Key market trends, growth factors and opportunities
- 4.6.2. Market size and forecast, by region
- 4.6.3. Market share analysis by country
CHAPTER 5: WATER AND WASTEWATER VALVE MARKET, BY MATERIAL
- 5.1. Overview
- 5.1.1. Market size and forecast
- 5.2. Cast Iron
- 5.2.1. Key market trends, growth factors and opportunities
- 5.2.2. Market size and forecast, by region
- 5.2.3. Market share analysis by country
- 5.3. Steel
- 5.3.1. Key market trends, growth factors and opportunities
- 5.3.2. Market size and forecast, by region
- 5.3.3. Market share analysis by country
- 5.4. Alloy Based
- 5.4.1. Key market trends, growth factors and opportunities
- 5.4.2. Market size and forecast, by region
- 5.4.3. Market share analysis by country
- 5.5. Others
- 5.5.1. Key market trends, growth factors and opportunities
- 5.5.2. Market size and forecast, by region
- 5.5.3. Market share analysis by country
CHAPTER 6: WATER AND WASTEWATER VALVE MARKET, BY END USER INDUSTRY
- 6.1. Overview
- 6.1.1. Market size and forecast
- 6.2. Oil and Gas
- 6.2.1. Key market trends, growth factors and opportunities
- 6.2.2. Market size and forecast, by region
- 6.2.3. Market share analysis by country
- 6.3. Chemical
- 6.3.1. Key market trends, growth factors and opportunities
- 6.3.2. Market size and forecast, by region
- 6.3.3. Market share analysis by country
- 6.4. Power Generation
- 6.4.1. Key market trends, growth factors and opportunities
- 6.4.2. Market size and forecast, by region
- 6.4.3. Market share analysis by country
- 6.5. Others
- 6.5.1. Key market trends, growth factors and opportunities
- 6.5.2. Market size and forecast, by region
- 6.5.3. Market share analysis by country
CHAPTER 7: WATER AND WASTEWATER VALVE MARKET, BY REGION
- 7.1. Overview
- 7.1.1. Market size and forecast By Region
- 7.2. North America
- 7.2.1. Key trends and opportunities
- 7.2.2. Market size and forecast, by Type
- 7.2.3. Market size and forecast, by Material
- 7.2.4. Market size and forecast, by End User Industry
- 7.2.5. Market size and forecast, by country
- 7.2.5.1. U.S.
- 7.2.5.1.1. Key market trends, growth factors and opportunities
- 7.2.5.1.2. Market size and forecast, by Type
- 7.2.5.1.3. Market size and forecast, by Material
- 7.2.5.1.4. Market size and forecast, by End User Industry
- 7.2.5.2. Canada
- 7.2.5.2.1. Key market trends, growth factors and opportunities
- 7.2.5.2.2. Market size and forecast, by Type
- 7.2.5.2.3. Market size and forecast, by Material
- 7.2.5.2.4. Market size and forecast, by End User Industry
- 7.2.5.3. Mexico
- 7.2.5.3.1. Key market trends, growth factors and opportunities
- 7.2.5.3.2. Market size and forecast, by Type
- 7.2.5.3.3. Market size and forecast, by Material
- 7.2.5.3.4. Market size and forecast, by End User Industry
- 7.3. Europe
- 7.3.1. Key trends and opportunities
- 7.3.2. Market size and forecast, by Type
- 7.3.3. Market size and forecast, by Material
- 7.3.4. Market size and forecast, by End User Industry
- 7.3.5. Market size and forecast, by country
- 7.3.5.1. Germany
- 7.3.5.1.1. Key market trends, growth factors and opportunities
- 7.3.5.1.2. Market size and forecast, by Type
- 7.3.5.1.3. Market size and forecast, by Material
- 7.3.5.1.4. Market size and forecast, by End User Industry
- 7.3.5.2. UK
- 7.3.5.2.1. Key market trends, growth factors and opportunities
- 7.3.5.2.2. Market size and forecast, by Type
- 7.3.5.2.3. Market size and forecast, by Material
- 7.3.5.2.4. Market size and forecast, by End User Industry
- 7.3.5.3. France
- 7.3.5.3.1. Key market trends, growth factors and opportunities
- 7.3.5.3.2. Market size and forecast, by Type
- 7.3.5.3.3. Market size and forecast, by Material
- 7.3.5.3.4. Market size and forecast, by End User Industry
- 7.3.5.4. Italy
- 7.3.5.4.1. Key market trends, growth factors and opportunities
- 7.3.5.4.2. Market size and forecast, by Type
- 7.3.5.4.3. Market size and forecast, by Material
- 7.3.5.4.4. Market size and forecast, by End User Industry
- 7.3.5.5. Rest of Europe
- 7.3.5.5.1. Key market trends, growth factors and opportunities
- 7.3.5.5.2. Market size and forecast, by Type
- 7.3.5.5.3. Market size and forecast, by Material
- 7.3.5.5.4. Market size and forecast, by End User Industry
- 7.4. Asia-Pacific
- 7.4.1. Key trends and opportunities
- 7.4.2. Market size and forecast, by Type
- 7.4.3. Market size and forecast, by Material
- 7.4.4. Market size and forecast, by End User Industry
- 7.4.5. Market size and forecast, by country
- 7.4.5.1. China
- 7.4.5.1.1. Key market trends, growth factors and opportunities
- 7.4.5.1.2. Market size and forecast, by Type
- 7.4.5.1.3. Market size and forecast, by Material
- 7.4.5.1.4. Market size and forecast, by End User Industry
- 7.4.5.2. Japan
- 7.4.5.2.1. Key market trends, growth factors and opportunities
- 7.4.5.2.2. Market size and forecast, by Type
- 7.4.5.2.3. Market size and forecast, by Material
- 7.4.5.2.4. Market size and forecast, by End User Industry
- 7.4.5.3. India
- 7.4.5.3.1. Key market trends, growth factors and opportunities
- 7.4.5.3.2. Market size and forecast, by Type
- 7.4.5.3.3. Market size and forecast, by Material
- 7.4.5.3.4. Market size and forecast, by End User Industry
- 7.4.5.4. South Korea
- 7.4.5.4.1. Key market trends, growth factors and opportunities
- 7.4.5.4.2. Market size and forecast, by Type
- 7.4.5.4.3. Market size and forecast, by Material
- 7.4.5.4.4. Market size and forecast, by End User Industry
- 7.4.5.5. Rest of Asia-Pacific
- 7.4.5.5.1. Key market trends, growth factors and opportunities
- 7.4.5.5.2. Market size and forecast, by Type
- 7.4.5.5.3. Market size and forecast, by Material
- 7.4.5.5.4. Market size and forecast, by End User Industry
- 7.5. LAMEA
- 7.5.1. Key trends and opportunities
- 7.5.2. Market size and forecast, by Type
- 7.5.3. Market size and forecast, by Material
- 7.5.4. Market size and forecast, by End User Industry
- 7.5.5. Market size and forecast, by country
- 7.5.5.1. Latin America
- 7.5.5.1.1. Key market trends, growth factors and opportunities
- 7.5.5.1.2. Market size and forecast, by Type
- 7.5.5.1.3. Market size and forecast, by Material
- 7.5.5.1.4. Market size and forecast, by End User Industry
- 7.5.5.2. Middle East
- 7.5.5.2.1. Key market trends, growth factors and opportunities
- 7.5.5.2.2. Market size and forecast, by Type
- 7.5.5.2.3. Market size and forecast, by Material
- 7.5.5.2.4. Market size and forecast, by End User Industry
- 7.5.5.3. Africa
- 7.5.5.3.1. Key market trends, growth factors and opportunities
- 7.5.5.3.2. Market size and forecast, by Type
- 7.5.5.3.3. Market size and forecast, by Material
- 7.5.5.3.4. Market size and forecast, by End User Industry
CHAPTER 8: COMPETITIVE LANDSCAPE
- 8.1. Introduction
- 8.2. Top winning strategies
- 8.3. Product Mapping of Top 10 Player
- 8.4. Competitive Dashboard
- 8.5. Competitive Heatmap
- 8.6. Top player positioning, 2020
CHAPTER 9: COMPANY PROFILES
- 9.1. AVK Holdings
- 9.1.1. Company overview
- 9.1.2. Key Executives
- 9.1.3. Company snapshot
- 9.1.4. Operating business segments
- 9.1.5. Product portfolio
- 9.2. Anything Flows LLC
- 9.2.1. Company overview
- 9.2.2. Key Executives
- 9.2.3. Company snapshot
- 9.2.4. Operating business segments
- 9.2.5. Product portfolio
- 9.3. Avcon Controls Pvt. Ltd.
- 9.3.1. Company overview
- 9.3.2. Key Executives
- 9.3.3. Company snapshot
- 9.3.4. Operating business segments
- 9.3.5. Product portfolio
- 9.4. Bohmer GmbH
- 9.4.1. Company overview
- 9.4.2. Key Executives
- 9.4.3. Company snapshot
- 9.4.4. Operating business segments
- 9.4.5. Product portfolio
- 9.5. Davis Valve
- 9.5.1. Company overview
- 9.5.2. Key Executives
- 9.5.3. Company snapshot
- 9.5.4. Operating business segments
- 9.5.5. Product portfolio
- 9.6. EG Valves Manufacturing Co., Ltd.
- 9.6.1. Company overview
- 9.6.2. Key Executives
- 9.6.3. Company snapshot
- 9.6.4. Operating business segments
- 9.6.5. Product portfolio
- 9.7. Emerson Electric Co.
- 9.7.1. Company overview
- 9.7.2. Key Executives
- 9.7.3. Company snapshot
- 9.7.4. Operating business segments
- 9.7.5. Product portfolio
- 9.7.6. Business performance
- 9.8. Flow Control Technology Valve
- 9.8.1. Company overview
- 9.8.2. Key Executives
- 9.8.3. Company snapshot
- 9.8.4. Operating business segments
- 9.8.5. Product portfolio
- 9.9. Flowserve Corp.
- 9.9.1. Company overview
- 9.9.2. Key Executives
- 9.9.3. Company snapshot
- 9.9.4. Operating business segments
- 9.9.5. Product portfolio
- 9.9.6. Business performance
- 9.10. Fluidchem Valves (India) Pvt. Ltd.
- 9.10.1. Company overview
- 9.10.2. Key Executives
- 9.10.3. Company snapshot
- 9.10.4. Operating business segments
- 9.10.5. Product portfolio
LIST OF TABLES
- TABLE 01. GLOBAL WATER AND WASTEWATER VALVE MARKET, BY TYPE, 2020-2032 ($MILLION)
- TABLE 02. WATER AND WASTEWATER VALVE MARKET FOR GATE, BY REGION, 2020-2032 ($MILLION)
- TABLE 03. WATER AND WASTEWATER VALVE MARKET FOR BALL, BY REGION, 2020-2032 ($MILLION)
- TABLE 04. WATER AND WASTEWATER VALVE MARKET FOR BUTTERFLY, BY REGION, 2020-2032 ($MILLION)
- TABLE 05. WATER AND WASTEWATER VALVE MARKET FOR GLOBE, BY REGION, 2020-2032 ($MILLION)
- TABLE 06. WATER AND WASTEWATER VALVE MARKET FOR OTHERS, BY REGION, 2020-2032 ($MILLION)
- TABLE 07. GLOBAL WATER AND WASTEWATER VALVE MARKET, BY MATERIAL, 2020-2032 ($MILLION)
- TABLE 08. WATER AND WASTEWATER VALVE MARKET FOR CAST IRON, BY REGION, 2020-2032 ($MILLION)
- TABLE 09. WATER AND WASTEWATER VALVE MARKET FOR STEEL, BY REGION, 2020-2032 ($MILLION)
- TABLE 10. WATER AND WASTEWATER VALVE MARKET FOR ALLOY BASED, BY REGION, 2020-2032 ($MILLION)
- TABLE 11. WATER AND WASTEWATER VALVE MARKET FOR OTHERS, BY REGION, 2020-2032 ($MILLION)
- TABLE 12. GLOBAL WATER AND WASTEWATER VALVE MARKET, BY END USER INDUSTRY, 2020-2032 ($MILLION)
- TABLE 13. WATER AND WASTEWATER VALVE MARKET FOR OIL AND GAS, BY REGION, 2020-2032 ($MILLION)
- TABLE 14. WATER AND WASTEWATER VALVE MARKET FOR CHEMICAL, BY REGION, 2020-2032 ($MILLION)
- TABLE 15. WATER AND WASTEWATER VALVE MARKET FOR POWER GENERATION, BY REGION, 2020-2032 ($MILLION)
- TABLE 16. WATER AND WASTEWATER VALVE MARKET FOR OTHERS, BY REGION, 2020-2032 ($MILLION)
- TABLE 17. WATER AND WASTEWATER VALVE MARKET, BY REGION, 2020-2032 ($MILLION)
- TABLE 18. NORTH AMERICA WATER AND WASTEWATER VALVE MARKET, BY TYPE, 2020-2032 ($MILLION)
- TABLE 19. NORTH AMERICA WATER AND WASTEWATER VALVE MARKET, BY MATERIAL, 2020-2032 ($MILLION)
- TABLE 20. NORTH AMERICA WATER AND WASTEWATER VALVE MARKET, BY END USER INDUSTRY, 2020-2032 ($MILLION)
- TABLE 21. NORTH AMERICA WATER AND WASTEWATER VALVE MARKET, BY COUNTRY, 2020-2032 ($MILLION)
- TABLE 22. U.S. WATER AND WASTEWATER VALVE MARKET, BY TYPE, 2020-2032 ($MILLION)
- TABLE 23. U.S. WATER AND WASTEWATER VALVE MARKET, BY MATERIAL, 2020-2032 ($MILLION)
- TABLE 24. U.S. WATER AND WASTEWATER VALVE MARKET, BY END USER INDUSTRY, 2020-2032 ($MILLION)
- TABLE 25. CANADA WATER AND WASTEWATER VALVE MARKET, BY TYPE, 2020-2032 ($MILLION)
- TABLE 26. CANADA WATER AND WASTEWATER VALVE MARKET, BY MATERIAL, 2020-2032 ($MILLION)
- TABLE 27. CANADA WATER AND WASTEWATER VALVE MARKET, BY END USER INDUSTRY, 2020-2032 ($MILLION)
- TABLE 28. MEXICO WATER AND WASTEWATER VALVE MARKET, BY TYPE, 2020-2032 ($MILLION)
- TABLE 29. MEXICO WATER AND WASTEWATER VALVE MARKET, BY MATERIAL, 2020-2032 ($MILLION)
- TABLE 30. MEXICO WATER AND WASTEWATER VALVE MARKET, BY END USER INDUSTRY, 2020-2032 ($MILLION)
- TABLE 31. EUROPE WATER AND WASTEWATER VALVE MARKET, BY TYPE, 2020-2032 ($MILLION)
- TABLE 32. EUROPE WATER AND WASTEWATER VALVE MARKET, BY MATERIAL, 2020-2032 ($MILLION)
- TABLE 33. EUROPE WATER AND WASTEWATER VALVE MARKET, BY END USER INDUSTRY, 2020-2032 ($MILLION)
- TABLE 34. EUROPE WATER AND WASTEWATER VALVE MARKET, BY COUNTRY, 2020-2032 ($MILLION)
- TABLE 35. GERMANY WATER AND WASTEWATER VALVE MARKET, BY TYPE, 2020-2032 ($MILLION)
- TABLE 36. GERMANY WATER AND WASTEWATER VALVE MARKET, BY MATERIAL, 2020-2032 ($MILLION)
- TABLE 37. GERMANY WATER AND WASTEWATER VALVE MARKET, BY END USER INDUSTRY, 2020-2032 ($MILLION)
- TABLE 38. UK WATER AND WASTEWATER VALVE MARKET, BY TYPE, 2020-2032 ($MILLION)
- TABLE 39. UK WATER AND WASTEWATER VALVE MARKET, BY MATERIAL, 2020-2032 ($MILLION)
- TABLE 40. UK WATER AND WASTEWATER VALVE MARKET, BY END USER INDUSTRY, 2020-2032 ($MILLION)
- TABLE 41. FRANCE WATER AND WASTEWATER VALVE MARKET, BY TYPE, 2020-2032 ($MILLION)
- TABLE 42. FRANCE WATER AND WASTEWATER VALVE MARKET, BY MATERIAL, 2020-2032 ($MILLION)
- TABLE 43. FRANCE WATER AND WASTEWATER VALVE MARKET, BY END USER INDUSTRY, 2020-2032 ($MILLION)
- TABLE 44. ITALY WATER AND WASTEWATER VALVE MARKET, BY TYPE, 2020-2032 ($MILLION)
- TABLE 45. ITALY WATER AND WASTEWATER VALVE MARKET, BY MATERIAL, 2020-2032 ($MILLION)
- TABLE 46. ITALY WATER AND WASTEWATER VALVE MARKET, BY END USER INDUSTRY, 2020-2032 ($MILLION)
- TABLE 47. REST OF EUROPE WATER AND WASTEWATER VALVE MARKET, BY TYPE, 2020-2032 ($MILLION)
- TABLE 48. REST OF EUROPE WATER AND WASTEWATER VALVE MARKET, BY MATERIAL, 2020-2032 ($MILLION)
- TABLE 49. REST OF EUROPE WATER AND WASTEWATER VALVE MARKET, BY END USER INDUSTRY, 2020-2032 ($MILLION)
- TABLE 50. ASIA-PACIFIC WATER AND WASTEWATER VALVE MARKET, BY TYPE, 2020-2032 ($MILLION)
- TABLE 51. ASIA-PACIFIC WATER AND WASTEWATER VALVE MARKET, BY MATERIAL, 2020-2032 ($MILLION)
- TABLE 52. ASIA-PACIFIC WATER AND WASTEWATER VALVE MARKET, BY END USER INDUSTRY, 2020-2032 ($MILLION)
- TABLE 53. ASIA-PACIFIC WATER AND WASTEWATER VALVE MARKET, BY COUNTRY, 2020-2032 ($MILLION)
- TABLE 54. CHINA WATER AND WASTEWATER VALVE MARKET, BY TYPE, 2020-2032 ($MILLION)
- TABLE 55. CHINA WATER AND WASTEWATER VALVE MARKET, BY MATERIAL, 2020-2032 ($MILLION)
- TABLE 56. CHINA WATER AND WASTEWATER VALVE MARKET, BY END USER INDUSTRY, 2020-2032 ($MILLION)
- TABLE 57. JAPAN WATER AND WASTEWATER VALVE MARKET, BY TYPE, 2020-2032 ($MILLION)
- TABLE 58. JAPAN WATER AND WASTEWATER VALVE MARKET, BY MATERIAL, 2020-2032 ($MILLION)
- TABLE 59. JAPAN WATER AND WASTEWATER VALVE MARKET, BY END USER INDUSTRY, 2020-2032 ($MILLION)
- TABLE 60. INDIA WATER AND WASTEWATER VALVE MARKET, BY TYPE, 2020-2032 ($MILLION)
- TABLE 61. INDIA WATER AND WASTEWATER VALVE MARKET, BY MATERIAL, 2020-2032 ($MILLION)
- TABLE 62. INDIA WATER AND WASTEWATER VALVE MARKET, BY END USER INDUSTRY, 2020-2032 ($MILLION)
- TABLE 63. SOUTH KOREA WATER AND WASTEWATER VALVE MARKET, BY TYPE, 2020-2032 ($MILLION)
- TABLE 64. SOUTH KOREA WATER AND WASTEWATER VALVE MARKET, BY MATERIAL, 2020-2032 ($MILLION)
- TABLE 65. SOUTH KOREA WATER AND WASTEWATER VALVE MARKET, BY END USER INDUSTRY, 2020-2032 ($MILLION)
- TABLE 66. REST OF ASIA-PACIFIC WATER AND WASTEWATER VALVE MARKET, BY TYPE, 2020-2032 ($MILLION)
- TABLE 67. REST OF ASIA-PACIFIC WATER AND WASTEWATER VALVE MARKET, BY MATERIAL, 2020-2032 ($MILLION)
- TABLE 68. REST OF ASIA-PACIFIC WATER AND WASTEWATER VALVE MARKET, BY END USER INDUSTRY, 2020-2032 ($MILLION)
- TABLE 69. LAMEA WATER AND WASTEWATER VALVE MARKET, BY TYPE, 2020-2032 ($MILLION)
- TABLE 70. LAMEA WATER AND WASTEWATER VALVE MARKET, BY MATERIAL, 2020-2032 ($MILLION)
- TABLE 71. LAMEA WATER AND WASTEWATER VALVE MARKET, BY END USER INDUSTRY, 2020-2032 ($MILLION)
- TABLE 72. LAMEA WATER AND WASTEWATER VALVE MARKET, BY COUNTRY, 2020-2032 ($MILLION)
- TABLE 73. LATIN AMERICA WATER AND WASTEWATER VALVE MARKET, BY TYPE, 2020-2032 ($MILLION)
- TABLE 74. LATIN AMERICA WATER AND WASTEWATER VALVE MARKET, BY MATERIAL, 2020-2032 ($MILLION)
- TABLE 75. LATIN AMERICA WATER AND WASTEWATER VALVE MARKET, BY END USER INDUSTRY, 2020-2032 ($MILLION)
- TABLE 76. MIDDLE EAST WATER AND WASTEWATER VALVE MARKET, BY TYPE, 2020-2032 ($MILLION)
- TABLE 77. MIDDLE EAST WATER AND WASTEWATER VALVE MARKET, BY MATERIAL, 2020-2032 ($MILLION)
- TABLE 78. MIDDLE EAST WATER AND WASTEWATER VALVE MARKET, BY END USER INDUSTRY, 2020-2032 ($MILLION)
- TABLE 79. AFRICA WATER AND WASTEWATER VALVE MARKET, BY TYPE, 2020-2032 ($MILLION)
- TABLE 80. AFRICA WATER AND WASTEWATER VALVE MARKET, BY MATERIAL, 2020-2032 ($MILLION)
- TABLE 81. AFRICA WATER AND WASTEWATER VALVE MARKET, BY END USER INDUSTRY, 2020-2032 ($MILLION)
- TABLE 82. AVK HOLDINGS: KEY EXECUTIVES
- TABLE 83. AVK HOLDINGS: COMPANY SNAPSHOT
- TABLE 84. AVK HOLDINGS: PRODUCT SEGMENTS
- TABLE 85. AVK HOLDINGS: PRODUCT PORTFOLIO
- TABLE 86. ANYTHING FLOWS LLC: KEY EXECUTIVES
- TABLE 87. ANYTHING FLOWS LLC: COMPANY SNAPSHOT
- TABLE 88. ANYTHING FLOWS LLC: PRODUCT SEGMENTS
- TABLE 89. ANYTHING FLOWS LLC: PRODUCT PORTFOLIO
- TABLE 90. AVCON CONTROLS PVT. LTD.: KEY EXECUTIVES
- TABLE 91. AVCON CONTROLS PVT. LTD.: COMPANY SNAPSHOT
- TABLE 92. AVCON CONTROLS PVT. LTD.: PRODUCT SEGMENTS
- TABLE 93. AVCON CONTROLS PVT. LTD.: PRODUCT PORTFOLIO
- TABLE 94. BOHMER GMBH: KEY EXECUTIVES
- TABLE 95. BOHMER GMBH: COMPANY SNAPSHOT
- TABLE 96. BOHMER GMBH: PRODUCT SEGMENTS
- TABLE 97. BOHMER GMBH: PRODUCT PORTFOLIO
- TABLE 98. DAVIS VALVE: KEY EXECUTIVES
- TABLE 99. DAVIS VALVE: COMPANY SNAPSHOT
- TABLE 100. DAVIS VALVE: PRODUCT SEGMENTS
- TABLE 101. DAVIS VALVE: PRODUCT PORTFOLIO
- TABLE 102. EG VALVES MANUFACTURING CO., LTD.: KEY EXECUTIVES
- TABLE 103. EG VALVES MANUFACTURING CO., LTD.: COMPANY SNAPSHOT
- TABLE 104. EG VALVES MANUFACTURING CO., LTD.: PRODUCT SEGMENTS
- TABLE 105. EG VALVES MANUFACTURING CO., LTD.: PRODUCT PORTFOLIO
- TABLE 106. EMERSON ELECTRIC CO.: KEY EXECUTIVES
- TABLE 107. EMERSON ELECTRIC CO.: COMPANY SNAPSHOT
- TABLE 108. EMERSON ELECTRIC CO.: SERVICE SEGMENTS
- TABLE 109. EMERSON ELECTRIC CO.: PRODUCT PORTFOLIO
- TABLE 110. FLOW CONTROL TECHNOLOGY VALVE: KEY EXECUTIVES
- TABLE 111. FLOW CONTROL TECHNOLOGY VALVE: COMPANY SNAPSHOT
- TABLE 112. FLOW CONTROL TECHNOLOGY VALVE: PRODUCT SEGMENTS
- TABLE 113. FLOW CONTROL TECHNOLOGY VALVE: PRODUCT PORTFOLIO
- TABLE 114. FLOWSERVE CORP.: KEY EXECUTIVES
- TABLE 115. FLOWSERVE CORP.: COMPANY SNAPSHOT
- TABLE 116. FLOWSERVE CORP.: PRODUCT SEGMENTS
- TABLE 117. FLOWSERVE CORP.: PRODUCT PORTFOLIO
- TABLE 118. FLUIDCHEM VALVES (INDIA) PVT. LTD.: KEY EXECUTIVES
- TABLE 119. FLUIDCHEM VALVES (INDIA) PVT. LTD.: COMPANY SNAPSHOT
- TABLE 120. FLUIDCHEM VALVES (INDIA) PVT. LTD.: PRODUCT SEGMENTS
- TABLE 121. FLUIDCHEM VALVES (INDIA) PVT. LTD.: PRODUCT PORTFOLIO
LIST OF FIGURES
- FIGURE 01. WATER AND WASTEWATER VALVE MARKET, 2020-2032
- FIGURE 02. SEGMENTATION OF WATER AND WASTEWATER VALVE MARKET, 2020-2032
- FIGURE 03. WATER AND WASTEWATER VALVE MARKET,2020-2032
- FIGURE 04. TOP INVESTMENT POCKETS IN WATER AND WASTEWATER VALVE MARKET (2023-2032)
- FIGURE 05. LOW BARGAINING POWER OF SUPPLIERS
- FIGURE 06. LOW THREAT OF NEW ENTRANTS
- FIGURE 07. LOW THREAT OF SUBSTITUTES
- FIGURE 08. LOW INTENSITY OF RIVALRY
- FIGURE 09. LOW BARGAINING POWER OF BUYERS
- FIGURE 10. GLOBAL WATER AND WASTEWATER VALVE MARKET:DRIVERS, RESTRAINTS AND OPPORTUNITIES
- FIGURE 11. WATER AND WASTEWATER VALVE MARKET, BY TYPE, 2020(%)
- FIGURE 12. COMPARATIVE SHARE ANALYSIS OF WATER AND WASTEWATER VALVE MARKET FOR GATE, BY COUNTRY 2020 AND 2032(%)
- FIGURE 13. COMPARATIVE SHARE ANALYSIS OF WATER AND WASTEWATER VALVE MARKET FOR BALL, BY COUNTRY 2020 AND 2032(%)
- FIGURE 14. COMPARATIVE SHARE ANALYSIS OF WATER AND WASTEWATER VALVE MARKET FOR BUTTERFLY, BY COUNTRY 2020 AND 2032(%)
- FIGURE 15. COMPARATIVE SHARE ANALYSIS OF WATER AND WASTEWATER VALVE MARKET FOR GLOBE, BY COUNTRY 2020 AND 2032(%)
- FIGURE 16. COMPARATIVE SHARE ANALYSIS OF WATER AND WASTEWATER VALVE MARKET FOR OTHERS, BY COUNTRY 2020 AND 2032(%)
- FIGURE 17. WATER AND WASTEWATER VALVE MARKET, BY MATERIAL, 2020(%)
- FIGURE 18. COMPARATIVE SHARE ANALYSIS OF WATER AND WASTEWATER VALVE MARKET FOR CAST IRON, BY COUNTRY 2020 AND 2032(%)
- FIGURE 19. COMPARATIVE SHARE ANALYSIS OF WATER AND WASTEWATER VALVE MARKET FOR STEEL, BY COUNTRY 2020 AND 2032(%)
- FIGURE 20. COMPARATIVE SHARE ANALYSIS OF WATER AND WASTEWATER VALVE MARKET FOR ALLOY BASED, BY COUNTRY 2020 AND 2032(%)
- FIGURE 21. COMPARATIVE SHARE ANALYSIS OF WATER AND WASTEWATER VALVE MARKET FOR OTHERS, BY COUNTRY 2020 AND 2032(%)
- FIGURE 22. WATER AND WASTEWATER VALVE MARKET, BY END USER INDUSTRY, 2020(%)
- FIGURE 23. COMPARATIVE SHARE ANALYSIS OF WATER AND WASTEWATER VALVE MARKET FOR OIL AND GAS, BY COUNTRY 2020 AND 2032(%)
- FIGURE 24. COMPARATIVE SHARE ANALYSIS OF WATER AND WASTEWATER VALVE MARKET FOR CHEMICAL, BY COUNTRY 2020 AND 2032(%)
- FIGURE 25. COMPARATIVE SHARE ANALYSIS OF WATER AND WASTEWATER VALVE MARKET FOR POWER GENERATION, BY COUNTRY 2020 AND 2032(%)
- FIGURE 26. COMPARATIVE SHARE ANALYSIS OF WATER AND WASTEWATER VALVE MARKET FOR OTHERS, BY COUNTRY 2020 AND 2032(%)
- FIGURE 27. WATER AND WASTEWATER VALVE MARKET BY REGION, 2020(%)
- FIGURE 28. U.S. WATER AND WASTEWATER VALVE MARKET, 2020-2032 ($MILLION)
- FIGURE 29. CANADA WATER AND WASTEWATER VALVE MARKET, 2020-2032 ($MILLION)
- FIGURE 30. MEXICO WATER AND WASTEWATER VALVE MARKET, 2020-2032 ($MILLION)
- FIGURE 31. GERMANY WATER AND WASTEWATER VALVE MARKET, 2020-2032 ($MILLION)
- FIGURE 32. UK WATER AND WASTEWATER VALVE MARKET, 2020-2032 ($MILLION)
- FIGURE 33. FRANCE WATER AND WASTEWATER VALVE MARKET, 2020-2032 ($MILLION)
- FIGURE 34. ITALY WATER AND WASTEWATER VALVE MARKET, 2020-2032 ($MILLION)
- FIGURE 35. REST OF EUROPE WATER AND WASTEWATER VALVE MARKET, 2020-2032 ($MILLION)
- FIGURE 36. CHINA WATER AND WASTEWATER VALVE MARKET, 2020-2032 ($MILLION)
- FIGURE 37. JAPAN WATER AND WASTEWATER VALVE MARKET, 2020-2032 ($MILLION)
- FIGURE 38. INDIA WATER AND WASTEWATER VALVE MARKET, 2020-2032 ($MILLION)
- FIGURE 39. SOUTH KOREA WATER AND WASTEWATER VALVE MARKET, 2020-2032 ($MILLION)
- FIGURE 40. REST OF ASIA-PACIFIC WATER AND WASTEWATER VALVE MARKET, 2020-2032 ($MILLION)
- FIGURE 41. LATIN AMERICA WATER AND WASTEWATER VALVE MARKET, 2020-2032 ($MILLION)
- FIGURE 42. MIDDLE EAST WATER AND WASTEWATER VALVE MARKET, 2020-2032 ($MILLION)
- FIGURE 43. AFRICA WATER AND WASTEWATER VALVE MARKET, 2020-2032 ($MILLION)
- FIGURE 44. TOP WINNING STRATEGIES, BY YEAR
- FIGURE 45. TOP WINNING STRATEGIES, BY DEVELOPMENT
- FIGURE 46. TOP WINNING STRATEGIES, BY COMPANY
- FIGURE 47. PRODUCT MAPPING OF TOP 10 PLAYERS
- FIGURE 48. COMPETITIVE DASHBOARD
- FIGURE 49. COMPETITIVE HEATMAP: WATER AND WASTEWATER VALVE MARKET
- FIGURE 50. TOP PLAYER POSITIONING, 2020
- FIGURE 51. EMERSON ELECTRIC CO.: NET SALES, 2020-2022 ($MILLION)
- FIGURE 52. EMERSON ELECTRIC CO.: RESEARCH & DEVELOPMENT EXPENDITURE, 2020-2022 ($MILLION)
- FIGURE 53. EMERSON ELECTRIC CO.: REVENUE SHARE BY SEGMENT, 2021 (%)
- FIGURE 54. EMERSON ELECTRIC CO.: REVENUE SHARE BY REGION, 2021 (%)
- FIGURE 55. FLOWSERVE CORP.: NET SALES, 2019-2021 ($MILLION)
- FIGURE 56. FLOWSERVE CORP.: RESEARCH & DEVELOPMENT EXPENDITURE, 2019-2021
- FIGURE 57. FLOWSERVE CORP.: REVENUE SHARE BY SEGMENT, 2021 (%)
- FIGURE 58. FLOWSERVE CORP.: REVENUE SHARE BY REGION, 2021 (%)

