
PUBLISHER: Allied Market Research | PRODUCT CODE: 1365649

PUBLISHER: Allied Market Research | PRODUCT CODE: 1365649
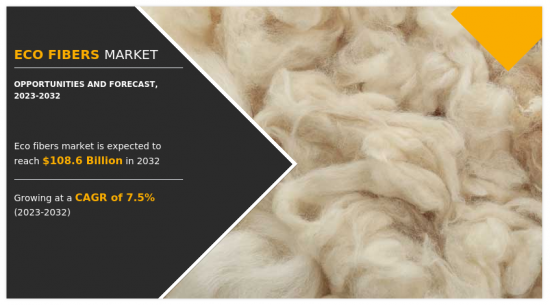
Eco Fibers Market By Type (Organic, Regenerated, Recycled), By End-use (Textile, Industrial, Medical, Household and Furnishing, Others): Global Opportunity Analysis and Industry Forecast, 2023-2032
According to a new report published by Allied Market Research, titled, "Eco Fibers Market," The eco fibers market was valued at $52.8 billion in 2022, and is estimated to reach $108.6 billion by 2032, growing at a CAGR of 7.5% from 2023 to 2032.
Eco fiber refers to a type of fiber that is produced using environmentally friendly and sustainable practices. It is designed to minimize the environmental impact associated with fiber production and consumption. Eco fibers are typically sourced from renewable materials, such as plants or recycled materials, and they often undergo processes that reduce resource consumption, chemical usage, and waste generation.
Eco fibers have gained significant traction in the household and furnishing sector as consumers increasingly prioritize sustainable and environmentally friendly products for their homes. Eco fibers are used in upholstery fabrics and furniture coverings. Natural fibers such as organic cotton, linen, hemp, and jute are employed to create sustainable and stylish options for sofas, chairs, cushions, and ottomans. Eco-friendly upholstery fibers contribute to a healthier indoor environment and reduce the use of synthetic materials. Also, eco fibers such as wool, jute, seagrass, and sisal are used in the production of sustainable carpets and rugs.
These natural fibers provide a renewable and biodegradable alternative to synthetic materials. Eco fibers such as organic cotton and linen are used in the production of tablecloths, placemats, and napkins. These fibers offer durability and a natural aesthetic to table settings, making meals more sustainable and elegant. Besides, these fibers find application in storage and organization products. Baskets, bins, and storage containers made from natural fibers such as seagrass, rattan, or banana leaf provide a sustainable and attractive storage solution.
Furthermore, governments and regulatory bodies are implementing policies and standards that promote sustainability and encourage the use of eco fibers. Regulations may include restrictions on harmful chemicals, waste management requirements, or labeling standards for eco-friendly products. This regulatory support provides incentives for businesses to adopt eco fibers and meet sustainability criteria. Besides, consumers are increasingly seeking products that align with their values and have a reduced environmental impact. Eco fibers, with their sustainable and natural properties, appeal to environmentally conscious consumers who prioritize sustainable fashion and lifestyle choices. The demand for eco-friendly products, including clothing, home textiles, and personal care items, is driving market growth for eco fibers.
The eco fibers market is segmented on the basis of type, end-use, and region. By type, the market is categorized into organic, regenerated, and recycled. By end-use, the market is divided into textile, industrial, medical, household & furnishing, and others. By region, the market is analyzed across North America, Europe, Asia-Pacific, and LAMEA.
The report covers strategies adopted by key players in the market to sustain the competitive environment and increase their market share. The key players operating in the eco fibers market include Grasim Industries Ltd; Teijin Limited; Lenzing AG; Shanghai Tenbro Bamboo Textile Co.,Ltd.; Pilipinas Ecofiber Corporation; David C. Poole Company, Inc; China Bambro Textile Co., Ltd.; Sateri; Universal Fibers Inc.; and Tangshan Sanyou Group Xingda Chemical Fibre Co.Ltd. In addition, the market drivers, restraints, and opportunities are explained in the report.
Key Benefits For Stakeholders
- This report provides a quantitative analysis of the market segments, current trends, estimations, and dynamics of the eco fibers market analysis from 2022 to 2032 to identify the prevailing eco fibers market opportunities.
- The market research is offered along with information related to key drivers, restraints, and opportunities.
- Porter's five forces analysis highlights the potency of buyers and suppliers to enable stakeholders make profit-oriented business decisions and strengthen their supplier-buyer network.
- In-depth analysis of the eco fibers market segmentation assists to determine the prevailing market opportunities.
- Major countries in each region are mapped according to their revenue contribution to the global market.
- Market player positioning facilitates benchmarking and provides a clear understanding of the present position of the market players.
- The report includes the analysis of the regional as well as global eco fibers market trends, key players, market segments, application areas, and market growth strategies.
Additional benefits you will get with this purchase are:
- Quarterly Update and* (only available with a corporate license, on listed price)
- 5 additional Company Profile of client Choice pre- or Post-purchase, as a free update.
- Free Upcoming Version on the Purchase of Five and Enterprise User License.
- 16 analyst hours of support* (post-purchase, if you find additional data requirements upon review of the report, you may receive support amounting to 16 analyst hours to solve questions, and post-sale queries)
- 15% Free Customization* (in case the scope or segment of the report does not match your requirements, 20% is equivalent to 3 working days of free work, applicable once)
- Free data Pack on the Five and Enterprise User License. (Excel version of the report)
- Free Updated report if the report is 6-12 months old or older.
- 24-hour priority response*
- Free Industry updates and white papers.
Possible Customization with this report (with additional cost and timeline talk to the sales executive to know more)
- Additional company profiles with specific to client's interest
- Additional country or region analysis- market size and forecast
- Expanded list for Company Profiles
- SWOT Analysis
Key Market Segments
By Type
- Organic
- Regenerated
- Recycled
By End-use
- Textile
- Industrial
- Medical
- Household and Furnishing
- Others
By Region
- North America
- U.S.
- Canada
- Mexico
- Europe
- Germany
- France
- Italy
- UK
- Spain
- Rest of Europe
- Asia-Pacific
- China
- India
- Japan
- South Korea
- Australia
- Rest of Asia-Pacific
- LAMEA
- Brazil
- Saudi Arabia
- South Africa
- Rest of LAMEA
Key Market Players:
- China Bambro Textile Co., Ltd.
- David C. Poole Company, Inc.
- Grasim Industries Ltd.
- Lenzing AG
- Pilipinas Ecofiber Corporation
- Sateri
- Shanghai Tenbro Bamboo Textile Co., Ltd.
- Tangshan Sanyou Group Xingda Chemical Fibre Co. Ltd
- TEIJIN LIMITED
- Universal Fibers Inc.
TABLE OF CONTENTS
CHAPTER 1: INTRODUCTION
- 1.1. Report description
- 1.2. Key market segments
- 1.3. Key benefits to the stakeholders
- 1.4. Research Methodology
- 1.4.1. Primary research
- 1.4.2. Secondary research
- 1.4.3. Analyst tools and models
CHAPTER 2: EXECUTIVE SUMMARY
- 2.1. CXO Perspective
CHAPTER 3: MARKET OVERVIEW
- 3.1. Market definition and scope
- 3.2. Key findings
- 3.2.1. Top impacting factors
- 3.2.2. Top investment pockets
- 3.3. Porter's five forces analysis
- 3.3.1. Low bargaining power of suppliers
- 3.3.2. Low threat of new entrants
- 3.3.3. Low threat of substitutes
- 3.3.4. Low intensity of rivalry
- 3.3.5. Low bargaining power of buyers
- 3.4. Market dynamics
- 3.4.1. Drivers
- 3.4.1.1. Rising demand for eco fiber in textile industry
- 3.4.1.2. Surge in use of eco-fiber in household applications
- 3.4.1. Drivers
- 3.4.2. Restraints
- 3.4.2.1. High price of eco fiber
- 3.4.3. Opportunities
- 3.4.3.1. Innovation and technological advancement
- 3.5. COVID-19 Impact Analysis on the market
- 3.6. Pricing Analysis
- 3.7. Key Regulation Analysis
- 3.8. Patent Landscape
CHAPTER 4: ECO FIBERS MARKET, BY TYPE
- 4.1. Overview
- 4.1.1. Market size and forecast
- 4.2. Organic
- 4.2.1. Key market trends, growth factors and opportunities
- 4.2.2. Market size and forecast, by region
- 4.2.3. Market share analysis by country
- 4.3. Regenerated
- 4.3.1. Key market trends, growth factors and opportunities
- 4.3.2. Market size and forecast, by region
- 4.3.3. Market share analysis by country
- 4.4. Recycled
- 4.4.1. Key market trends, growth factors and opportunities
- 4.4.2. Market size and forecast, by region
- 4.4.3. Market share analysis by country
CHAPTER 5: ECO FIBERS MARKET, BY END-USE
- 5.1. Overview
- 5.1.1. Market size and forecast
- 5.2. Textile
- 5.2.1. Key market trends, growth factors and opportunities
- 5.2.2. Market size and forecast, by region
- 5.2.3. Market share analysis by country
- 5.3. Industrial
- 5.3.1. Key market trends, growth factors and opportunities
- 5.3.2. Market size and forecast, by region
- 5.3.3. Market share analysis by country
- 5.4. Medical
- 5.4.1. Key market trends, growth factors and opportunities
- 5.4.2. Market size and forecast, by region
- 5.4.3. Market share analysis by country
- 5.5. Household and Furnishing
- 5.5.1. Key market trends, growth factors and opportunities
- 5.5.2. Market size and forecast, by region
- 5.5.3. Market share analysis by country
- 5.6. Others
- 5.6.1. Key market trends, growth factors and opportunities
- 5.6.2. Market size and forecast, by region
- 5.6.3. Market share analysis by country
CHAPTER 6: ECO FIBERS MARKET, BY REGION
- 6.1. Overview
- 6.1.1. Market size and forecast By Region
- 6.2. North America
- 6.2.1. Key trends and opportunities
- 6.2.2. Market size and forecast, by Type
- 6.2.3. Market size and forecast, by End-use
- 6.2.4. Market size and forecast, by country
- 6.2.4.1. U.S.
- 6.2.4.1.1. Key market trends, growth factors and opportunities
- 6.2.4.1.2. Market size and forecast, by Type
- 6.2.4.1.3. Market size and forecast, by End-use
- 6.2.4.2. Canada
- 6.2.4.2.1. Key market trends, growth factors and opportunities
- 6.2.4.2.2. Market size and forecast, by Type
- 6.2.4.2.3. Market size and forecast, by End-use
- 6.2.4.3. Mexico
- 6.2.4.3.1. Key market trends, growth factors and opportunities
- 6.2.4.3.2. Market size and forecast, by Type
- 6.2.4.3.3. Market size and forecast, by End-use
- 6.3. Europe
- 6.3.1. Key trends and opportunities
- 6.3.2. Market size and forecast, by Type
- 6.3.3. Market size and forecast, by End-use
- 6.3.4. Market size and forecast, by country
- 6.3.4.1. Germany
- 6.3.4.1.1. Key market trends, growth factors and opportunities
- 6.3.4.1.2. Market size and forecast, by Type
- 6.3.4.1.3. Market size and forecast, by End-use
- 6.3.4.2. France
- 6.3.4.2.1. Key market trends, growth factors and opportunities
- 6.3.4.2.2. Market size and forecast, by Type
- 6.3.4.2.3. Market size and forecast, by End-use
- 6.3.4.3. Italy
- 6.3.4.3.1. Key market trends, growth factors and opportunities
- 6.3.4.3.2. Market size and forecast, by Type
- 6.3.4.3.3. Market size and forecast, by End-use
- 6.3.4.4. UK
- 6.3.4.4.1. Key market trends, growth factors and opportunities
- 6.3.4.4.2. Market size and forecast, by Type
- 6.3.4.4.3. Market size and forecast, by End-use
- 6.3.4.5. Spain
- 6.3.4.5.1. Key market trends, growth factors and opportunities
- 6.3.4.5.2. Market size and forecast, by Type
- 6.3.4.5.3. Market size and forecast, by End-use
- 6.3.4.6. Rest of Europe
- 6.3.4.6.1. Key market trends, growth factors and opportunities
- 6.3.4.6.2. Market size and forecast, by Type
- 6.3.4.6.3. Market size and forecast, by End-use
- 6.4. Asia-Pacific
- 6.4.1. Key trends and opportunities
- 6.4.2. Market size and forecast, by Type
- 6.4.3. Market size and forecast, by End-use
- 6.4.4. Market size and forecast, by country
- 6.4.4.1. China
- 6.4.4.1.1. Key market trends, growth factors and opportunities
- 6.4.4.1.2. Market size and forecast, by Type
- 6.4.4.1.3. Market size and forecast, by End-use
- 6.4.4.2. India
- 6.4.4.2.1. Key market trends, growth factors and opportunities
- 6.4.4.2.2. Market size and forecast, by Type
- 6.4.4.2.3. Market size and forecast, by End-use
- 6.4.4.3. Japan
- 6.4.4.3.1. Key market trends, growth factors and opportunities
- 6.4.4.3.2. Market size and forecast, by Type
- 6.4.4.3.3. Market size and forecast, by End-use
- 6.4.4.4. South Korea
- 6.4.4.4.1. Key market trends, growth factors and opportunities
- 6.4.4.4.2. Market size and forecast, by Type
- 6.4.4.4.3. Market size and forecast, by End-use
- 6.4.4.5. Australia
- 6.4.4.5.1. Key market trends, growth factors and opportunities
- 6.4.4.5.2. Market size and forecast, by Type
- 6.4.4.5.3. Market size and forecast, by End-use
- 6.4.4.6. Rest of Asia-Pacific
- 6.4.4.6.1. Key market trends, growth factors and opportunities
- 6.4.4.6.2. Market size and forecast, by Type
- 6.4.4.6.3. Market size and forecast, by End-use
- 6.5. LAMEA
- 6.5.1. Key trends and opportunities
- 6.5.2. Market size and forecast, by Type
- 6.5.3. Market size and forecast, by End-use
- 6.5.4. Market size and forecast, by country
- 6.5.4.1. Brazil
- 6.5.4.1.1. Key market trends, growth factors and opportunities
- 6.5.4.1.2. Market size and forecast, by Type
- 6.5.4.1.3. Market size and forecast, by End-use
- 6.5.4.2. Saudi Arabia
- 6.5.4.2.1. Key market trends, growth factors and opportunities
- 6.5.4.2.2. Market size and forecast, by Type
- 6.5.4.2.3. Market size and forecast, by End-use
- 6.5.4.3. South Africa
- 6.5.4.3.1. Key market trends, growth factors and opportunities
- 6.5.4.3.2. Market size and forecast, by Type
- 6.5.4.3.3. Market size and forecast, by End-use
- 6.5.4.4. Rest of LAMEA
- 6.5.4.4.1. Key market trends, growth factors and opportunities
- 6.5.4.4.2. Market size and forecast, by Type
- 6.5.4.4.3. Market size and forecast, by End-use
CHAPTER 7: COMPETITIVE LANDSCAPE
- 7.1. Introduction
- 7.2. Top winning strategies
- 7.3. Product Mapping of Top 10 Player
- 7.4. Competitive Dashboard
- 7.5. Competitive Heatmap
- 7.6. Top player positioning, 2022
CHAPTER 8: COMPANY PROFILES
- 8.1. Grasim Industries Ltd.
- 8.1.1. Company overview
- 8.1.2. Key Executives
- 8.1.3. Company snapshot
- 8.1.4. Operating business segments
- 8.1.5. Product portfolio
- 8.1.6. Business performance
- 8.2. TEIJIN LIMITED
- 8.2.1. Company overview
- 8.2.2. Key Executives
- 8.2.3. Company snapshot
- 8.2.4. Operating business segments
- 8.2.5. Product portfolio
- 8.2.6. Business performance
- 8.3. Lenzing AG
- 8.3.1. Company overview
- 8.3.2. Key Executives
- 8.3.3. Company snapshot
- 8.3.4. Operating business segments
- 8.3.5. Product portfolio
- 8.3.6. Business performance
- 8.3.7. Key strategic moves and developments
- 8.4. Shanghai Tenbro Bamboo Textile Co., Ltd.
- 8.4.1. Company overview
- 8.4.2. Key Executives
- 8.4.3. Company snapshot
- 8.4.4. Operating business segments
- 8.4.5. Product portfolio
- 8.5. Pilipinas Ecofiber Corporation
- 8.5.1. Company overview
- 8.5.2. Key Executives
- 8.5.3. Company snapshot
- 8.5.4. Operating business segments
- 8.5.5. Product portfolio
- 8.6. David C. Poole Company, Inc.
- 8.6.1. Company overview
- 8.6.2. Key Executives
- 8.6.3. Company snapshot
- 8.6.4. Operating business segments
- 8.6.5. Product portfolio
- 8.7. China Bambro Textile Co., Ltd.
- 8.7.1. Company overview
- 8.7.2. Key Executives
- 8.7.3. Company snapshot
- 8.7.4. Operating business segments
- 8.7.5. Product portfolio
- 8.8. Sateri
- 8.8.1. Company overview
- 8.8.2. Key Executives
- 8.8.3. Company snapshot
- 8.8.4. Operating business segments
- 8.8.5. Product portfolio
- 8.8.6. Key strategic moves and developments
- 8.9. Universal Fibers Inc.
- 8.9.1. Company overview
- 8.9.2. Key Executives
- 8.9.3. Company snapshot
- 8.9.4. Operating business segments
- 8.9.5. Product portfolio
- 8.10. Tangshan Sanyou Group Xingda Chemical Fibre Co. Ltd
- 8.10.1. Company overview
- 8.10.2. Key Executives
- 8.10.3. Company snapshot
- 8.10.4. Operating business segments
- 8.10.5. Product portfolio
LIST OF TABLES
- TABLE 01. GLOBAL ECO FIBERS MARKET, BY TYPE, 2022-2032 ($MILLION)
- TABLE 02. GLOBAL ECO FIBERS MARKET, BY TYPE, 2022-2032 (KILOTON)
- TABLE 03. ECO FIBERS MARKET FOR ORGANIC, BY REGION, 2022-2032 ($MILLION)
- TABLE 04. ECO FIBERS MARKET FOR ORGANIC, BY REGION, 2022-2032 (KILOTON)
- TABLE 05. ECO FIBERS MARKET FOR REGENERATED, BY REGION, 2022-2032 ($MILLION)
- TABLE 06. ECO FIBERS MARKET FOR REGENERATED, BY REGION, 2022-2032 (KILOTON)
- TABLE 07. ECO FIBERS MARKET FOR RECYCLED, BY REGION, 2022-2032 ($MILLION)
- TABLE 08. ECO FIBERS MARKET FOR RECYCLED, BY REGION, 2022-2032 (KILOTON)
- TABLE 09. GLOBAL ECO FIBERS MARKET, BY END-USE, 2022-2032 ($MILLION)
- TABLE 10. GLOBAL ECO FIBERS MARKET, BY END-USE, 2022-2032 (KILOTON)
- TABLE 11. ECO FIBERS MARKET FOR TEXTILE, BY REGION, 2022-2032 ($MILLION)
- TABLE 12. ECO FIBERS MARKET FOR TEXTILE, BY REGION, 2022-2032 (KILOTON)
- TABLE 13. ECO FIBERS MARKET FOR INDUSTRIAL, BY REGION, 2022-2032 ($MILLION)
- TABLE 14. ECO FIBERS MARKET FOR INDUSTRIAL, BY REGION, 2022-2032 (KILOTON)
- TABLE 15. ECO FIBERS MARKET FOR MEDICAL, BY REGION, 2022-2032 ($MILLION)
- TABLE 16. ECO FIBERS MARKET FOR MEDICAL, BY REGION, 2022-2032 (KILOTON)
- TABLE 17. ECO FIBERS MARKET FOR HOUSEHOLD AND FURNISHING, BY REGION, 2022-2032 ($MILLION)
- TABLE 18. ECO FIBERS MARKET FOR HOUSEHOLD AND FURNISHING, BY REGION, 2022-2032 (KILOTON)
- TABLE 19. ECO FIBERS MARKET FOR OTHERS, BY REGION, 2022-2032 ($MILLION)
- TABLE 20. ECO FIBERS MARKET FOR OTHERS, BY REGION, 2022-2032 (KILOTON)
- TABLE 21. ECO FIBERS MARKET, BY REGION, 2022-2032 ($MILLION)
- TABLE 22. ECO FIBERS MARKET, BY REGION, 2022-2032 (KILOTON)
- TABLE 23. NORTH AMERICA ECO FIBERS MARKET, BY TYPE, 2022-2032 ($MILLION)
- TABLE 24. NORTH AMERICA ECO FIBERS MARKET, BY TYPE, 2022-2032 (KILOTON)
- TABLE 25. NORTH AMERICA ECO FIBERS MARKET, BY END-USE, 2022-2032 ($MILLION)
- TABLE 26. NORTH AMERICA ECO FIBERS MARKET, BY END-USE, 2022-2032 (KILOTON)
- TABLE 27. NORTH AMERICA ECO FIBERS MARKET, BY COUNTRY, 2022-2032 ($MILLION)
- TABLE 28. NORTH AMERICA ECO FIBERS MARKET, BY COUNTRY, 2022-2032 (KILOTON)
- TABLE 29. U.S. ECO FIBERS MARKET, BY TYPE, 2022-2032 ($MILLION)
- TABLE 30. U.S. ECO FIBERS MARKET, BY TYPE, 2022-2032 (KILOTON)
- TABLE 31. U.S. ECO FIBERS MARKET, BY END-USE, 2022-2032 ($MILLION)
- TABLE 32. U.S. ECO FIBERS MARKET, BY END-USE, 2022-2032 (KILOTON)
- TABLE 33. CANADA ECO FIBERS MARKET, BY TYPE, 2022-2032 ($MILLION)
- TABLE 34. CANADA ECO FIBERS MARKET, BY TYPE, 2022-2032 (KILOTON)
- TABLE 35. CANADA ECO FIBERS MARKET, BY END-USE, 2022-2032 ($MILLION)
- TABLE 36. CANADA ECO FIBERS MARKET, BY END-USE, 2022-2032 (KILOTON)
- TABLE 37. MEXICO ECO FIBERS MARKET, BY TYPE, 2022-2032 ($MILLION)
- TABLE 38. MEXICO ECO FIBERS MARKET, BY TYPE, 2022-2032 (KILOTON)
- TABLE 39. MEXICO ECO FIBERS MARKET, BY END-USE, 2022-2032 ($MILLION)
- TABLE 40. MEXICO ECO FIBERS MARKET, BY END-USE, 2022-2032 (KILOTON)
- TABLE 41. EUROPE ECO FIBERS MARKET, BY TYPE, 2022-2032 ($MILLION)
- TABLE 42. EUROPE ECO FIBERS MARKET, BY TYPE, 2022-2032 (KILOTON)
- TABLE 43. EUROPE ECO FIBERS MARKET, BY END-USE, 2022-2032 ($MILLION)
- TABLE 44. EUROPE ECO FIBERS MARKET, BY END-USE, 2022-2032 (KILOTON)
- TABLE 45. EUROPE ECO FIBERS MARKET, BY COUNTRY, 2022-2032 ($MILLION)
- TABLE 46. EUROPE ECO FIBERS MARKET, BY COUNTRY, 2022-2032 (KILOTON)
- TABLE 47. GERMANY ECO FIBERS MARKET, BY TYPE, 2022-2032 ($MILLION)
- TABLE 48. GERMANY ECO FIBERS MARKET, BY TYPE, 2022-2032 (KILOTON)
- TABLE 49. GERMANY ECO FIBERS MARKET, BY END-USE, 2022-2032 ($MILLION)
- TABLE 50. GERMANY ECO FIBERS MARKET, BY END-USE, 2022-2032 (KILOTON)
- TABLE 51. FRANCE ECO FIBERS MARKET, BY TYPE, 2022-2032 ($MILLION)
- TABLE 52. FRANCE ECO FIBERS MARKET, BY TYPE, 2022-2032 (KILOTON)
- TABLE 53. FRANCE ECO FIBERS MARKET, BY END-USE, 2022-2032 ($MILLION)
- TABLE 54. FRANCE ECO FIBERS MARKET, BY END-USE, 2022-2032 (KILOTON)
- TABLE 55. ITALY ECO FIBERS MARKET, BY TYPE, 2022-2032 ($MILLION)
- TABLE 56. ITALY ECO FIBERS MARKET, BY TYPE, 2022-2032 (KILOTON)
- TABLE 57. ITALY ECO FIBERS MARKET, BY END-USE, 2022-2032 ($MILLION)
- TABLE 58. ITALY ECO FIBERS MARKET, BY END-USE, 2022-2032 (KILOTON)
- TABLE 59. UK ECO FIBERS MARKET, BY TYPE, 2022-2032 ($MILLION)
- TABLE 60. UK ECO FIBERS MARKET, BY TYPE, 2022-2032 (KILOTON)
- TABLE 61. UK ECO FIBERS MARKET, BY END-USE, 2022-2032 ($MILLION)
- TABLE 62. UK ECO FIBERS MARKET, BY END-USE, 2022-2032 (KILOTON)
- TABLE 63. SPAIN ECO FIBERS MARKET, BY TYPE, 2022-2032 ($MILLION)
- TABLE 64. SPAIN ECO FIBERS MARKET, BY TYPE, 2022-2032 (KILOTON)
- TABLE 65. SPAIN ECO FIBERS MARKET, BY END-USE, 2022-2032 ($MILLION)
- TABLE 66. SPAIN ECO FIBERS MARKET, BY END-USE, 2022-2032 (KILOTON)
- TABLE 67. REST OF EUROPE ECO FIBERS MARKET, BY TYPE, 2022-2032 ($MILLION)
- TABLE 68. REST OF EUROPE ECO FIBERS MARKET, BY TYPE, 2022-2032 (KILOTON)
- TABLE 69. REST OF EUROPE ECO FIBERS MARKET, BY END-USE, 2022-2032 ($MILLION)
- TABLE 70. REST OF EUROPE ECO FIBERS MARKET, BY END-USE, 2022-2032 (KILOTON)
- TABLE 71. ASIA-PACIFIC ECO FIBERS MARKET, BY TYPE, 2022-2032 ($MILLION)
- TABLE 72. ASIA-PACIFIC ECO FIBERS MARKET, BY TYPE, 2022-2032 (KILOTON)
- TABLE 73. ASIA-PACIFIC ECO FIBERS MARKET, BY END-USE, 2022-2032 ($MILLION)
- TABLE 74. ASIA-PACIFIC ECO FIBERS MARKET, BY END-USE, 2022-2032 (KILOTON)
- TABLE 75. ASIA-PACIFIC ECO FIBERS MARKET, BY COUNTRY, 2022-2032 ($MILLION)
- TABLE 76. ASIA-PACIFIC ECO FIBERS MARKET, BY COUNTRY, 2022-2032 (KILOTON)
- TABLE 77. CHINA ECO FIBERS MARKET, BY TYPE, 2022-2032 ($MILLION)
- TABLE 78. CHINA ECO FIBERS MARKET, BY TYPE, 2022-2032 (KILOTON)
- TABLE 79. CHINA ECO FIBERS MARKET, BY END-USE, 2022-2032 ($MILLION)
- TABLE 80. CHINA ECO FIBERS MARKET, BY END-USE, 2022-2032 (KILOTON)
- TABLE 81. INDIA ECO FIBERS MARKET, BY TYPE, 2022-2032 ($MILLION)
- TABLE 82. INDIA ECO FIBERS MARKET, BY TYPE, 2022-2032 (KILOTON)
- TABLE 83. INDIA ECO FIBERS MARKET, BY END-USE, 2022-2032 ($MILLION)
- TABLE 84. INDIA ECO FIBERS MARKET, BY END-USE, 2022-2032 (KILOTON)
- TABLE 85. JAPAN ECO FIBERS MARKET, BY TYPE, 2022-2032 ($MILLION)
- TABLE 86. JAPAN ECO FIBERS MARKET, BY TYPE, 2022-2032 (KILOTON)
- TABLE 87. JAPAN ECO FIBERS MARKET, BY END-USE, 2022-2032 ($MILLION)
- TABLE 88. JAPAN ECO FIBERS MARKET, BY END-USE, 2022-2032 (KILOTON)
- TABLE 89. SOUTH KOREA ECO FIBERS MARKET, BY TYPE, 2022-2032 ($MILLION)
- TABLE 90. SOUTH KOREA ECO FIBERS MARKET, BY TYPE, 2022-2032 (KILOTON)
- TABLE 91. SOUTH KOREA ECO FIBERS MARKET, BY END-USE, 2022-2032 ($MILLION)
- TABLE 92. SOUTH KOREA ECO FIBERS MARKET, BY END-USE, 2022-2032 (KILOTON)
- TABLE 93. AUSTRALIA ECO FIBERS MARKET, BY TYPE, 2022-2032 ($MILLION)
- TABLE 94. AUSTRALIA ECO FIBERS MARKET, BY TYPE, 2022-2032 (KILOTON)
- TABLE 95. AUSTRALIA ECO FIBERS MARKET, BY END-USE, 2022-2032 ($MILLION)
- TABLE 96. AUSTRALIA ECO FIBERS MARKET, BY END-USE, 2022-2032 (KILOTON)
- TABLE 97. REST OF ASIA-PACIFIC ECO FIBERS MARKET, BY TYPE, 2022-2032 ($MILLION)
- TABLE 98. REST OF ASIA-PACIFIC ECO FIBERS MARKET, BY TYPE, 2022-2032 (KILOTON)
- TABLE 99. REST OF ASIA-PACIFIC ECO FIBERS MARKET, BY END-USE, 2022-2032 ($MILLION)
- TABLE 100. REST OF ASIA-PACIFIC ECO FIBERS MARKET, BY END-USE, 2022-2032 (KILOTON)
- TABLE 101. LAMEA ECO FIBERS MARKET, BY TYPE, 2022-2032 ($MILLION)
- TABLE 102. LAMEA ECO FIBERS MARKET, BY TYPE, 2022-2032 (KILOTON)
- TABLE 103. LAMEA ECO FIBERS MARKET, BY END-USE, 2022-2032 ($MILLION)
- TABLE 104. LAMEA ECO FIBERS MARKET, BY END-USE, 2022-2032 (KILOTON)
- TABLE 105. LAMEA ECO FIBERS MARKET, BY COUNTRY, 2022-2032 ($MILLION)
- TABLE 106. LAMEA ECO FIBERS MARKET, BY COUNTRY, 2022-2032 (KILOTON)
- TABLE 107. BRAZIL ECO FIBERS MARKET, BY TYPE, 2022-2032 ($MILLION)
- TABLE 108. BRAZIL ECO FIBERS MARKET, BY TYPE, 2022-2032 (KILOTON)
- TABLE 109. BRAZIL ECO FIBERS MARKET, BY END-USE, 2022-2032 ($MILLION)
- TABLE 110. BRAZIL ECO FIBERS MARKET, BY END-USE, 2022-2032 (KILOTON)
- TABLE 111. SAUDI ARABIA ECO FIBERS MARKET, BY TYPE, 2022-2032 ($MILLION)
- TABLE 112. SAUDI ARABIA ECO FIBERS MARKET, BY TYPE, 2022-2032 (KILOTON)
- TABLE 113. SAUDI ARABIA ECO FIBERS MARKET, BY END-USE, 2022-2032 ($MILLION)
- TABLE 114. SAUDI ARABIA ECO FIBERS MARKET, BY END-USE, 2022-2032 (KILOTON)
- TABLE 115. SOUTH AFRICA ECO FIBERS MARKET, BY TYPE, 2022-2032 ($MILLION)
- TABLE 116. SOUTH AFRICA ECO FIBERS MARKET, BY TYPE, 2022-2032 (KILOTON)
- TABLE 117. SOUTH AFRICA ECO FIBERS MARKET, BY END-USE, 2022-2032 ($MILLION)
- TABLE 118. SOUTH AFRICA ECO FIBERS MARKET, BY END-USE, 2022-2032 (KILOTON)
- TABLE 119. REST OF LAMEA ECO FIBERS MARKET, BY TYPE, 2022-2032 ($MILLION)
- TABLE 120. REST OF LAMEA ECO FIBERS MARKET, BY TYPE, 2022-2032 (KILOTON)
- TABLE 121. REST OF LAMEA ECO FIBERS MARKET, BY END-USE, 2022-2032 ($MILLION)
- TABLE 122. REST OF LAMEA ECO FIBERS MARKET, BY END-USE, 2022-2032 (KILOTON)
- TABLE 123. GRASIM INDUSTRIES LTD.: KEY EXECUTIVES
- TABLE 124. GRASIM INDUSTRIES LTD.: COMPANY SNAPSHOT
- TABLE 125. GRASIM INDUSTRIES LTD.: PRODUCT SEGMENTS
- TABLE 126. GRASIM INDUSTRIES LTD.: PRODUCT PORTFOLIO
- TABLE 127. TEIJIN LIMITED: KEY EXECUTIVES
- TABLE 128. TEIJIN LIMITED: COMPANY SNAPSHOT
- TABLE 129. TEIJIN LIMITED: PRODUCT SEGMENTS
- TABLE 130. TEIJIN LIMITED: PRODUCT PORTFOLIO
- TABLE 131. LENZING AG: KEY EXECUTIVES
- TABLE 132. LENZING AG: COMPANY SNAPSHOT
- TABLE 133. LENZING AG: PRODUCT SEGMENTS
- TABLE 134. LENZING AG: PRODUCT PORTFOLIO
- TABLE 135. LENZING AG: KEY STRATERGIES
- TABLE 136. SHANGHAI TENBRO BAMBOO TEXTILE CO., LTD.: KEY EXECUTIVES
- TABLE 137. SHANGHAI TENBRO BAMBOO TEXTILE CO., LTD.: COMPANY SNAPSHOT
- TABLE 138. SHANGHAI TENBRO BAMBOO TEXTILE CO., LTD.: SERVICE SEGMENTS
- TABLE 139. SHANGHAI TENBRO BAMBOO TEXTILE CO., LTD.: PRODUCT PORTFOLIO
- TABLE 140. PILIPINAS ECOFIBER CORPORATION: KEY EXECUTIVES
- TABLE 141. PILIPINAS ECOFIBER CORPORATION: COMPANY SNAPSHOT
- TABLE 142. PILIPINAS ECOFIBER CORPORATION: PRODUCT SEGMENTS
- TABLE 143. PILIPINAS ECOFIBER CORPORATION: PRODUCT PORTFOLIO
- TABLE 144. DAVID C. POOLE COMPANY, INC.: KEY EXECUTIVES
- TABLE 145. DAVID C. POOLE COMPANY, INC.: COMPANY SNAPSHOT
- TABLE 146. DAVID C. POOLE COMPANY, INC.: PRODUCT SEGMENTS
- TABLE 147. DAVID C. POOLE COMPANY, INC.: PRODUCT PORTFOLIO
- TABLE 148. CHINA BAMBRO TEXTILE CO., LTD.: KEY EXECUTIVES
- TABLE 149. CHINA BAMBRO TEXTILE CO., LTD.: COMPANY SNAPSHOT
- TABLE 150. CHINA BAMBRO TEXTILE CO., LTD.: PRODUCT SEGMENTS
- TABLE 151. CHINA BAMBRO TEXTILE CO., LTD.: PRODUCT PORTFOLIO
- TABLE 152. SATERI: KEY EXECUTIVES
- TABLE 153. SATERI: COMPANY SNAPSHOT
- TABLE 154. SATERI: PRODUCT SEGMENTS
- TABLE 155. SATERI: PRODUCT PORTFOLIO
- TABLE 156. SATERI: KEY STRATERGIES
- TABLE 157. UNIVERSAL FIBERS INC.: KEY EXECUTIVES
- TABLE 158. UNIVERSAL FIBERS INC.: COMPANY SNAPSHOT
- TABLE 159. UNIVERSAL FIBERS INC.: PRODUCT SEGMENTS
- TABLE 160. UNIVERSAL FIBERS INC.: PRODUCT PORTFOLIO
- TABLE 161. TANGSHAN SANYOU GROUP XINGDA CHEMICAL FIBRE CO. LTD: KEY EXECUTIVES
- TABLE 162. TANGSHAN SANYOU GROUP XINGDA CHEMICAL FIBRE CO. LTD: COMPANY SNAPSHOT
- TABLE 163. TANGSHAN SANYOU GROUP XINGDA CHEMICAL FIBRE CO. LTD: PRODUCT SEGMENTS
- TABLE 164. TANGSHAN SANYOU GROUP XINGDA CHEMICAL FIBRE CO. LTD: PRODUCT PORTFOLIO
LIST OF FIGURES
- FIGURE 01. ECO FIBERS MARKET, 2022-2032
- FIGURE 02. SEGMENTATION OF ECO FIBERS MARKET, 2022-2032
- FIGURE 03. ECO FIBERS MARKET,2022-2032
- FIGURE 04. TOP INVESTMENT POCKETS IN ECO FIBERS MARKET (2023-2032)
- FIGURE 05. LOW BARGAINING POWER OF SUPPLIERS
- FIGURE 06. LOW THREAT OF NEW ENTRANTS
- FIGURE 07. LOW THREAT OF SUBSTITUTES
- FIGURE 08. LOW INTENSITY OF RIVALRY
- FIGURE 09. LOW BARGAINING POWER OF BUYERS
- FIGURE 10. GLOBAL ECO FIBERS MARKET:DRIVERS, RESTRAINTS AND OPPORTUNITIES
- FIGURE 11. PRICING ANALYSIS: ECO FIBERS MARKET 2022 AND 2032
- FIGURE 12. IMPACT OF KEY REGULATION: ECO FIBERS MARKET
- FIGURE 13. PATENT ANALYSIS BY COMPANY
- FIGURE 14. PATENT ANALYSIS BY COUNTRY
- FIGURE 15. ECO FIBERS MARKET, BY TYPE, 2022(%)
- FIGURE 16. COMPARATIVE SHARE ANALYSIS OF ECO FIBERS MARKET FOR ORGANIC, BY COUNTRY 2022-2032(%)
- FIGURE 17. COMPARATIVE SHARE ANALYSIS OF ECO FIBERS MARKET FOR REGENERATED, BY COUNTRY 2022-2032(%)
- FIGURE 18. COMPARATIVE SHARE ANALYSIS OF ECO FIBERS MARKET FOR RECYCLED, BY COUNTRY 2022-2032(%)
- FIGURE 19. ECO FIBERS MARKET, BY END-USE, 2022(%)
- FIGURE 20. COMPARATIVE SHARE ANALYSIS OF ECO FIBERS MARKET FOR TEXTILE, BY COUNTRY 2022-2032(%)
- FIGURE 21. COMPARATIVE SHARE ANALYSIS OF ECO FIBERS MARKET FOR INDUSTRIAL, BY COUNTRY 2022-2032(%)
- FIGURE 22. COMPARATIVE SHARE ANALYSIS OF ECO FIBERS MARKET FOR MEDICAL, BY COUNTRY 2022-2032(%)
- FIGURE 23. COMPARATIVE SHARE ANALYSIS OF ECO FIBERS MARKET FOR HOUSEHOLD AND FURNISHING, BY COUNTRY 2022-2032(%)
- FIGURE 24. COMPARATIVE SHARE ANALYSIS OF ECO FIBERS MARKET FOR OTHERS, BY COUNTRY 2022-2032(%)
- FIGURE 25. ECO FIBERS MARKET BY REGION, 2022
- FIGURE 26. U.S. ECO FIBERS MARKET, 2022-2032 ($MILLION)
- FIGURE 27. CANADA ECO FIBERS MARKET, 2022-2032 ($MILLION)
- FIGURE 28. MEXICO ECO FIBERS MARKET, 2022-2032 ($MILLION)
- FIGURE 29. GERMANY ECO FIBERS MARKET, 2022-2032 ($MILLION)
- FIGURE 30. FRANCE ECO FIBERS MARKET, 2022-2032 ($MILLION)
- FIGURE 31. ITALY ECO FIBERS MARKET, 2022-2032 ($MILLION)
- FIGURE 32. UK ECO FIBERS MARKET, 2022-2032 ($MILLION)
- FIGURE 33. SPAIN ECO FIBERS MARKET, 2022-2032 ($MILLION)
- FIGURE 34. REST OF EUROPE ECO FIBERS MARKET, 2022-2032 ($MILLION)
- FIGURE 35. CHINA ECO FIBERS MARKET, 2022-2032 ($MILLION)
- FIGURE 36. INDIA ECO FIBERS MARKET, 2022-2032 ($MILLION)
- FIGURE 37. JAPAN ECO FIBERS MARKET, 2022-2032 ($MILLION)
- FIGURE 38. SOUTH KOREA ECO FIBERS MARKET, 2022-2032 ($MILLION)
- FIGURE 39. AUSTRALIA ECO FIBERS MARKET, 2022-2032 ($MILLION)
- FIGURE 40. REST OF ASIA-PACIFIC ECO FIBERS MARKET, 2022-2032 ($MILLION)
- FIGURE 41. BRAZIL ECO FIBERS MARKET, 2022-2032 ($MILLION)
- FIGURE 42. SAUDI ARABIA ECO FIBERS MARKET, 2022-2032 ($MILLION)
- FIGURE 43. SOUTH AFRICA ECO FIBERS MARKET, 2022-2032 ($MILLION)
- FIGURE 44. REST OF LAMEA ECO FIBERS MARKET, 2022-2032 ($MILLION)
- FIGURE 45. TOP WINNING STRATEGIES, BY YEAR
- FIGURE 46. TOP WINNING STRATEGIES, BY DEVELOPMENT
- FIGURE 47. TOP WINNING STRATEGIES, BY COMPANY
- FIGURE 48. PRODUCT MAPPING OF TOP 10 PLAYERS
- FIGURE 49. COMPETITIVE DASHBOARD
- FIGURE 50. COMPETITIVE HEATMAP: ECO FIBERS MARKET
- FIGURE 51. TOP PLAYER POSITIONING, 2022
- FIGURE 52. TEIJIN LIMITED: NET SALES, 2020-2022 ($MILLION)
- FIGURE 53. TEIJIN LIMITED: REVENUE SHARE BY SEGMENT, 2022 (%)
- FIGURE 54. TEIJIN LIMITED: REVENUE SHARE BY REGION, 2022 (%)
- FIGURE 55. LENZING AG: NET REVENUE, 2020-2022 ($MILLION)
- FIGURE 56. LENZING AG: REVENUE SHARE BY SEGMENT, 2022 (%)
- FIGURE 57. LENZING AG: REVENUE SHARE BY REGION, 2022 (%)

