
PUBLISHER: Allied Market Research | PRODUCT CODE: 1365804

PUBLISHER: Allied Market Research | PRODUCT CODE: 1365804
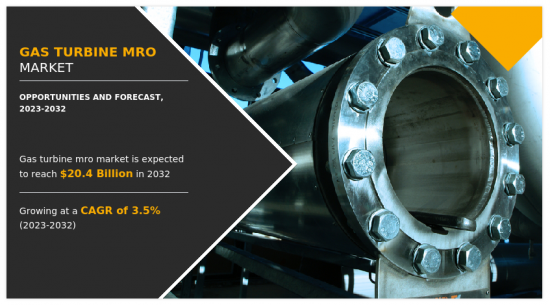
Gas Turbine MRO Market By Technology, By Type, By Provider Type, By End-use : Global Opportunity Analysis and Industry Forecast, 2023-2032
According to a new report published by Allied Market Research, titled, "Gas Turbine MRO Market," The gas turbine mro market was valued at $14.5 billion in 2022, and is estimated to reach $20.4 billion by 2032, growing at a CAGR of 3.5% from 2023 to 2032.
Technological advancements are expected to provide ample opportunities for market growth in the coming years. Technological advancements have significantly transformed gas turbine MRO (maintenance, repair, and overhaul) practices, making them more efficient, precise, and data driven. For instance, robotics and automation are increasingly integrated into gas turbine MRO processes for tasks such as inspections, cleaning, and repetitive maintenance activities. Robotic systems enhance safety, increase precision, and reduce the risk of human error. Besides, high-temperature-resistant coatings are developed to protect critical components of gas turbines from wear, corrosion, and thermal stress. These coatings improve the lifespan of parts, reducing the need for frequent replacements and enhancing turbine performance.
The gas turbine MRO market is segmented on the basis of technology, type, provider type, end-use, and region. By technology, the market is categorized into heavy duty, light industrial, aeroderivative. By type, the market is categorized into maintenance, repair, and overhaul. By provider type, the market is divided into OEM, independent service provider, and in-house. By end-use, the market is divided into power generation, oil and gas, and others. By region, the market is analyzed across North America, Europe, Asia-Pacific, and LAMEA.
The report covers strategies adopted by key players in the market to sustain the competitive environment and increase their market share. The key players operating in the gas turbine MRO market include Baker Hughes Company; Doosan Enerbility; Mitsubishi Heavy Industries, Ltd.; Kawasaki Heavy Industries, Ltd.; Siemens Energy AG; General Electric Company; Solar Turbines Incorporated; Ansaldo Energia SPA; Sulzer Ltd.; and Metalock Engineering. In addition, the market drivers, restraints, and opportunities are explained in the report.
Key Benefits For Stakeholders
- This report provides a quantitative analysis of the market segments, current trends, estimations, and dynamics of the gas turbine mro market analysis from 2022 to 2032 to identify the prevailing gas turbine mro market opportunities.
- The market research is offered along with information related to key drivers, restraints, and opportunities.
- Porter's five forces analysis highlights the potency of buyers and suppliers to enable stakeholders make profit-oriented business decisions and strengthen their supplier-buyer network.
- In-depth analysis of the gas turbine mro market segmentation assists to determine the prevailing market opportunities.
- Major countries in each region are mapped according to their revenue contribution to the global market.
- Market player positioning facilitates benchmarking and provides a clear understanding of the present position of the market players.
- The report includes the analysis of the regional as well as global gas turbine mro market trends, key players, market segments, application areas, and market growth strategies.
Additional benefits you will get with this purchase are:
- Quarterly Update and* (only available with a corporate license, on listed price)
- 5 additional Company Profile of client Choice pre- or Post-purchase, as a free update.
- Free Upcoming Version on the Purchase of Five and Enterprise User License.
- 16 analyst hours of support* (post-purchase, if you find additional data requirements upon review of the report, you may receive support amounting to 16 analyst hours to solve questions, and post-sale queries)
- 15% Free Customization* (in case the scope or segment of the report does not match your requirements, 20% is equivalent to 3 working days of free work, applicable once)
- Free data Pack on the Five and Enterprise User License. (Excel version of the report)
- Free Updated report if the report is 6-12 months old or older.
- 24-hour priority response*
- Free Industry updates and white papers.
Possible Customization with this report (with additional cost and timeline talk to the sales executive to know more)
- Additional company profiles with specific to client's interest
- Additional country or region analysis- market size and forecast
- Expanded list for Company Profiles
- SWOT Analysis
Key Market Segments
By Technology
- Heavy Duty
- Light Industrial
- Aero-derivative
By Type
- Maintenance
- Repair
- Overhaul
By Provider Type
- OEM
- Independent Service Provider
- In-house
By End-use
- Power Generation
- Oil and Gas
- Others
By Region
- North America
- U.S.
- Canada
- Mexico
- Europe
- Germany
- France
- Italy
- UK
- Spain
- Rest of Europe
- Asia-Pacific
- China
- India
- Japan
- South Korea
- Australia
- Rest of Asia-Pacific
- LAMEA
- Brazil
- Saudi Arabia
- South Africa
- Rest of LAMEA
Key Market Players:
- General Electric Company
- Siemens Energy AG
- Doosan Enerbility
- Ansaldo Energia SPA
- Baker Hughes Company
- Mitsubishi Heavy Industries, LTD
- Solar Turbines Incorporated
- Kawasaki Heavy Industries, Ltd.
- Metalock Engineering
- Sulzer Ltd.
TABLE OF CONTENTS
CHAPTER 1: INTRODUCTION
- 1.1. Report description
- 1.2. Key market segments
- 1.3. Key benefits to the stakeholders
- 1.4. Research Methodology
- 1.4.1. Primary research
- 1.4.2. Secondary research
- 1.4.3. Analyst tools and models
CHAPTER 2: EXECUTIVE SUMMARY
- 2.1. CXO Perspective
CHAPTER 3: MARKET OVERVIEW
- 3.1. Market definition and scope
- 3.2. Key findings
- 3.2.1. Top impacting factors
- 3.2.2. Top investment pockets
- 3.3. Porter's five forces analysis
- 3.3.1. Low bargaining power of suppliers
- 3.3.2. Low threat of new entrants
- 3.3.3. Low threat of substitutes
- 3.3.4. Low intensity of rivalry
- 3.3.5. Low bargaining power of buyers
- 3.4. Market dynamics
- 3.4.1. Drivers
- 3.4.1.1. Surge in replacement of nuclear and coal-driven turbines with gas turbines
- 3.4.1.2. Growth in demand for power generation
- 3.4.1. Drivers
- 3.4.2. Restraints
- 3.4.2.1. High cost associated with gas turbine MRO
- 3.4.3. Opportunities
- 3.4.3.1. Technological advancement
- 3.5. COVID-19 Impact Analysis on the market
- 3.6. Key Regulation Analysis
- 3.7. Patent Landscape
- 3.8. Regulatory Guidelines
CHAPTER 4: GAS TURBINE MRO MARKET, BY TECHNOLOGY
- 4.1. Overview
- 4.1.1. Market size and forecast
- 4.2. Heavy Duty
- 4.2.1. Key market trends, growth factors and opportunities
- 4.2.2. Market size and forecast, by region
- 4.2.3. Market share analysis by country
- 4.3. Light Industrial
- 4.3.1. Key market trends, growth factors and opportunities
- 4.3.2. Market size and forecast, by region
- 4.3.3. Market share analysis by country
- 4.4. Aero-derivative
- 4.4.1. Key market trends, growth factors and opportunities
- 4.4.2. Market size and forecast, by region
- 4.4.3. Market share analysis by country
CHAPTER 5: GAS TURBINE MRO MARKET, BY TYPE
- 5.1. Overview
- 5.1.1. Market size and forecast
- 5.2. Maintenance
- 5.2.1. Key market trends, growth factors and opportunities
- 5.2.2. Market size and forecast, by region
- 5.2.3. Market share analysis by country
- 5.3. Repair
- 5.3.1. Key market trends, growth factors and opportunities
- 5.3.2. Market size and forecast, by region
- 5.3.3. Market share analysis by country
- 5.4. Overhaul
- 5.4.1. Key market trends, growth factors and opportunities
- 5.4.2. Market size and forecast, by region
- 5.4.3. Market share analysis by country
CHAPTER 6: GAS TURBINE MRO MARKET, BY PROVIDER TYPE
- 6.1. Overview
- 6.1.1. Market size and forecast
- 6.2. OEM
- 6.2.1. Key market trends, growth factors and opportunities
- 6.2.2. Market size and forecast, by region
- 6.2.3. Market share analysis by country
- 6.3. Independent Service Provider
- 6.3.1. Key market trends, growth factors and opportunities
- 6.3.2. Market size and forecast, by region
- 6.3.3. Market share analysis by country
- 6.4. In-house
- 6.4.1. Key market trends, growth factors and opportunities
- 6.4.2. Market size and forecast, by region
- 6.4.3. Market share analysis by country
CHAPTER 7: GAS TURBINE MRO MARKET, BY END-USE
- 7.1. Overview
- 7.1.1. Market size and forecast
- 7.2. Power Generation
- 7.2.1. Key market trends, growth factors and opportunities
- 7.2.2. Market size and forecast, by region
- 7.2.3. Market share analysis by country
- 7.3. Oil and Gas
- 7.3.1. Key market trends, growth factors and opportunities
- 7.3.2. Market size and forecast, by region
- 7.3.3. Market share analysis by country
- 7.4. Others
- 7.4.1. Key market trends, growth factors and opportunities
- 7.4.2. Market size and forecast, by region
- 7.4.3. Market share analysis by country
CHAPTER 8: GAS TURBINE MRO MARKET, BY REGION
- 8.1. Overview
- 8.1.1. Market size and forecast By Region
- 8.2. North America
- 8.2.1. Key trends and opportunities
- 8.2.2. Market size and forecast, by Technology
- 8.2.3. Market size and forecast, by Type
- 8.2.4. Market size and forecast, by Provider Type
- 8.2.5. Market size and forecast, by End-use
- 8.2.6. Market size and forecast, by country
- 8.2.6.1. U.S.
- 8.2.6.1.1. Key market trends, growth factors and opportunities
- 8.2.6.1.2. Market size and forecast, by Technology
- 8.2.6.1.3. Market size and forecast, by Type
- 8.2.6.1.4. Market size and forecast, by Provider Type
- 8.2.6.1.5. Market size and forecast, by End-use
- 8.2.6.2. Canada
- 8.2.6.2.1. Key market trends, growth factors and opportunities
- 8.2.6.2.2. Market size and forecast, by Technology
- 8.2.6.2.3. Market size and forecast, by Type
- 8.2.6.2.4. Market size and forecast, by Provider Type
- 8.2.6.2.5. Market size and forecast, by End-use
- 8.2.6.3. Mexico
- 8.2.6.3.1. Key market trends, growth factors and opportunities
- 8.2.6.3.2. Market size and forecast, by Technology
- 8.2.6.3.3. Market size and forecast, by Type
- 8.2.6.3.4. Market size and forecast, by Provider Type
- 8.2.6.3.5. Market size and forecast, by End-use
- 8.3. Europe
- 8.3.1. Key trends and opportunities
- 8.3.2. Market size and forecast, by Technology
- 8.3.3. Market size and forecast, by Type
- 8.3.4. Market size and forecast, by Provider Type
- 8.3.5. Market size and forecast, by End-use
- 8.3.6. Market size and forecast, by country
- 8.3.6.1. Germany
- 8.3.6.1.1. Key market trends, growth factors and opportunities
- 8.3.6.1.2. Market size and forecast, by Technology
- 8.3.6.1.3. Market size and forecast, by Type
- 8.3.6.1.4. Market size and forecast, by Provider Type
- 8.3.6.1.5. Market size and forecast, by End-use
- 8.3.6.2. France
- 8.3.6.2.1. Key market trends, growth factors and opportunities
- 8.3.6.2.2. Market size and forecast, by Technology
- 8.3.6.2.3. Market size and forecast, by Type
- 8.3.6.2.4. Market size and forecast, by Provider Type
- 8.3.6.2.5. Market size and forecast, by End-use
- 8.3.6.3. Italy
- 8.3.6.3.1. Key market trends, growth factors and opportunities
- 8.3.6.3.2. Market size and forecast, by Technology
- 8.3.6.3.3. Market size and forecast, by Type
- 8.3.6.3.4. Market size and forecast, by Provider Type
- 8.3.6.3.5. Market size and forecast, by End-use
- 8.3.6.4. UK
- 8.3.6.4.1. Key market trends, growth factors and opportunities
- 8.3.6.4.2. Market size and forecast, by Technology
- 8.3.6.4.3. Market size and forecast, by Type
- 8.3.6.4.4. Market size and forecast, by Provider Type
- 8.3.6.4.5. Market size and forecast, by End-use
- 8.3.6.5. Spain
- 8.3.6.5.1. Key market trends, growth factors and opportunities
- 8.3.6.5.2. Market size and forecast, by Technology
- 8.3.6.5.3. Market size and forecast, by Type
- 8.3.6.5.4. Market size and forecast, by Provider Type
- 8.3.6.5.5. Market size and forecast, by End-use
- 8.3.6.6. Rest of Europe
- 8.3.6.6.1. Key market trends, growth factors and opportunities
- 8.3.6.6.2. Market size and forecast, by Technology
- 8.3.6.6.3. Market size and forecast, by Type
- 8.3.6.6.4. Market size and forecast, by Provider Type
- 8.3.6.6.5. Market size and forecast, by End-use
- 8.4. Asia-Pacific
- 8.4.1. Key trends and opportunities
- 8.4.2. Market size and forecast, by Technology
- 8.4.3. Market size and forecast, by Type
- 8.4.4. Market size and forecast, by Provider Type
- 8.4.5. Market size and forecast, by End-use
- 8.4.6. Market size and forecast, by country
- 8.4.6.1. China
- 8.4.6.1.1. Key market trends, growth factors and opportunities
- 8.4.6.1.2. Market size and forecast, by Technology
- 8.4.6.1.3. Market size and forecast, by Type
- 8.4.6.1.4. Market size and forecast, by Provider Type
- 8.4.6.1.5. Market size and forecast, by End-use
- 8.4.6.2. India
- 8.4.6.2.1. Key market trends, growth factors and opportunities
- 8.4.6.2.2. Market size and forecast, by Technology
- 8.4.6.2.3. Market size and forecast, by Type
- 8.4.6.2.4. Market size and forecast, by Provider Type
- 8.4.6.2.5. Market size and forecast, by End-use
- 8.4.6.3. Japan
- 8.4.6.3.1. Key market trends, growth factors and opportunities
- 8.4.6.3.2. Market size and forecast, by Technology
- 8.4.6.3.3. Market size and forecast, by Type
- 8.4.6.3.4. Market size and forecast, by Provider Type
- 8.4.6.3.5. Market size and forecast, by End-use
- 8.4.6.4. South Korea
- 8.4.6.4.1. Key market trends, growth factors and opportunities
- 8.4.6.4.2. Market size and forecast, by Technology
- 8.4.6.4.3. Market size and forecast, by Type
- 8.4.6.4.4. Market size and forecast, by Provider Type
- 8.4.6.4.5. Market size and forecast, by End-use
- 8.4.6.5. Australia
- 8.4.6.5.1. Key market trends, growth factors and opportunities
- 8.4.6.5.2. Market size and forecast, by Technology
- 8.4.6.5.3. Market size and forecast, by Type
- 8.4.6.5.4. Market size and forecast, by Provider Type
- 8.4.6.5.5. Market size and forecast, by End-use
- 8.4.6.6. Rest of Asia-Pacific
- 8.4.6.6.1. Key market trends, growth factors and opportunities
- 8.4.6.6.2. Market size and forecast, by Technology
- 8.4.6.6.3. Market size and forecast, by Type
- 8.4.6.6.4. Market size and forecast, by Provider Type
- 8.4.6.6.5. Market size and forecast, by End-use
- 8.5. LAMEA
- 8.5.1. Key trends and opportunities
- 8.5.2. Market size and forecast, by Technology
- 8.5.3. Market size and forecast, by Type
- 8.5.4. Market size and forecast, by Provider Type
- 8.5.5. Market size and forecast, by End-use
- 8.5.6. Market size and forecast, by country
- 8.5.6.1. Brazil
- 8.5.6.1.1. Key market trends, growth factors and opportunities
- 8.5.6.1.2. Market size and forecast, by Technology
- 8.5.6.1.3. Market size and forecast, by Type
- 8.5.6.1.4. Market size and forecast, by Provider Type
- 8.5.6.1.5. Market size and forecast, by End-use
- 8.5.6.2. Saudi Arabia
- 8.5.6.2.1. Key market trends, growth factors and opportunities
- 8.5.6.2.2. Market size and forecast, by Technology
- 8.5.6.2.3. Market size and forecast, by Type
- 8.5.6.2.4. Market size and forecast, by Provider Type
- 8.5.6.2.5. Market size and forecast, by End-use
- 8.5.6.3. South Africa
- 8.5.6.3.1. Key market trends, growth factors and opportunities
- 8.5.6.3.2. Market size and forecast, by Technology
- 8.5.6.3.3. Market size and forecast, by Type
- 8.5.6.3.4. Market size and forecast, by Provider Type
- 8.5.6.3.5. Market size and forecast, by End-use
- 8.5.6.4. Rest of LAMEA
- 8.5.6.4.1. Key market trends, growth factors and opportunities
- 8.5.6.4.2. Market size and forecast, by Technology
- 8.5.6.4.3. Market size and forecast, by Type
- 8.5.6.4.4. Market size and forecast, by Provider Type
- 8.5.6.4.5. Market size and forecast, by End-use
CHAPTER 9: COMPETITIVE LANDSCAPE
- 9.1. Introduction
- 9.2. Top winning strategies
- 9.3. Product Mapping of Top 10 Player
- 9.4. Competitive Dashboard
- 9.5. Competitive Heatmap
- 9.6. Top player positioning, 2022
CHAPTER 10: COMPANY PROFILES
- 10.1. Mitsubishi Heavy Industries, LTD
- 10.1.1. Company overview
- 10.1.2. Key Executives
- 10.1.3. Company snapshot
- 10.1.4. Operating business segments
- 10.1.5. Product portfolio
- 10.1.6. Business performance
- 10.2. Solar Turbines Incorporated
- 10.2.1. Company overview
- 10.2.2. Key Executives
- 10.2.3. Company snapshot
- 10.2.4. Operating business segments
- 10.2.5. Product portfolio
- 10.3. Kawasaki Heavy Industries, Ltd.
- 10.3.1. Company overview
- 10.3.2. Key Executives
- 10.3.3. Company snapshot
- 10.3.4. Operating business segments
- 10.3.5. Product portfolio
- 10.3.6. Business performance
- 10.4. Siemens Energy AG
- 10.4.1. Company overview
- 10.4.2. Key Executives
- 10.4.3. Company snapshot
- 10.4.4. Operating business segments
- 10.4.5. Product portfolio
- 10.4.6. Business performance
- 10.5. Doosan Enerbility
- 10.5.1. Company overview
- 10.5.2. Key Executives
- 10.5.3. Company snapshot
- 10.5.4. Operating business segments
- 10.5.5. Product portfolio
- 10.6. General Electric Company
- 10.6.1. Company overview
- 10.6.2. Key Executives
- 10.6.3. Company snapshot
- 10.6.4. Operating business segments
- 10.6.5. Product portfolio
- 10.6.6. Business performance
- 10.6.7. Key strategic moves and developments
- 10.7. Ansaldo Energia SPA
- 10.7.1. Company overview
- 10.7.2. Key Executives
- 10.7.3. Company snapshot
- 10.7.4. Operating business segments
- 10.7.5. Product portfolio
- 10.7.6. Business performance
- 10.8. Baker Hughes Company
- 10.8.1. Company overview
- 10.8.2. Key Executives
- 10.8.3. Company snapshot
- 10.8.4. Operating business segments
- 10.8.5. Product portfolio
- 10.8.6. Business performance
- 10.9. Sulzer Ltd.
- 10.9.1. Company overview
- 10.9.2. Key Executives
- 10.9.3. Company snapshot
- 10.9.4. Operating business segments
- 10.9.5. Product portfolio
- 10.9.6. Business performance
- 10.9.7. Key strategic moves and developments
- 10.10. Metalock Engineering
- 10.10.1. Company overview
- 10.10.2. Key Executives
- 10.10.3. Company snapshot
- 10.10.4. Operating business segments
- 10.10.5. Product portfolio
LIST OF TABLES
- TABLE 01. GLOBAL GAS TURBINE MRO MARKET, BY TECHNOLOGY, 2022-2032 ($MILLION)
- TABLE 02. GAS TURBINE MRO MARKET FOR HEAVY DUTY, BY REGION, 2022-2032 ($MILLION)
- TABLE 03. GAS TURBINE MRO MARKET FOR LIGHT INDUSTRIAL, BY REGION, 2022-2032 ($MILLION)
- TABLE 04. GAS TURBINE MRO MARKET FOR AERO-DERIVATIVE, BY REGION, 2022-2032 ($MILLION)
- TABLE 05. GLOBAL GAS TURBINE MRO MARKET, BY TYPE, 2022-2032 ($MILLION)
- TABLE 06. GAS TURBINE MRO MARKET FOR MAINTENANCE, BY REGION, 2022-2032 ($MILLION)
- TABLE 07. GAS TURBINE MRO MARKET FOR REPAIR, BY REGION, 2022-2032 ($MILLION)
- TABLE 08. GAS TURBINE MRO MARKET FOR OVERHAUL, BY REGION, 2022-2032 ($MILLION)
- TABLE 09. GLOBAL GAS TURBINE MRO MARKET, BY PROVIDER TYPE, 2022-2032 ($MILLION)
- TABLE 10. GAS TURBINE MRO MARKET FOR OEM, BY REGION, 2022-2032 ($MILLION)
- TABLE 11. GAS TURBINE MRO MARKET FOR INDEPENDENT SERVICE PROVIDER, BY REGION, 2022-2032 ($MILLION)
- TABLE 12. GAS TURBINE MRO MARKET FOR IN-HOUSE, BY REGION, 2022-2032 ($MILLION)
- TABLE 13. GLOBAL GAS TURBINE MRO MARKET, BY END-USE, 2022-2032 ($MILLION)
- TABLE 14. GAS TURBINE MRO MARKET FOR POWER GENERATION, BY REGION, 2022-2032 ($MILLION)
- TABLE 15. GAS TURBINE MRO MARKET FOR OIL AND GAS, BY REGION, 2022-2032 ($MILLION)
- TABLE 16. GAS TURBINE MRO MARKET FOR OTHERS, BY REGION, 2022-2032 ($MILLION)
- TABLE 17. GAS TURBINE MRO MARKET, BY REGION, 2022-2032 ($MILLION)
- TABLE 18. NORTH AMERICA GAS TURBINE MRO MARKET, BY TECHNOLOGY, 2022-2032 ($MILLION)
- TABLE 19. NORTH AMERICA GAS TURBINE MRO MARKET, BY TYPE, 2022-2032 ($MILLION)
- TABLE 20. NORTH AMERICA GAS TURBINE MRO MARKET, BY PROVIDER TYPE, 2022-2032 ($MILLION)
- TABLE 21. NORTH AMERICA GAS TURBINE MRO MARKET, BY END-USE, 2022-2032 ($MILLION)
- TABLE 22. NORTH AMERICA GAS TURBINE MRO MARKET, BY COUNTRY, 2022-2032 ($MILLION)
- TABLE 23. U.S. GAS TURBINE MRO MARKET, BY TECHNOLOGY, 2022-2032 ($MILLION)
- TABLE 24. U.S. GAS TURBINE MRO MARKET, BY TYPE, 2022-2032 ($MILLION)
- TABLE 25. U.S. GAS TURBINE MRO MARKET, BY PROVIDER TYPE, 2022-2032 ($MILLION)
- TABLE 26. U.S. GAS TURBINE MRO MARKET, BY END-USE, 2022-2032 ($MILLION)
- TABLE 27. CANADA GAS TURBINE MRO MARKET, BY TECHNOLOGY, 2022-2032 ($MILLION)
- TABLE 28. CANADA GAS TURBINE MRO MARKET, BY TYPE, 2022-2032 ($MILLION)
- TABLE 29. CANADA GAS TURBINE MRO MARKET, BY PROVIDER TYPE, 2022-2032 ($MILLION)
- TABLE 30. CANADA GAS TURBINE MRO MARKET, BY END-USE, 2022-2032 ($MILLION)
- TABLE 31. MEXICO GAS TURBINE MRO MARKET, BY TECHNOLOGY, 2022-2032 ($MILLION)
- TABLE 32. MEXICO GAS TURBINE MRO MARKET, BY TYPE, 2022-2032 ($MILLION)
- TABLE 33. MEXICO GAS TURBINE MRO MARKET, BY PROVIDER TYPE, 2022-2032 ($MILLION)
- TABLE 34. MEXICO GAS TURBINE MRO MARKET, BY END-USE, 2022-2032 ($MILLION)
- TABLE 35. EUROPE GAS TURBINE MRO MARKET, BY TECHNOLOGY, 2022-2032 ($MILLION)
- TABLE 36. EUROPE GAS TURBINE MRO MARKET, BY TYPE, 2022-2032 ($MILLION)
- TABLE 37. EUROPE GAS TURBINE MRO MARKET, BY PROVIDER TYPE, 2022-2032 ($MILLION)
- TABLE 38. EUROPE GAS TURBINE MRO MARKET, BY END-USE, 2022-2032 ($MILLION)
- TABLE 39. EUROPE GAS TURBINE MRO MARKET, BY COUNTRY, 2022-2032 ($MILLION)
- TABLE 40. GERMANY GAS TURBINE MRO MARKET, BY TECHNOLOGY, 2022-2032 ($MILLION)
- TABLE 41. GERMANY GAS TURBINE MRO MARKET, BY TYPE, 2022-2032 ($MILLION)
- TABLE 42. GERMANY GAS TURBINE MRO MARKET, BY PROVIDER TYPE, 2022-2032 ($MILLION)
- TABLE 43. GERMANY GAS TURBINE MRO MARKET, BY END-USE, 2022-2032 ($MILLION)
- TABLE 44. FRANCE GAS TURBINE MRO MARKET, BY TECHNOLOGY, 2022-2032 ($MILLION)
- TABLE 45. FRANCE GAS TURBINE MRO MARKET, BY TYPE, 2022-2032 ($MILLION)
- TABLE 46. FRANCE GAS TURBINE MRO MARKET, BY PROVIDER TYPE, 2022-2032 ($MILLION)
- TABLE 47. FRANCE GAS TURBINE MRO MARKET, BY END-USE, 2022-2032 ($MILLION)
- TABLE 48. ITALY GAS TURBINE MRO MARKET, BY TECHNOLOGY, 2022-2032 ($MILLION)
- TABLE 49. ITALY GAS TURBINE MRO MARKET, BY TYPE, 2022-2032 ($MILLION)
- TABLE 50. ITALY GAS TURBINE MRO MARKET, BY PROVIDER TYPE, 2022-2032 ($MILLION)
- TABLE 51. ITALY GAS TURBINE MRO MARKET, BY END-USE, 2022-2032 ($MILLION)
- TABLE 52. UK GAS TURBINE MRO MARKET, BY TECHNOLOGY, 2022-2032 ($MILLION)
- TABLE 53. UK GAS TURBINE MRO MARKET, BY TYPE, 2022-2032 ($MILLION)
- TABLE 54. UK GAS TURBINE MRO MARKET, BY PROVIDER TYPE, 2022-2032 ($MILLION)
- TABLE 55. UK GAS TURBINE MRO MARKET, BY END-USE, 2022-2032 ($MILLION)
- TABLE 56. SPAIN GAS TURBINE MRO MARKET, BY TECHNOLOGY, 2022-2032 ($MILLION)
- TABLE 57. SPAIN GAS TURBINE MRO MARKET, BY TYPE, 2022-2032 ($MILLION)
- TABLE 58. SPAIN GAS TURBINE MRO MARKET, BY PROVIDER TYPE, 2022-2032 ($MILLION)
- TABLE 59. SPAIN GAS TURBINE MRO MARKET, BY END-USE, 2022-2032 ($MILLION)
- TABLE 60. REST OF EUROPE GAS TURBINE MRO MARKET, BY TECHNOLOGY, 2022-2032 ($MILLION)
- TABLE 61. REST OF EUROPE GAS TURBINE MRO MARKET, BY TYPE, 2022-2032 ($MILLION)
- TABLE 62. REST OF EUROPE GAS TURBINE MRO MARKET, BY PROVIDER TYPE, 2022-2032 ($MILLION)
- TABLE 63. REST OF EUROPE GAS TURBINE MRO MARKET, BY END-USE, 2022-2032 ($MILLION)
- TABLE 64. ASIA-PACIFIC GAS TURBINE MRO MARKET, BY TECHNOLOGY, 2022-2032 ($MILLION)
- TABLE 65. ASIA-PACIFIC GAS TURBINE MRO MARKET, BY TYPE, 2022-2032 ($MILLION)
- TABLE 66. ASIA-PACIFIC GAS TURBINE MRO MARKET, BY PROVIDER TYPE, 2022-2032 ($MILLION)
- TABLE 67. ASIA-PACIFIC GAS TURBINE MRO MARKET, BY END-USE, 2022-2032 ($MILLION)
- TABLE 68. ASIA-PACIFIC GAS TURBINE MRO MARKET, BY COUNTRY, 2022-2032 ($MILLION)
- TABLE 69. CHINA GAS TURBINE MRO MARKET, BY TECHNOLOGY, 2022-2032 ($MILLION)
- TABLE 70. CHINA GAS TURBINE MRO MARKET, BY TYPE, 2022-2032 ($MILLION)
- TABLE 71. CHINA GAS TURBINE MRO MARKET, BY PROVIDER TYPE, 2022-2032 ($MILLION)
- TABLE 72. CHINA GAS TURBINE MRO MARKET, BY END-USE, 2022-2032 ($MILLION)
- TABLE 73. INDIA GAS TURBINE MRO MARKET, BY TECHNOLOGY, 2022-2032 ($MILLION)
- TABLE 74. INDIA GAS TURBINE MRO MARKET, BY TYPE, 2022-2032 ($MILLION)
- TABLE 75. INDIA GAS TURBINE MRO MARKET, BY PROVIDER TYPE, 2022-2032 ($MILLION)
- TABLE 76. INDIA GAS TURBINE MRO MARKET, BY END-USE, 2022-2032 ($MILLION)
- TABLE 77. JAPAN GAS TURBINE MRO MARKET, BY TECHNOLOGY, 2022-2032 ($MILLION)
- TABLE 78. JAPAN GAS TURBINE MRO MARKET, BY TYPE, 2022-2032 ($MILLION)
- TABLE 79. JAPAN GAS TURBINE MRO MARKET, BY PROVIDER TYPE, 2022-2032 ($MILLION)
- TABLE 80. JAPAN GAS TURBINE MRO MARKET, BY END-USE, 2022-2032 ($MILLION)
- TABLE 81. SOUTH KOREA GAS TURBINE MRO MARKET, BY TECHNOLOGY, 2022-2032 ($MILLION)
- TABLE 82. SOUTH KOREA GAS TURBINE MRO MARKET, BY TYPE, 2022-2032 ($MILLION)
- TABLE 83. SOUTH KOREA GAS TURBINE MRO MARKET, BY PROVIDER TYPE, 2022-2032 ($MILLION)
- TABLE 84. SOUTH KOREA GAS TURBINE MRO MARKET, BY END-USE, 2022-2032 ($MILLION)
- TABLE 85. AUSTRALIA GAS TURBINE MRO MARKET, BY TECHNOLOGY, 2022-2032 ($MILLION)
- TABLE 86. AUSTRALIA GAS TURBINE MRO MARKET, BY TYPE, 2022-2032 ($MILLION)
- TABLE 87. AUSTRALIA GAS TURBINE MRO MARKET, BY PROVIDER TYPE, 2022-2032 ($MILLION)
- TABLE 88. AUSTRALIA GAS TURBINE MRO MARKET, BY END-USE, 2022-2032 ($MILLION)
- TABLE 89. REST OF ASIA-PACIFIC GAS TURBINE MRO MARKET, BY TECHNOLOGY, 2022-2032 ($MILLION)
- TABLE 90. REST OF ASIA-PACIFIC GAS TURBINE MRO MARKET, BY TYPE, 2022-2032 ($MILLION)
- TABLE 91. REST OF ASIA-PACIFIC GAS TURBINE MRO MARKET, BY PROVIDER TYPE, 2022-2032 ($MILLION)
- TABLE 92. REST OF ASIA-PACIFIC GAS TURBINE MRO MARKET, BY END-USE, 2022-2032 ($MILLION)
- TABLE 93. LAMEA GAS TURBINE MRO MARKET, BY TECHNOLOGY, 2022-2032 ($MILLION)
- TABLE 94. LAMEA GAS TURBINE MRO MARKET, BY TYPE, 2022-2032 ($MILLION)
- TABLE 95. LAMEA GAS TURBINE MRO MARKET, BY PROVIDER TYPE, 2022-2032 ($MILLION)
- TABLE 96. LAMEA GAS TURBINE MRO MARKET, BY END-USE, 2022-2032 ($MILLION)
- TABLE 97. LAMEA GAS TURBINE MRO MARKET, BY COUNTRY, 2022-2032 ($MILLION)
- TABLE 98. BRAZIL GAS TURBINE MRO MARKET, BY TECHNOLOGY, 2022-2032 ($MILLION)
- TABLE 99. BRAZIL GAS TURBINE MRO MARKET, BY TYPE, 2022-2032 ($MILLION)
- TABLE 100. BRAZIL GAS TURBINE MRO MARKET, BY PROVIDER TYPE, 2022-2032 ($MILLION)
- TABLE 101. BRAZIL GAS TURBINE MRO MARKET, BY END-USE, 2022-2032 ($MILLION)
- TABLE 102. SAUDI ARABIA GAS TURBINE MRO MARKET, BY TECHNOLOGY, 2022-2032 ($MILLION)
- TABLE 103. SAUDI ARABIA GAS TURBINE MRO MARKET, BY TYPE, 2022-2032 ($MILLION)
- TABLE 104. SAUDI ARABIA GAS TURBINE MRO MARKET, BY PROVIDER TYPE, 2022-2032 ($MILLION)
- TABLE 105. SAUDI ARABIA GAS TURBINE MRO MARKET, BY END-USE, 2022-2032 ($MILLION)
- TABLE 106. SOUTH AFRICA GAS TURBINE MRO MARKET, BY TECHNOLOGY, 2022-2032 ($MILLION)
- TABLE 107. SOUTH AFRICA GAS TURBINE MRO MARKET, BY TYPE, 2022-2032 ($MILLION)
- TABLE 108. SOUTH AFRICA GAS TURBINE MRO MARKET, BY PROVIDER TYPE, 2022-2032 ($MILLION)
- TABLE 109. SOUTH AFRICA GAS TURBINE MRO MARKET, BY END-USE, 2022-2032 ($MILLION)
- TABLE 110. REST OF LAMEA GAS TURBINE MRO MARKET, BY TECHNOLOGY, 2022-2032 ($MILLION)
- TABLE 111. REST OF LAMEA GAS TURBINE MRO MARKET, BY TYPE, 2022-2032 ($MILLION)
- TABLE 112. REST OF LAMEA GAS TURBINE MRO MARKET, BY PROVIDER TYPE, 2022-2032 ($MILLION)
- TABLE 113. REST OF LAMEA GAS TURBINE MRO MARKET, BY END-USE, 2022-2032 ($MILLION)
- TABLE 114. MITSUBISHI HEAVY INDUSTRIES, LTD: KEY EXECUTIVES
- TABLE 115. MITSUBISHI HEAVY INDUSTRIES, LTD: COMPANY SNAPSHOT
- TABLE 116. MITSUBISHI HEAVY INDUSTRIES, LTD: PRODUCT SEGMENTS
- TABLE 117. MITSUBISHI HEAVY INDUSTRIES, LTD: PRODUCT PORTFOLIO
- TABLE 118. SOLAR TURBINES INCORPORATED: KEY EXECUTIVES
- TABLE 119. SOLAR TURBINES INCORPORATED: COMPANY SNAPSHOT
- TABLE 120. SOLAR TURBINES INCORPORATED: SERVICE SEGMENTS
- TABLE 121. SOLAR TURBINES INCORPORATED: PRODUCT PORTFOLIO
- TABLE 122. KAWASAKI HEAVY INDUSTRIES, LTD.: KEY EXECUTIVES
- TABLE 123. KAWASAKI HEAVY INDUSTRIES, LTD.: COMPANY SNAPSHOT
- TABLE 124. KAWASAKI HEAVY INDUSTRIES, LTD.: PRODUCT SEGMENTS
- TABLE 125. KAWASAKI HEAVY INDUSTRIES, LTD.: PRODUCT PORTFOLIO
- TABLE 126. SIEMENS ENERGY AG: KEY EXECUTIVES
- TABLE 127. SIEMENS ENERGY AG: COMPANY SNAPSHOT
- TABLE 128. SIEMENS ENERGY AG: PRODUCT SEGMENTS
- TABLE 129. SIEMENS ENERGY AG: PRODUCT PORTFOLIO
- TABLE 130. DOOSAN ENERBILITY: KEY EXECUTIVES
- TABLE 131. DOOSAN ENERBILITY: COMPANY SNAPSHOT
- TABLE 132. DOOSAN ENERBILITY: PRODUCT SEGMENTS
- TABLE 133. DOOSAN ENERBILITY: SERVICE SEGMENTS
- TABLE 134. DOOSAN ENERBILITY: PRODUCT PORTFOLIO
- TABLE 135. GENERAL ELECTRIC COMPANY: KEY EXECUTIVES
- TABLE 136. GENERAL ELECTRIC COMPANY: COMPANY SNAPSHOT
- TABLE 137. GENERAL ELECTRIC COMPANY: PRODUCT SEGMENTS
- TABLE 138. GENERAL ELECTRIC COMPANY: PRODUCT PORTFOLIO
- TABLE 139. GENERAL ELECTRIC COMPANY: KEY STRATERGIES
- TABLE 140. ANSALDO ENERGIA SPA: KEY EXECUTIVES
- TABLE 141. ANSALDO ENERGIA SPA: COMPANY SNAPSHOT
- TABLE 142. ANSALDO ENERGIA SPA: PRODUCT SEGMENTS
- TABLE 143. ANSALDO ENERGIA SPA: PRODUCT PORTFOLIO
- TABLE 144. BAKER HUGHES COMPANY: KEY EXECUTIVES
- TABLE 145. BAKER HUGHES COMPANY: COMPANY SNAPSHOT
- TABLE 146. BAKER HUGHES COMPANY: PRODUCT SEGMENTS
- TABLE 147. BAKER HUGHES COMPANY: PRODUCT PORTFOLIO
- TABLE 148. SULZER LTD.: KEY EXECUTIVES
- TABLE 149. SULZER LTD.: COMPANY SNAPSHOT
- TABLE 150. SULZER LTD.: PRODUCT SEGMENTS
- TABLE 151. SULZER LTD.: SERVICE SEGMENTS
- TABLE 152. SULZER LTD.: PRODUCT PORTFOLIO
- TABLE 153. SULZER LTD.: KEY STRATERGIES
- TABLE 154. METALOCK ENGINEERING: KEY EXECUTIVES
- TABLE 155. METALOCK ENGINEERING: COMPANY SNAPSHOT
- TABLE 156. METALOCK ENGINEERING: SERVICE SEGMENTS
- TABLE 157. METALOCK ENGINEERING: PRODUCT PORTFOLIO
LIST OF FIGURES
- FIGURE 01. GAS TURBINE MRO MARKET, 2022-2032
- FIGURE 02. SEGMENTATION OF GAS TURBINE MRO MARKET,2022-2032
- FIGURE 03. TOP INVESTMENT POCKETS IN GAS TURBINE MRO MARKET (2023-2032)
- FIGURE 04. LOW BARGAINING POWER OF SUPPLIERS
- FIGURE 05. LOW THREAT OF NEW ENTRANTS
- FIGURE 06. LOW THREAT OF SUBSTITUTES
- FIGURE 07. LOW INTENSITY OF RIVALRY
- FIGURE 08. LOW BARGAINING POWER OF BUYERS
- FIGURE 09. GLOBAL GAS TURBINE MRO MARKET:DRIVERS, RESTRAINTS AND OPPORTUNITIES
- FIGURE 10. IMPACT OF KEY REGULATION: GAS TURBINE MRO MARKET
- FIGURE 11. PATENT ANALYSIS BY COMPANY
- FIGURE 12. PATENT ANALYSIS BY COUNTRY
- FIGURE 13. REGULATORY GUIDELINES: GAS TURBINE MRO MARKET
- FIGURE 14. GAS TURBINE MRO MARKET, BY TECHNOLOGY, 2022(%)
- FIGURE 15. COMPARATIVE SHARE ANALYSIS OF GAS TURBINE MRO MARKET FOR HEAVY DUTY, BY COUNTRY 2022 AND 2032(%)
- FIGURE 16. COMPARATIVE SHARE ANALYSIS OF GAS TURBINE MRO MARKET FOR LIGHT INDUSTRIAL, BY COUNTRY 2022 AND 2032(%)
- FIGURE 17. COMPARATIVE SHARE ANALYSIS OF GAS TURBINE MRO MARKET FOR AERO-DERIVATIVE, BY COUNTRY 2022 AND 2032(%)
- FIGURE 18. GAS TURBINE MRO MARKET, BY TYPE, 2022(%)
- FIGURE 19. COMPARATIVE SHARE ANALYSIS OF GAS TURBINE MRO MARKET FOR MAINTENANCE, BY COUNTRY 2022 AND 2032(%)
- FIGURE 20. COMPARATIVE SHARE ANALYSIS OF GAS TURBINE MRO MARKET FOR REPAIR, BY COUNTRY 2022 AND 2032(%)
- FIGURE 21. COMPARATIVE SHARE ANALYSIS OF GAS TURBINE MRO MARKET FOR OVERHAUL, BY COUNTRY 2022 AND 2032(%)
- FIGURE 22. GAS TURBINE MRO MARKET, BY PROVIDER TYPE, 2022(%)
- FIGURE 23. COMPARATIVE SHARE ANALYSIS OF GAS TURBINE MRO MARKET FOR OEM, BY COUNTRY 2022 AND 2032(%)
- FIGURE 24. COMPARATIVE SHARE ANALYSIS OF GAS TURBINE MRO MARKET FOR INDEPENDENT SERVICE PROVIDER, BY COUNTRY 2022 AND 2032(%)
- FIGURE 25. COMPARATIVE SHARE ANALYSIS OF GAS TURBINE MRO MARKET FOR IN-HOUSE, BY COUNTRY 2022 AND 2032(%)
- FIGURE 26. GAS TURBINE MRO MARKET, BY END-USE, 2022(%)
- FIGURE 27. COMPARATIVE SHARE ANALYSIS OF GAS TURBINE MRO MARKET FOR POWER GENERATION, BY COUNTRY 2022 AND 2032(%)
- FIGURE 28. COMPARATIVE SHARE ANALYSIS OF GAS TURBINE MRO MARKET FOR OIL AND GAS, BY COUNTRY 2022 AND 2032(%)
- FIGURE 29. COMPARATIVE SHARE ANALYSIS OF GAS TURBINE MRO MARKET FOR OTHERS, BY COUNTRY 2022 AND 2032(%)
- FIGURE 30. GAS TURBINE MRO MARKET BY REGION, 2022(%)
- FIGURE 31. U.S. GAS TURBINE MRO MARKET, 2022-2032 ($MILLION)
- FIGURE 32. CANADA GAS TURBINE MRO MARKET, 2022-2032 ($MILLION)
- FIGURE 33. MEXICO GAS TURBINE MRO MARKET, 2022-2032 ($MILLION)
- FIGURE 34. GERMANY GAS TURBINE MRO MARKET, 2022-2032 ($MILLION)
- FIGURE 35. FRANCE GAS TURBINE MRO MARKET, 2022-2032 ($MILLION)
- FIGURE 36. ITALY GAS TURBINE MRO MARKET, 2022-2032 ($MILLION)
- FIGURE 37. UK GAS TURBINE MRO MARKET, 2022-2032 ($MILLION)
- FIGURE 38. SPAIN GAS TURBINE MRO MARKET, 2022-2032 ($MILLION)
- FIGURE 39. REST OF EUROPE GAS TURBINE MRO MARKET, 2022-2032 ($MILLION)
- FIGURE 40. CHINA GAS TURBINE MRO MARKET, 2022-2032 ($MILLION)
- FIGURE 41. INDIA GAS TURBINE MRO MARKET, 2022-2032 ($MILLION)
- FIGURE 42. JAPAN GAS TURBINE MRO MARKET, 2022-2032 ($MILLION)
- FIGURE 43. SOUTH KOREA GAS TURBINE MRO MARKET, 2022-2032 ($MILLION)
- FIGURE 44. AUSTRALIA GAS TURBINE MRO MARKET, 2022-2032 ($MILLION)
- FIGURE 45. REST OF ASIA-PACIFIC GAS TURBINE MRO MARKET, 2022-2032 ($MILLION)
- FIGURE 46. BRAZIL GAS TURBINE MRO MARKET, 2022-2032 ($MILLION)
- FIGURE 47. SAUDI ARABIA GAS TURBINE MRO MARKET, 2022-2032 ($MILLION)
- FIGURE 48. SOUTH AFRICA GAS TURBINE MRO MARKET, 2022-2032 ($MILLION)
- FIGURE 49. REST OF LAMEA GAS TURBINE MRO MARKET, 2022-2032 ($MILLION)
- FIGURE 50. TOP WINNING STRATEGIES, BY YEAR
- FIGURE 51. TOP WINNING STRATEGIES, BY DEVELOPMENT
- FIGURE 52. TOP WINNING STRATEGIES, BY COMPANY
- FIGURE 53. PRODUCT MAPPING OF TOP 10 PLAYERS
- FIGURE 54. COMPETITIVE DASHBOARD
- FIGURE 55. COMPETITIVE HEATMAP: GAS TURBINE MRO MARKET
- FIGURE 56. TOP PLAYER POSITIONING, 2022
- FIGURE 57. MITSUBISHI HEAVY INDUSTRIES, LTD: NET SALES, 2020-2022 ($MILLION)
- FIGURE 58. MITSUBISHI HEAVY INDUSTRIES, LTD: RESEARCH & DEVELOPMENT EXPENDITURE, 2020-2022 ($MILLION)
- FIGURE 59. MITSUBISHI HEAVY INDUSTRIES, LTD: REVENUE SHARE BY SEGMENT, 2022 (%)
- FIGURE 60. MITSUBISHI HEAVY INDUSTRIES, LTD: REVENUE SHARE BY REGION, 2022 (%)
- FIGURE 61. KAWASAKI HEAVY INDUSTRIES, LTD.: NET REVENUE, 2020-2022 ($MILLION)
- FIGURE 62. KAWASAKI HEAVY INDUSTRIES, LTD.: RESEARCH & DEVELOPMENT EXPENDITURE, 2020-2022 ($MILLION)
- FIGURE 63. KAWASAKI HEAVY INDUSTRIES, LTD.: REVENUE SHARE BY SEGMENT, 2022 (%)
- FIGURE 64. KAWASAKI HEAVY INDUSTRIES, LTD.: REVENUE SHARE BY REGION, 2022 (%)
- FIGURE 65. SIEMENS ENERGY AG: NET SALES, 2020-2022 ($MILLION)
- FIGURE 66. SIEMENS ENERGY AG: RESEARCH & DEVELOPMENT EXPENDITURE, 2020-2022 ($MILLION)
- FIGURE 67. SIEMENS ENERGY AG: REVENUE SHARE BY SEGMENT, 2022 (%)
- FIGURE 68. SIEMENS ENERGY AG: REVENUE SHARE BY REGION, 2022 (%)
- FIGURE 69. GENERAL ELECTRIC COMPANY: NET REVENUE, 2020-2022 ($MILLION)
- FIGURE 70. GENERAL ELECTRIC COMPANY: REVENUE SHARE BY SEGMENT, 2022 (%)
- FIGURE 71. GENERAL ELECTRIC COMPANY: REVENUE SHARE BY REGION, 2022 (%)
- FIGURE 72. ANSALDO ENERGIA SPA: NET REVENUE, 2020-2022 ($MILLION)
- FIGURE 73. ANSALDO ENERGIA SPA: REVENUE SHARE BY SEGMENT, 2021 (%)
- FIGURE 74. ANSALDO ENERGIA SPA: REVENUE SHARE BY REGION, 2021 (%)
- FIGURE 75. BAKER HUGHES COMPANY: NET REVENUE, 2020-2022 ($MILLION)
- FIGURE 76. BAKER HUGHES COMPANY: RESEARCH & DEVELOPMENT EXPENDITURE, 2020-2022 ($MILLION)
- FIGURE 77. BAKER HUGHES COMPANY: REVENUE SHARE BY SEGMENT, 2022 (%)
- FIGURE 78. SULZER LTD.: NET SALES, 2020-2022 ($MILLION)
- FIGURE 79. SULZER LTD.: RESEARCH & DEVELOPMENT EXPENDITURE, 2020-2022 ($MILLION)
- FIGURE 80. SULZER LTD.: REVENUE SHARE BY SEGMENT, 2022 (%)
- FIGURE 81. SULZER LTD.: REVENUE SHARE BY REGION, 2022 (%)

