
PUBLISHER: Allied Market Research | PRODUCT CODE: 1365838

PUBLISHER: Allied Market Research | PRODUCT CODE: 1365838
Bio-LNG Market By Source (Agriculture Residues, Industrial Waste, Household Waste, Others), By Application (Automotive, Ships, Power Generation, Others): Global Opportunity Analysis and Industry Forecast, 2023-2032
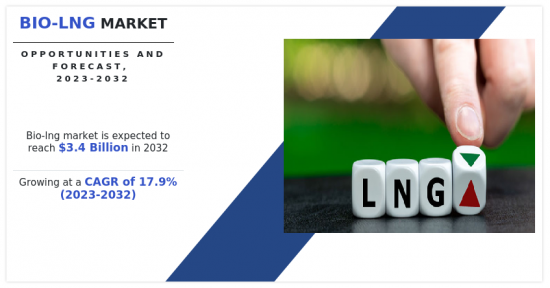
According to a new report published by Allied Market Research, titled, "Bio-LNG Market," The bio-lng market was valued at $0.7 billion in 2022, and is estimated to reach $3.4 billion by 2032, growing at a CAGR of 17.9% from 2023 to 2032.
The market for bio-LNG is expanding quickly. The growing understanding of climate change and the urgent need to cut greenhouse gas emissions is credited with this. Numerous businesses, countries, and world leaders are looking for cleaner, more sustainable energy solutions. The currently existing infrastructure has the preferable alternatives that are simple to deploy on a wide scale. In this situation, bio-LNG has a lot of potential as a clean fuel. The energy mix is expected to be significantly diversified with the help of bio-LNG. The usage of Bio-LNG is anticipated to improve both domestic and global energy security by reducing the dependency on fossil fuels. Moreover, it is also expected to limit the exposure to risks and volatile geopolitics that loom around the oil and gas supply chain that are currently major role players in the world energy mix.
Bio-LNG can be easily integrated into existing LNG infrastructure and natural gas vehicles that are in operation at present. Since bio-LNG is highly compatible with current energy systems Its adoption will not need extensive modifications or changes in existing infrastructure. Such benefits of bio-LNG act as a driving factor for the bio-LNG market growth. However, the market faces challenges that need to be resolved for continuous growth. The market faces several challenges from unstable and unreliable supply of organic waste, agricultural residues, and landfill gas. The optimization of feedstock collection and sourcing strategies will offer the potential for market growth.
Another obstacle to consider is the energy-intensive and costly nature of the bio-LNG production and purification processes. Efficient technologies and advancements in the entire value chain are essential to improve overall energy efficiency and reduce production costs. Investing in R&D is anticipated to play a vital role in overcoming these hurdles and making bio-LNG a more competitive option. Bio-LNG. This offers lucrative opportunities for market growth, as governments and companies prioritize emission reduction efforts and sustainable transportation solutions.
The bio-LNG market has experienced remarkable growth due to heightened climate change awareness and the desire to cut greenhouse gas emissions. Integrating bio-LNG into the current energy infrastructure facilitates its adoption and fuels market expansion. However, challenges related to feedstock availability, production processes, and costs restrain the overall bio-LNG market growth. Several environmental benefits and sustainable fuel opportunities of bio-LNG is expected to offer lucrative growth opportunities for the industry growth.
The bio-LNG market is studied on the basis of source, application, and region. By source, the bio-LNG market is divided into agriculture residues, industrial waste, household waste, and others. Agriculture residues are also known as agricultural or crop residues. They are the by-products or waste materials left from several agricultural activities. A variety of plant materials, including stalks, leaves, husks, shells, and stems, are among the leftovers after the main crop has been harvested. Agricultural wastes like maize stalks, rice husks, wheat straw, sugarcane bagasse, and similar materials are also used in the production of bio-LNG. These wastes are transformed into bio-LNG by anaerobic digestion, which involves microorganisms breaking down trash in the absence of oxygen. It can be utilized for many things, like as heating, moving around, and creating power.
By application, the market is categorized into automotive, ships, power generation, and others. Bio-LNG (liquefied natural gas) is a viable option for cleaner and more sustainable fuel in ships, especially in the maritime industry. It has several benefits against traditional marine fuels, such as heavy fuel oil (HFO) and marine diesel oil (MDO). Regarding environmental performance and compliance with emissions laws, bio-LNG fuel performs significantly better than conventional fuels. When comparing bio-LNG to conventional marine fuels, greenhouse gas emissions can be significantly reduced. The air is better and it has less of an adverse effect on the environment because it creates fewer greenhouse gases, sulfur oxides (SOx), nitrogen oxides (NOx), and particles. The International Maritime Organization (IMO) has created stringent regulations to decrease sulfur emissions from ships. The IMO 2020 sulfur cap, which places a restriction on the sulfur content of marine fuels, is one such law. One such law is the IMO 2020 sulfur cap, which establishes a limit on the sulfur content of marine fuels. Bio-LNG can help ship operators comply with these regulations, as it contains negligible sulfur content. Bio-LNG has a high energy density, providing a similar range to conventional LNG for ships. This allows vessels to cover longer distances without compromising on fuel efficiency.
By region, the bio-LNG market analysis is done across North America, Europe, Asia-Pacific, and LAMEA. The United States has made tremendous progress toward implementing renewable energy sources. The nation is spending a lot of money on research and development projects to improve bio-LNG because it has become one of the most promising possibilities. Apart from the government, several private companies and organizations are investing in bio-LNG production facilities that use organic waste and agricultural residues as feedstock. There are several applications for bio-LNG in the transportation industry, particularly in heavy-duty haulage and public transportation. It offers a more environmentally friendly substitute for gasoline and diesel fuel. The growing interest in using bio-LNG as a low-carbon fuel in the power generation industry has increased demand for bio-LNG throughout the nation. Through a combination of incentives, laws, regulations, subsidies, and renewable energy initiatives, the US government continuously supports bio-LNG and other renewable fuels.
- In addition, Canada is spending a lot of money on bio-LNG in an effort to reduce greenhouse gas emissions and promote renewable energy. Various provinces are planning for bio-LNG production and infrastructure, especially in regions with easy access to agricultural and forestry sectors for organic waste feedstock. The government intends to highlight the use of bio-LNG in areas with natural gas refueling infrastructure since the fuel is thought to be a promising choice for transportation. Through laws and programs meant to cut carbon emissions and boost clean energy technology, the government strongly supports the use of renewable fuels.
- The major players operating in the bio-LNG industry are Linde plc, Nordsol, Flogas Britain Ltd., EnviTec Biogas AG, Biokraft International AB, TotalEnergies, Titan LNG, DBG Group B.V., BoxLNG Pvt. Ltd., and Shell Plc. The companies adopted key strategies such as collaboration to increase their market share.
- The drivers, restraints, and opportunities are explained in the report to better understand the market dynamics. This report further highlights the key areas of investment. In addition, it includes Porter's five forces analysis to understand the competitive scenario of the industry and the role of each stakeholder. The report features strategies adopted by key market players to maintain their foothold in the market. Furthermore, it highlights the competitive landscape of key players to increase their market share and sustain the intense competition in the industry.
Key Benefits For Stakeholders
- This report provides a quantitative analysis of the market segments, current trends, estimations, and dynamics of the bio-lng market analysis from 2022 to 2032 to identify the prevailing bio-lng market opportunities.
- The market research is offered along with information related to key drivers, restraints, and opportunities.
- Porter's five forces analysis highlights the potency of buyers and suppliers to enable stakeholders make profit-oriented business decisions and strengthen their supplier-buyer network.
- In-depth analysis of the bio-lng market segmentation assists to determine the prevailing market opportunities.
- Major countries in each region are mapped according to their revenue contribution to the global market.
- Market player positioning facilitates benchmarking and provides a clear understanding of the present position of the market players.
- The report includes the analysis of the regional as well as global bio-lng market trends, key players, market segments, application areas, and market growth strategies.
Additional benefits you will get with this purchase are:
- Quarterly Update and* (only available with a corporate license, on listed price)
- 5 additional Company Profile of client Choice pre- or Post-purchase, as a free update.
- Free Upcoming Version on the Purchase of Five and Enterprise User License.
- 16 analyst hours of support* (post-purchase, if you find additional data requirements upon review of the report, you may receive support amounting to 16 analyst hours to solve questions, and post-sale queries)
- 15% Free Customization* (in case the scope or segment of the report does not match your requirements, 20% is equivalent to 3 working days of free work, applicable once)
- Free data Pack on the Five and Enterprise User License. (Excel version of the report)
- Free Updated report if the report is 6-12 months old or older.
- 24-hour priority response*
- Free Industry updates and white papers.
Possible Customization with this report (with additional cost and timeline talk to the sales executive to know more)
- Investment Opportunities
- Additional company profiles with specific to client's interest
- Additional country or region analysis- market size and forecast
- Criss-cross segment analysis- market size and forecast
- Expanded list for Company Profiles
- Historic market data
- Import Export Analysis/Data
- List of customers/consumers/raw material suppliers- value chain analysis
- SWOT Analysis
Key Market Segments
By Source
- Agriculture Residues
- Industrial Waste
- Household Waste
- Others
By Application
- Automotive
- Ships
- Power Generation
- Others
By Region
- North America
- U.S.
- Canada
- Mexico
- Europe
- Germany
- UK
- France
- Italy
- Spain
- Rest of Europe
- Asia-Pacific
- China
- Japan
- India
- South Korea
- Australia
- Rest of Asia-Pacific
- LAMEA
- Brazil
- Saudi Arabia
- South Africa
- Rest of LAMEA
Key Market Players:
- Nordsol
- BoxLNG Pvt. Ltd.
- TotalEnergies SE.
- Titan LNG
- EnviTec Biogas AG
- Shell Plc.
- Linde Plc
- DBG Group B.V.
- BIOKRAFT INTERNATIONAL AB
- Flogas Britain Ltd.
TABLE OF CONTENTS
CHAPTER 1: INTRODUCTION
- 1.1. Report description
- 1.2. Key market segments
- 1.3. Key benefits to the stakeholders
- 1.4. Research Methodology
- 1.4.1. Primary research
- 1.4.2. Secondary research
- 1.4.3. Analyst tools and models
CHAPTER 2: EXECUTIVE SUMMARY
- 2.1. CXO Perspective
CHAPTER 3: MARKET OVERVIEW
- 3.1. Market definition and scope
- 3.2. Key findings
- 3.2.1. Top impacting factors
- 3.2.2. Top investment pockets
- 3.3. Porter's five forces analysis
- 3.3.1. Low bargaining power of suppliers
- 3.3.2. Low threat of new entrants
- 3.3.3. Low threat of substitutes
- 3.3.4. Low intensity of rivalry
- 3.3.5. Low bargaining power of buyers
- 3.4. Market dynamics
- 3.4.1. Drivers
- 3.4.1.1. Environment concerns and renewable energy policies
- 3.4.1.2. Energy security and waste management
- 3.4.1.3. Low emissions and compatibility with existing infrastructure
- 3.4.2. Restraints
- 3.4.2.1. Feedstock availability
- 3.4.2.2. Processing and infrastructure costs
- 3.4.2.3. Technological challenges
- 3.4.3. Opportunities
- 3.4.3.1. Circular economy and waste management & renewable energy transition
- 3.4.3.2. Decarbonization and energy security
- 3.4.1. Drivers
- 3.5. Value Chain Analysis
- 3.6. Patent Landscape
CHAPTER 4: BIO-LNG MARKET, BY SOURCE
- 4.1. Overview
- 4.1.1. Market size and forecast
- 4.2. Agriculture Residues
- 4.2.1. Key market trends, growth factors and opportunities
- 4.2.2. Market size and forecast, by region
- 4.2.3. Market share analysis by country
- 4.3. Industrial Waste
- 4.3.1. Key market trends, growth factors and opportunities
- 4.3.2. Market size and forecast, by region
- 4.3.3. Market share analysis by country
- 4.4. Household Waste
- 4.4.1. Key market trends, growth factors and opportunities
- 4.4.2. Market size and forecast, by region
- 4.4.3. Market share analysis by country
- 4.5. Others
- 4.5.1. Key market trends, growth factors and opportunities
- 4.5.2. Market size and forecast, by region
- 4.5.3. Market share analysis by country
CHAPTER 5: BIO-LNG MARKET, BY APPLICATION
- 5.1. Overview
- 5.1.1. Market size and forecast
- 5.2. Automotive
- 5.2.1. Key market trends, growth factors and opportunities
- 5.2.2. Market size and forecast, by region
- 5.2.3. Market share analysis by country
- 5.3. Ships
- 5.3.1. Key market trends, growth factors and opportunities
- 5.3.2. Market size and forecast, by region
- 5.3.3. Market share analysis by country
- 5.4. Power Generation
- 5.4.1. Key market trends, growth factors and opportunities
- 5.4.2. Market size and forecast, by region
- 5.4.3. Market share analysis by country
- 5.5. Others
- 5.5.1. Key market trends, growth factors and opportunities
- 5.5.2. Market size and forecast, by region
- 5.5.3. Market share analysis by country
CHAPTER 6: BIO-LNG MARKET, BY REGION
- 6.1. Overview
- 6.1.1. Market size and forecast By Region
- 6.2. North America
- 6.2.1. Key market trends, growth factors and opportunities
- 6.2.2. Market size and forecast, by Source
- 6.2.3. Market size and forecast, by Application
- 6.2.4. Market size and forecast, by country
- 6.2.4.1. U.S.
- 6.2.4.1.1. Market size and forecast, by Source
- 6.2.4.1.2. Market size and forecast, by Application
- 6.2.4.2. Canada
- 6.2.4.2.1. Market size and forecast, by Source
- 6.2.4.2.2. Market size and forecast, by Application
- 6.2.4.3. Mexico
- 6.2.4.3.1. Market size and forecast, by Source
- 6.2.4.3.2. Market size and forecast, by Application
- 6.3. Europe
- 6.3.1. Key market trends, growth factors and opportunities
- 6.3.2. Market size and forecast, by Source
- 6.3.3. Market size and forecast, by Application
- 6.3.4. Market size and forecast, by country
- 6.3.4.1. Germany
- 6.3.4.1.1. Market size and forecast, by Source
- 6.3.4.1.2. Market size and forecast, by Application
- 6.3.4.2. UK
- 6.3.4.2.1. Market size and forecast, by Source
- 6.3.4.2.2. Market size and forecast, by Application
- 6.3.4.3. France
- 6.3.4.3.1. Market size and forecast, by Source
- 6.3.4.3.2. Market size and forecast, by Application
- 6.3.4.4. Italy
- 6.3.4.4.1. Market size and forecast, by Source
- 6.3.4.4.2. Market size and forecast, by Application
- 6.3.4.5. Spain
- 6.3.4.5.1. Market size and forecast, by Source
- 6.3.4.5.2. Market size and forecast, by Application
- 6.3.4.6. Rest of Europe
- 6.3.4.6.1. Market size and forecast, by Source
- 6.3.4.6.2. Market size and forecast, by Application
- 6.4. Asia-Pacific
- 6.4.1. Key market trends, growth factors and opportunities
- 6.4.2. Market size and forecast, by Source
- 6.4.3. Market size and forecast, by Application
- 6.4.4. Market size and forecast, by country
- 6.4.4.1. China
- 6.4.4.1.1. Market size and forecast, by Source
- 6.4.4.1.2. Market size and forecast, by Application
- 6.4.4.2. Japan
- 6.4.4.2.1. Market size and forecast, by Source
- 6.4.4.2.2. Market size and forecast, by Application
- 6.4.4.3. India
- 6.4.4.3.1. Market size and forecast, by Source
- 6.4.4.3.2. Market size and forecast, by Application
- 6.4.4.4. South Korea
- 6.4.4.4.1. Market size and forecast, by Source
- 6.4.4.4.2. Market size and forecast, by Application
- 6.4.4.5. Australia
- 6.4.4.5.1. Market size and forecast, by Source
- 6.4.4.5.2. Market size and forecast, by Application
- 6.4.4.6. Rest of Asia-Pacific
- 6.4.4.6.1. Market size and forecast, by Source
- 6.4.4.6.2. Market size and forecast, by Application
- 6.5. LAMEA
- 6.5.1. Key market trends, growth factors and opportunities
- 6.5.2. Market size and forecast, by Source
- 6.5.3. Market size and forecast, by Application
- 6.5.4. Market size and forecast, by country
- 6.5.4.1. Brazil
- 6.5.4.1.1. Market size and forecast, by Source
- 6.5.4.1.2. Market size and forecast, by Application
- 6.5.4.2. Saudi Arabia
- 6.5.4.2.1. Market size and forecast, by Source
- 6.5.4.2.2. Market size and forecast, by Application
- 6.5.4.3. South Africa
- 6.5.4.3.1. Market size and forecast, by Source
- 6.5.4.3.2. Market size and forecast, by Application
- 6.5.4.4. Rest of LAMEA
- 6.5.4.4.1. Market size and forecast, by Source
- 6.5.4.4.2. Market size and forecast, by Application
CHAPTER 7: COMPETITIVE LANDSCAPE
- 7.1. Introduction
- 7.2. Top winning strategies
- 7.3. Product Mapping of Top 10 Player
- 7.4. Competitive Dashboard
- 7.5. Competitive Heatmap
- 7.6. Top player positioning, 2022
CHAPTER 8: COMPANY PROFILES
- 8.1. Linde Plc
- 8.1.1. Company overview
- 8.1.2. Key Executives
- 8.1.3. Company snapshot
- 8.1.4. Operating business segments
- 8.1.5. Product portfolio
- 8.1.6. Business performance
- 8.1.7. Key strategic moves and developments
- 8.2. Shell Plc.
- 8.2.1. Company overview
- 8.2.2. Key Executives
- 8.2.3. Company snapshot
- 8.2.4. Operating business segments
- 8.2.5. Product portfolio
- 8.2.6. Business performance
- 8.2.7. Key strategic moves and developments
- 8.3. Nordsol
- 8.3.1. Company overview
- 8.3.2. Key Executives
- 8.3.3. Company snapshot
- 8.3.4. Operating business segments
- 8.3.5. Product portfolio
- 8.3.6. Key strategic moves and developments
- 8.4. Flogas Britain Ltd.
- 8.4.1. Company overview
- 8.4.2. Key Executives
- 8.4.3. Company snapshot
- 8.4.4. Operating business segments
- 8.4.5. Product portfolio
- 8.5. EnviTec Biogas AG
- 8.5.1. Company overview
- 8.5.2. Key Executives
- 8.5.3. Company snapshot
- 8.5.4. Operating business segments
- 8.5.5. Product portfolio
- 8.5.6. Business performance
- 8.6. TotalEnergies SE.
- 8.6.1. Company overview
- 8.6.2. Key Executives
- 8.6.3. Company snapshot
- 8.6.4. Operating business segments
- 8.6.5. Product portfolio
- 8.6.6. Business performance
- 8.6.7. Key strategic moves and developments
- 8.7. Titan LNG
- 8.7.1. Company overview
- 8.7.2. Key Executives
- 8.7.3. Company snapshot
- 8.7.4. Operating business segments
- 8.7.5. Product portfolio
- 8.8. BIOKRAFT INTERNATIONAL AB
- 8.8.1. Company overview
- 8.8.2. Key Executives
- 8.8.3. Company snapshot
- 8.8.4. Operating business segments
- 8.8.5. Product portfolio
- 8.8.6. Business performance
- 8.8.7. Key strategic moves and developments
- 8.9. DBG Group B.V.
- 8.9.1. Company overview
- 8.9.2. Key Executives
- 8.9.3. Company snapshot
- 8.9.4. Operating business segments
- 8.9.5. Product portfolio
- 8.9.6. Key strategic moves and developments
- 8.10. BoxLNG Pvt. Ltd.
- 8.10.1. Company overview
- 8.10.2. Key Executives
- 8.10.3. Company snapshot
- 8.10.4. Operating business segments
- 8.10.5. Product portfolio
- 8.10.6. Key strategic moves and developments
LIST OF TABLES
- TABLE 01. GLOBAL BIO-LNG MARKET, BY SOURCE, 2022-2032 ($MILLION)
- TABLE 02. BIO-LNG MARKET FOR AGRICULTURE RESIDUES, BY REGION, 2022-2032 ($MILLION)
- TABLE 03. BIO-LNG MARKET FOR INDUSTRIAL WASTE, BY REGION, 2022-2032 ($MILLION)
- TABLE 04. BIO-LNG MARKET FOR HOUSEHOLD WASTE, BY REGION, 2022-2032 ($MILLION)
- TABLE 05. BIO-LNG MARKET FOR OTHERS, BY REGION, 2022-2032 ($MILLION)
- TABLE 06. GLOBAL BIO-LNG MARKET, BY APPLICATION, 2022-2032 ($MILLION)
- TABLE 07. BIO-LNG MARKET FOR AUTOMOTIVE, BY REGION, 2022-2032 ($MILLION)
- TABLE 08. BIO-LNG MARKET FOR SHIPS, BY REGION, 2022-2032 ($MILLION)
- TABLE 09. BIO-LNG MARKET FOR POWER GENERATION, BY REGION, 2022-2032 ($MILLION)
- TABLE 10. BIO-LNG MARKET FOR OTHERS, BY REGION, 2022-2032 ($MILLION)
- TABLE 11. BIO-LNG MARKET, BY REGION, 2022-2032 ($MILLION)
- TABLE 12. NORTH AMERICA BIO-LNG MARKET, BY SOURCE, 2022-2032 ($MILLION)
- TABLE 13. NORTH AMERICA BIO-LNG MARKET, BY APPLICATION, 2022-2032 ($MILLION)
- TABLE 14. NORTH AMERICA BIO-LNG MARKET, BY COUNTRY, 2022-2032 ($MILLION)
- TABLE 15. U.S. BIO-LNG MARKET, BY SOURCE, 2022-2032 ($MILLION)
- TABLE 16. U.S. BIO-LNG MARKET, BY APPLICATION, 2022-2032 ($MILLION)
- TABLE 17. CANADA BIO-LNG MARKET, BY SOURCE, 2022-2032 ($MILLION)
- TABLE 18. CANADA BIO-LNG MARKET, BY APPLICATION, 2022-2032 ($MILLION)
- TABLE 19. MEXICO BIO-LNG MARKET, BY SOURCE, 2022-2032 ($MILLION)
- TABLE 20. MEXICO BIO-LNG MARKET, BY APPLICATION, 2022-2032 ($MILLION)
- TABLE 21. EUROPE BIO-LNG MARKET, BY SOURCE, 2022-2032 ($MILLION)
- TABLE 22. EUROPE BIO-LNG MARKET, BY APPLICATION, 2022-2032 ($MILLION)
- TABLE 23. EUROPE BIO-LNG MARKET, BY COUNTRY, 2022-2032 ($MILLION)
- TABLE 24. GERMANY BIO-LNG MARKET, BY SOURCE, 2022-2032 ($MILLION)
- TABLE 25. GERMANY BIO-LNG MARKET, BY APPLICATION, 2022-2032 ($MILLION)
- TABLE 26. UK BIO-LNG MARKET, BY SOURCE, 2022-2032 ($MILLION)
- TABLE 27. UK BIO-LNG MARKET, BY APPLICATION, 2022-2032 ($MILLION)
- TABLE 28. FRANCE BIO-LNG MARKET, BY SOURCE, 2022-2032 ($MILLION)
- TABLE 29. FRANCE BIO-LNG MARKET, BY APPLICATION, 2022-2032 ($MILLION)
- TABLE 30. ITALY BIO-LNG MARKET, BY SOURCE, 2022-2032 ($MILLION)
- TABLE 31. ITALY BIO-LNG MARKET, BY APPLICATION, 2022-2032 ($MILLION)
- TABLE 32. SPAIN BIO-LNG MARKET, BY SOURCE, 2022-2032 ($MILLION)
- TABLE 33. SPAIN BIO-LNG MARKET, BY APPLICATION, 2022-2032 ($MILLION)
- TABLE 34. REST OF EUROPE BIO-LNG MARKET, BY SOURCE, 2022-2032 ($MILLION)
- TABLE 35. REST OF EUROPE BIO-LNG MARKET, BY APPLICATION, 2022-2032 ($MILLION)
- TABLE 36. ASIA-PACIFIC BIO-LNG MARKET, BY SOURCE, 2022-2032 ($MILLION)
- TABLE 37. ASIA-PACIFIC BIO-LNG MARKET, BY APPLICATION, 2022-2032 ($MILLION)
- TABLE 38. ASIA-PACIFIC BIO-LNG MARKET, BY COUNTRY, 2022-2032 ($MILLION)
- TABLE 39. CHINA BIO-LNG MARKET, BY SOURCE, 2022-2032 ($MILLION)
- TABLE 40. CHINA BIO-LNG MARKET, BY APPLICATION, 2022-2032 ($MILLION)
- TABLE 41. JAPAN BIO-LNG MARKET, BY SOURCE, 2022-2032 ($MILLION)
- TABLE 42. JAPAN BIO-LNG MARKET, BY APPLICATION, 2022-2032 ($MILLION)
- TABLE 43. INDIA BIO-LNG MARKET, BY SOURCE, 2022-2032 ($MILLION)
- TABLE 44. INDIA BIO-LNG MARKET, BY APPLICATION, 2022-2032 ($MILLION)
- TABLE 45. SOUTH KOREA BIO-LNG MARKET, BY SOURCE, 2022-2032 ($MILLION)
- TABLE 46. SOUTH KOREA BIO-LNG MARKET, BY APPLICATION, 2022-2032 ($MILLION)
- TABLE 47. AUSTRALIA BIO-LNG MARKET, BY SOURCE, 2022-2032 ($MILLION)
- TABLE 48. AUSTRALIA BIO-LNG MARKET, BY APPLICATION, 2022-2032 ($MILLION)
- TABLE 49. REST OF ASIA-PACIFIC BIO-LNG MARKET, BY SOURCE, 2022-2032 ($MILLION)
- TABLE 50. REST OF ASIA-PACIFIC BIO-LNG MARKET, BY APPLICATION, 2022-2032 ($MILLION)
- TABLE 51. LAMEA BIO-LNG MARKET, BY SOURCE, 2022-2032 ($MILLION)
- TABLE 52. LAMEA BIO-LNG MARKET, BY APPLICATION, 2022-2032 ($MILLION)
- TABLE 53. LAMEA BIO-LNG MARKET, BY COUNTRY, 2022-2032 ($MILLION)
- TABLE 54. BRAZIL BIO-LNG MARKET, BY SOURCE, 2022-2032 ($MILLION)
- TABLE 55. BRAZIL BIO-LNG MARKET, BY APPLICATION, 2022-2032 ($MILLION)
- TABLE 56. SAUDI ARABIA BIO-LNG MARKET, BY SOURCE, 2022-2032 ($MILLION)
- TABLE 57. SAUDI ARABIA BIO-LNG MARKET, BY APPLICATION, 2022-2032 ($MILLION)
- TABLE 58. SOUTH AFRICA BIO-LNG MARKET, BY SOURCE, 2022-2032 ($MILLION)
- TABLE 59. SOUTH AFRICA BIO-LNG MARKET, BY APPLICATION, 2022-2032 ($MILLION)
- TABLE 60. REST OF LAMEA BIO-LNG MARKET, BY SOURCE, 2022-2032 ($MILLION)
- TABLE 61. REST OF LAMEA BIO-LNG MARKET, BY APPLICATION, 2022-2032 ($MILLION)
- TABLE 62. LINDE PLC: KEY EXECUTIVES
- TABLE 63. LINDE PLC: COMPANY SNAPSHOT
- TABLE 64. LINDE PLC: PRODUCT SEGMENTS
- TABLE 65. LINDE PLC: PRODUCT PORTFOLIO
- TABLE 66. LINDE PLC: KEY STRATERGIES
- TABLE 67. SHELL PLC.: KEY EXECUTIVES
- TABLE 68. SHELL PLC.: COMPANY SNAPSHOT
- TABLE 69. SHELL PLC.: PRODUCT SEGMENTS
- TABLE 70. SHELL PLC.: PRODUCT PORTFOLIO
- TABLE 71. SHELL PLC.: KEY STRATERGIES
- TABLE 72. NORDSOL: KEY EXECUTIVES
- TABLE 73. NORDSOL: COMPANY SNAPSHOT
- TABLE 74. NORDSOL: PRODUCT SEGMENTS
- TABLE 75. NORDSOL: PRODUCT PORTFOLIO
- TABLE 76. NORDSOL: KEY STRATERGIES
- TABLE 77. FLOGAS BRITAIN LTD.: KEY EXECUTIVES
- TABLE 78. FLOGAS BRITAIN LTD.: COMPANY SNAPSHOT
- TABLE 79. FLOGAS BRITAIN LTD.: PRODUCT SEGMENTS
- TABLE 80. FLOGAS BRITAIN LTD.: PRODUCT PORTFOLIO
- TABLE 81. ENVITEC BIOGAS AG: KEY EXECUTIVES
- TABLE 82. ENVITEC BIOGAS AG: COMPANY SNAPSHOT
- TABLE 83. ENVITEC BIOGAS AG: SERVICE SEGMENTS
- TABLE 84. ENVITEC BIOGAS AG: PRODUCT PORTFOLIO
- TABLE 85. TOTALENERGIES SE.: KEY EXECUTIVES
- TABLE 86. TOTALENERGIES SE.: COMPANY SNAPSHOT
- TABLE 87. TOTALENERGIES SE.: SERVICE SEGMENTS
- TABLE 88. TOTALENERGIES SE.: PRODUCT PORTFOLIO
- TABLE 89. TOTALENERGIES SE.: KEY STRATERGIES
- TABLE 90. TITAN LNG: KEY EXECUTIVES
- TABLE 91. TITAN LNG: COMPANY SNAPSHOT
- TABLE 92. TITAN LNG: SERVICE SEGMENTS
- TABLE 93. TITAN LNG: PRODUCT PORTFOLIO
- TABLE 94. BIOKRAFT INTERNATIONAL AB: KEY EXECUTIVES
- TABLE 95. BIOKRAFT INTERNATIONAL AB: COMPANY SNAPSHOT
- TABLE 96. BIOKRAFT INTERNATIONAL AB: PRODUCT SEGMENTS
- TABLE 97. BIOKRAFT INTERNATIONAL AB: PRODUCT PORTFOLIO
- TABLE 98. BIOKRAFT INTERNATIONAL AB: KEY STRATERGIES
- TABLE 99. DBG GROUP B.V.: KEY EXECUTIVES
- TABLE 100. DBG GROUP B.V.: COMPANY SNAPSHOT
- TABLE 101. DBG GROUP B.V.: PRODUCT SEGMENTS
- TABLE 102. DBG GROUP B.V.: PRODUCT PORTFOLIO
- TABLE 103. DBG GROUP B.V.: KEY STRATERGIES
- TABLE 104. BOXLNG PVT. LTD.: KEY EXECUTIVES
- TABLE 105. BOXLNG PVT. LTD.: COMPANY SNAPSHOT
- TABLE 106. BOXLNG PVT. LTD.: PRODUCT SEGMENTS
- TABLE 107. BOXLNG PVT. LTD.: PRODUCT PORTFOLIO
- TABLE 108. BOXLNG PVT. LTD.: KEY STRATERGIES
LIST OF FIGURES
- FIGURE 01. BIO-LNG MARKET, 2022-2032
- FIGURE 02. SEGMENTATION OF BIO-LNG MARKET,2022-2032
- FIGURE 03. TOP INVESTMENT POCKETS IN BIO-LNG MARKET (2023-2032)
- FIGURE 04. LOW BARGAINING POWER OF SUPPLIERS
- FIGURE 05. LOW THREAT OF NEW ENTRANTS
- FIGURE 06. LOW THREAT OF SUBSTITUTES
- FIGURE 07. LOW INTENSITY OF RIVALRY
- FIGURE 08. LOW BARGAINING POWER OF BUYERS
- FIGURE 09. GLOBAL BIO-LNG MARKET:DRIVERS, RESTRAINTS AND OPPORTUNITIES
- FIGURE 10. PATENT ANALYSIS BY COMPANY
- FIGURE 11. PATENT ANALYSIS BY COUNTRY
- FIGURE 12. BIO-LNG MARKET, BY SOURCE, 2022 AND 2032(%)
- FIGURE 13. COMPARATIVE SHARE ANALYSIS OF BIO-LNG MARKET FOR AGRICULTURE RESIDUES, BY COUNTRY 2022 AND 2032(%)
- FIGURE 14. COMPARATIVE SHARE ANALYSIS OF BIO-LNG MARKET FOR INDUSTRIAL WASTE, BY COUNTRY 2022 AND 2032(%)
- FIGURE 15. COMPARATIVE SHARE ANALYSIS OF BIO-LNG MARKET FOR HOUSEHOLD WASTE, BY COUNTRY 2022 AND 2032(%)
- FIGURE 16. COMPARATIVE SHARE ANALYSIS OF BIO-LNG MARKET FOR OTHERS, BY COUNTRY 2022 AND 2032(%)
- FIGURE 17. BIO-LNG MARKET, BY APPLICATION, 2022 AND 2032(%)
- FIGURE 18. COMPARATIVE SHARE ANALYSIS OF BIO-LNG MARKET FOR AUTOMOTIVE, BY COUNTRY 2022 AND 2032(%)
- FIGURE 19. COMPARATIVE SHARE ANALYSIS OF BIO-LNG MARKET FOR SHIPS, BY COUNTRY 2022 AND 2032(%)
- FIGURE 20. COMPARATIVE SHARE ANALYSIS OF BIO-LNG MARKET FOR POWER GENERATION, BY COUNTRY 2022 AND 2032(%)
- FIGURE 21. COMPARATIVE SHARE ANALYSIS OF BIO-LNG MARKET FOR OTHERS, BY COUNTRY 2022 AND 2032(%)
- FIGURE 22. BIO-LNG MARKET BY REGION, 2022 AND 2032(%)
- FIGURE 23. U.S. BIO-LNG MARKET, 2022-2032 ($MILLION)
- FIGURE 24. CANADA BIO-LNG MARKET, 2022-2032 ($MILLION)
- FIGURE 25. MEXICO BIO-LNG MARKET, 2022-2032 ($MILLION)
- FIGURE 26. GERMANY BIO-LNG MARKET, 2022-2032 ($MILLION)
- FIGURE 27. UK BIO-LNG MARKET, 2022-2032 ($MILLION)
- FIGURE 28. FRANCE BIO-LNG MARKET, 2022-2032 ($MILLION)
- FIGURE 29. ITALY BIO-LNG MARKET, 2022-2032 ($MILLION)
- FIGURE 30. SPAIN BIO-LNG MARKET, 2022-2032 ($MILLION)
- FIGURE 31. REST OF EUROPE BIO-LNG MARKET, 2022-2032 ($MILLION)
- FIGURE 32. CHINA BIO-LNG MARKET, 2022-2032 ($MILLION)
- FIGURE 33. JAPAN BIO-LNG MARKET, 2022-2032 ($MILLION)
- FIGURE 34. INDIA BIO-LNG MARKET, 2022-2032 ($MILLION)
- FIGURE 35. SOUTH KOREA BIO-LNG MARKET, 2022-2032 ($MILLION)
- FIGURE 36. AUSTRALIA BIO-LNG MARKET, 2022-2032 ($MILLION)
- FIGURE 37. REST OF ASIA-PACIFIC BIO-LNG MARKET, 2022-2032 ($MILLION)
- FIGURE 38. BRAZIL BIO-LNG MARKET, 2022-2032 ($MILLION)
- FIGURE 39. SAUDI ARABIA BIO-LNG MARKET, 2022-2032 ($MILLION)
- FIGURE 40. SOUTH AFRICA BIO-LNG MARKET, 2022-2032 ($MILLION)
- FIGURE 41. REST OF LAMEA BIO-LNG MARKET, 2022-2032 ($MILLION)
- FIGURE 42. TOP WINNING STRATEGIES, BY YEAR (2017-2023)
- FIGURE 43. TOP WINNING STRATEGIES, BY DEVELOPMENT (2017-2023)
- FIGURE 44. TOP WINNING STRATEGIES, BY COMPANY (2017-2023)
- FIGURE 45. PRODUCT MAPPING OF TOP 10 PLAYERS
- FIGURE 46. COMPETITIVE DASHBOARD
- FIGURE 47. COMPETITIVE HEATMAP: BIO-LNG MARKET
- FIGURE 48. TOP PLAYER POSITIONING, 2022
- FIGURE 49. LINDE PLC: NET SALES, 2020-2022 ($MILLION)
- FIGURE 50. LINDE PLC: RESEARCH & DEVELOPMENT EXPENDITURE, 2020-2022 ($MILLION)
- FIGURE 51. LINDE PLC: REVENUE SHARE BY SEGMENT, 2022 (%)
- FIGURE 52. LINDE PLC: REVENUE SHARE BY REGION, 2022 (%)
- FIGURE 53. SHELL PLC.: NET REVENUE, 2020-2022 ($MILLION)
- FIGURE 54. SHELL PLC.: RESEARCH & DEVELOPMENT EXPENDITURE, 2020-2022 ($MILLION)
- FIGURE 55. SHELL PLC.: REVENUE SHARE BY SEGMENT, 2022 (%)
- FIGURE 56. SHELL PLC.: REVENUE SHARE BY REGION, 2022 (%)
- FIGURE 57. ENVITEC BIOGAS AG: NET SALES, 2019-2021 ($MILLION)
- FIGURE 58. ENVITEC BIOGAS AG: REVENUE SHARE BY SEGMENT, 2021 (%)
- FIGURE 59. ENVITEC BIOGAS AG: REVENUE SHARE BY REGION, 2021 (%)
- FIGURE 60. TOTALENERGIES SE.: SALES REVENUE, 2020-2022 ($MILLION)
- FIGURE 61. TOTALENERGIES SE.: RESEARCH & DEVELOPMENT EXPENDITURE, 2020-2022 ($MILLION)
- FIGURE 62. TOTALENERGIES SE.: REVENUE SHARE BY SEGMENT, 2022 (%)
- FIGURE 63. BIOKRAFT INTERNATIONAL AB: NET SALES, 2020-2022 ($MILLION)

