
PUBLISHER: Allied Market Research | PRODUCT CODE: 1415004

PUBLISHER: Allied Market Research | PRODUCT CODE: 1415004
CAR T-Cell Therapy Market By Drug type, By Indication, By End user : Global Opportunity Analysis and Industry Forecast, 2023?2032
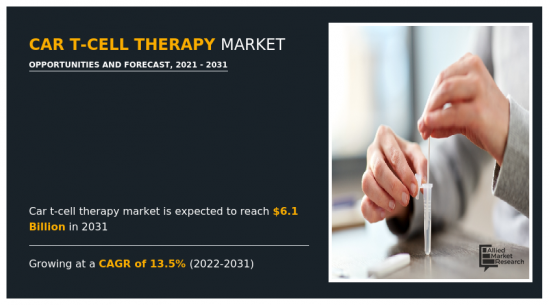
According to a new report published by Allied Market Research, titled, "CAR T-Cell therapy Market," The car t-cell therapy market was valued at $1.7 billion in 2021, and is estimated to reach $6.1 billion by 2031, growing at a CAGR of 13.5% from 2022 to 2031. Chimeric antigen receptor (CAR) T-cell therapy is a new type of cancer treatment. CAR T-cell therapy is a type of cell-based gene therapy, because it involves altering the genes inside T-cells to help them attack the cancer. T-cells are part of the immune system. They are a type of white blood cell with proteins on the surface that act as receptors.
Chimeric antigen receptor (CAR) T-cell therapy is a new type of cancer treatment. During this treatment, healthcare professionals reprogram the immune system to attack cancer cells. CAR T-cell therapy is a type of cell-based gene therapy, because it involves altering the genes inside T-cells to help them attack the cancer. T-cells are part of the immune system. They are a type of white blood cell with proteins on the surface that act as receptors. Healthcare professionals currently use CAR T-cell therapy to treat various types of cancer.
The CAR T-cell therapy market will show significant market growth during the forecast period owing to rise in prevalence of cancer, rise in demand for ideal therapeutics for treatment of cancer, and favorable reimbursement policies provided by manufacturers & insurance providers in some countries. However, higher cost of treatment, and stringent government regulation for approval of these therapeutics are expected to hamper the market growth. Furthermore, promising drugs in pipeline, expected approval of newer CART therapeutics, rise in number of target population with lack of ideal treatment, and surge in awareness regarding CART therapies are expected to significantly drive the market growth during the forecast period. In addition, technological advancements, launch of various products, and strategies among the key players such as acquisition, collaboration, and agreement drive the CAR T-cell therapy market growth.
The CAR T-cell therapy market is segmented on the basis of drug type, indication, end user, and region. On the basis of drug type, the market is classified into axicabtagene ciloleucel, tisagenlecleucel, brexucabtagene autoleucel, and others. By indication, the market is segregated into lymphoma, acute lymphocytic leukemia, and others. Depending on end user, it is fragmented into hospitals and cancer treatment centers.
The CAR T-cell therapy market is studied across North America (the U.S., and Canada), Europe (Germany, France, the UK, and rest of Europe), Asia-Pacific (Japan, China, and rest of Asia-Pacific), and LAMEA (Latin America and Middle East and Africa).
The major players profiled in the report are: Autolus, Bluebird Bio-Inc., Bristol-Myers Squibb, Caribou Biosciences Inc., Cartesian Therapeutics, Celgene Corporation, Cellectis, Celyad, Gilead Sciences, Inc. (Kite Pharma Inc.), Intellia Therapeutics, Juno Therapeutics, Merck & Co. Inc., Miltenyi Biotech, Novartis AG, Pfizer Inc., and Sorrento Therapeutics, Inc.
Key Benefits For Stakeholders
- This report provides a quantitative analysis of the market segments, current trends, estimations, and dynamics of the car t-cell therapy market analysis from 2021 to 2031 to identify the prevailing car t-cell therapy market opportunities.
- The market research is offered along with information related to key drivers, restraints, and opportunities.
- Porter's five forces analysis highlights the potency of buyers and suppliers to enable stakeholders make profit-oriented business decisions and strengthen their supplier-buyer network.
- In-depth analysis of the car t-cell therapy market segmentation assists to determine the prevailing market opportunities.
- Major countries in each region are mapped according to their revenue contribution to the global market.
- Market player positioning facilitates benchmarking and provides a clear understanding of the present position of the market players.
- The report includes the analysis of the regional as well as global car t-cell therapy market trends, key players, market segments, application areas, and market growth strategies.
Additional benefits you will get with this purchase are:
- Quarterly Update and* (only available with a corporate license, on listed price)
- 5 additional Company Profile of client Choice pre- or Post-purchase, as a free update.
- Free Upcoming Version on the Purchase of Five and Enterprise User License.
- 16 analyst hours of support* (post-purchase, if you find additional data requirements upon review of the report, you may receive support amounting to 16 analyst hours to solve questions, and post-sale queries)
- 15% Free Customization* (in case the scope or segment of the report does not match your requirements, 15% is equivalent to 3 working days of free work, applicable once)
- Free data Pack on the Five and Enterprise User License. (Excel version of the report)
- Free Updated report if the report is 6-12 months old or older.
- 24-hour priority response*
- Free Industry updates and white papers.
Possible Customization with this report (with additional cost and timeline, please talk to the sales executive to know more)
- Go To Market Strategy
- New Product Development/ Product Matrix of Key Players
- Additional company profiles with specific to client's interest
- Additional country or region analysis- market size and forecast
- Average Selling Price Analysis / Price Point Analysis
- Key player details (including location, contact details, supplier/vendor network etc. in excel format)
- SWOT Analysis
Key Market Segments
By Drug type
- Axicabtagene Ciloleucel
- Tisagenlecleucel
- Brexucabtagene Autoleucel
- Others
By Indication
- Lymphoma
- Acute Lymphocytic Leukemia
- Others
By End user
- Hospitals
- Cancer Treatment Centers
By Region
- North America
- U.S.
- Canada
- Europe
- Germany
- France
- U.K.
- Rest of Europe
- Asia-Pacific
- Japan
- China
- Rest of Asia-Pacific
- LAMEA
- Latin America
- Middle East And Africa
Key Market Players:
- Autolus Therapeutics
- Bluebird Bio, Inc.
- Bristol-Myers Squibb
- Caribou Biosciences, Inc.
- Cartesian Therapeutics, Inc.
- Celgene Corporation
- Cellectis
- Celyad Oncology
- Gilead Sciences, Inc. (Kite Pharma Inc.)
- Intellia Therapeutics
- Juno Therapeutics, Inc.
- Merck & Co., Inc.
- Miltenyi Biotech
- Novartis AG
- Pfizer, Inc.
- Sorrento Therapeutics, Inc.
TABLE OF CONTENTS
CHAPTER 1: INTRODUCTION
- 1.1. Report description
- 1.2. Key market segments
- 1.3. Key benefits to the stakeholders
- 1.4. Research Methodology
- 1.4.1. Primary research
- 1.4.2. Secondary research
- 1.4.3. Analyst tools and models
CHAPTER 2: EXECUTIVE SUMMARY
- 2.1. CXO Perspective
CHAPTER 3: MARKET OVERVIEW
- 3.1. Market definition and scope
- 3.2. Key findings
- 3.2.1. Top impacting factors
- 3.2.2. Top investment pockets
- 3.3. Porter's five forces analysis
- 3.3.1. Low bargaining power of suppliers
- 3.3.2. Low threat of new entrants
- 3.3.3. Low threat of substitutes
- 3.3.4. Low intensity of rivalry
- 3.3.5. Low bargaining power of buyers
- 3.4. Market dynamics
- 3.4.1. Drivers
- 3.4.1.1. Surge in prevalence of cancer
- 3.4.1.2. Rise in awareness regarding CAR T-cell therapy
- 3.4.1.3. Increase in demand of ideal therapeutics for treatment of cancer
- 3.4.1. Drivers
- 3.4.2. Restraints
- 3.4.2.1. High cost of CAR T-cell therapies
- 3.4.2.2. Strict government regulation for approval of drugs
- 3.4.3. Opportunities
- 3.4.3.1. Increase in R&D activities to develop CAR T-cell therapeutics
- 3.5. COVID-19 Impact Analysis on the market
CHAPTER 4: CAR T-CELL THERAPY MARKET, BY DRUG TYPE
- 4.1. Overview
- 4.1.1. Market size and forecast
- 4.2. Axicabtagene Ciloleucel
- 4.2.1. Key market trends, growth factors and opportunities
- 4.2.2. Market size and forecast, by region
- 4.2.3. Market share analysis by country
- 4.3. Tisagenlecleucel
- 4.3.1. Key market trends, growth factors and opportunities
- 4.3.2. Market size and forecast, by region
- 4.3.3. Market share analysis by country
- 4.4. Brexucabtagene Autoleucel
- 4.4.1. Key market trends, growth factors and opportunities
- 4.4.2. Market size and forecast, by region
- 4.4.3. Market share analysis by country
- 4.5. Others
- 4.5.1. Key market trends, growth factors and opportunities
- 4.5.2. Market size and forecast, by region
- 4.5.3. Market share analysis by country
CHAPTER 5: CAR T-CELL THERAPY MARKET, BY INDICATION
- 5.1. Overview
- 5.1.1. Market size and forecast
- 5.2. Lymphoma
- 5.2.1. Key market trends, growth factors and opportunities
- 5.2.2. Market size and forecast, by region
- 5.2.3. Market share analysis by country
- 5.3. Acute Lymphocytic Leukemia
- 5.3.1. Key market trends, growth factors and opportunities
- 5.3.2. Market size and forecast, by region
- 5.3.3. Market share analysis by country
- 5.4. Others
- 5.4.1. Key market trends, growth factors and opportunities
- 5.4.2. Market size and forecast, by region
- 5.4.3. Market share analysis by country
CHAPTER 6: CAR T-CELL THERAPY MARKET, BY END USER
- 6.1. Overview
- 6.1.1. Market size and forecast
- 6.2. Hospitals
- 6.2.1. Key market trends, growth factors and opportunities
- 6.2.2. Market size and forecast, by region
- 6.2.3. Market share analysis by country
- 6.3. Cancer Treatment Centers
- 6.3.1. Key market trends, growth factors and opportunities
- 6.3.2. Market size and forecast, by region
- 6.3.3. Market share analysis by country
CHAPTER 7: CAR T-CELL THERAPY MARKET, BY REGION
- 7.1. Overview
- 7.1.1. Market size and forecast By Region
- 7.2. North America
- 7.2.1. Key trends and opportunities
- 7.2.2. Market size and forecast, by Drug type
- 7.2.3. Market size and forecast, by Indication
- 7.2.4. Market size and forecast, by End user
- 7.2.5. Market size and forecast, by country
- 7.2.5.1. U.S.
- 7.2.5.1.1. Key market trends, growth factors and opportunities
- 7.2.5.1.2. Market size and forecast, by Drug type
- 7.2.5.1.3. Market size and forecast, by Indication
- 7.2.5.1.4. Market size and forecast, by End user
- 7.2.5.2. Canada
- 7.2.5.2.1. Key market trends, growth factors and opportunities
- 7.2.5.2.2. Market size and forecast, by Drug type
- 7.2.5.2.3. Market size and forecast, by Indication
- 7.2.5.2.4. Market size and forecast, by End user
- 7.3. Europe
- 7.3.1. Key trends and opportunities
- 7.3.2. Market size and forecast, by Drug type
- 7.3.3. Market size and forecast, by Indication
- 7.3.4. Market size and forecast, by End user
- 7.3.5. Market size and forecast, by country
- 7.3.5.1. Germany
- 7.3.5.1.1. Key market trends, growth factors and opportunities
- 7.3.5.1.2. Market size and forecast, by Drug type
- 7.3.5.1.3. Market size and forecast, by Indication
- 7.3.5.1.4. Market size and forecast, by End user
- 7.3.5.2. France
- 7.3.5.2.1. Key market trends, growth factors and opportunities
- 7.3.5.2.2. Market size and forecast, by Drug type
- 7.3.5.2.3. Market size and forecast, by Indication
- 7.3.5.2.4. Market size and forecast, by End user
- 7.3.5.3. U.K.
- 7.3.5.3.1. Key market trends, growth factors and opportunities
- 7.3.5.3.2. Market size and forecast, by Drug type
- 7.3.5.3.3. Market size and forecast, by Indication
- 7.3.5.3.4. Market size and forecast, by End user
- 7.3.5.4. Rest of Europe
- 7.3.5.4.1. Key market trends, growth factors and opportunities
- 7.3.5.4.2. Market size and forecast, by Drug type
- 7.3.5.4.3. Market size and forecast, by Indication
- 7.3.5.4.4. Market size and forecast, by End user
- 7.4. Asia-Pacific
- 7.4.1. Key trends and opportunities
- 7.4.2. Market size and forecast, by Drug type
- 7.4.3. Market size and forecast, by Indication
- 7.4.4. Market size and forecast, by End user
- 7.4.5. Market size and forecast, by country
- 7.4.5.1. Japan
- 7.4.5.1.1. Key market trends, growth factors and opportunities
- 7.4.5.1.2. Market size and forecast, by Drug type
- 7.4.5.1.3. Market size and forecast, by Indication
- 7.4.5.1.4. Market size and forecast, by End user
- 7.4.5.2. China
- 7.4.5.2.1. Key market trends, growth factors and opportunities
- 7.4.5.2.2. Market size and forecast, by Drug type
- 7.4.5.2.3. Market size and forecast, by Indication
- 7.4.5.2.4. Market size and forecast, by End user
- 7.4.5.3. Rest of Asia-Pacific
- 7.4.5.3.1. Key market trends, growth factors and opportunities
- 7.4.5.3.2. Market size and forecast, by Drug type
- 7.4.5.3.3. Market size and forecast, by Indication
- 7.4.5.3.4. Market size and forecast, by End user
- 7.5. LAMEA
- 7.5.1. Key trends and opportunities
- 7.5.2. Market size and forecast, by Drug type
- 7.5.3. Market size and forecast, by Indication
- 7.5.4. Market size and forecast, by End user
- 7.5.5. Market size and forecast, by country
- 7.5.5.1. Latin America
- 7.5.5.1.1. Key market trends, growth factors and opportunities
- 7.5.5.1.2. Market size and forecast, by Drug type
- 7.5.5.1.3. Market size and forecast, by Indication
- 7.5.5.1.4. Market size and forecast, by End user
- 7.5.5.2. Middle East And Africa
- 7.5.5.2.1. Key market trends, growth factors and opportunities
- 7.5.5.2.2. Market size and forecast, by Drug type
- 7.5.5.2.3. Market size and forecast, by Indication
- 7.5.5.2.4. Market size and forecast, by End user
CHAPTER 8: COMPETITIVE LANDSCAPE
- 8.1. Introduction
- 8.2. Top winning strategies
- 8.3. Product Mapping of Top 10 Player
- 8.4. Competitive Dashboard
- 8.5. Competitive Heatmap
- 8.6. Top player positioning, 2021
CHAPTER 9: COMPANY PROFILES
- 9.1. Autolus Therapeutics
- 9.1.1. Company overview
- 9.1.2. Key Executives
- 9.1.3. Company snapshot
- 9.1.4. Operating business segments
- 9.1.5. Product portfolio
- 9.2. Bluebird Bio, Inc.
- 9.2.1. Company overview
- 9.2.2. Key Executives
- 9.2.3. Company snapshot
- 9.2.4. Operating business segments
- 9.2.5. Product portfolio
- 9.2.6. Business performance
- 9.2.7. Key strategic moves and developments
- 9.3. Bristol-Myers Squibb
- 9.3.1. Company overview
- 9.3.2. Key Executives
- 9.3.3. Company snapshot
- 9.3.4. Operating business segments
- 9.3.5. Product portfolio
- 9.3.6. Business performance
- 9.3.7. Key strategic moves and developments
- 9.4. Caribou Biosciences, Inc.
- 9.4.1. Company overview
- 9.4.2. Key Executives
- 9.4.3. Company snapshot
- 9.4.4. Operating business segments
- 9.4.5. Product portfolio
- 9.5. Cartesian Therapeutics, Inc.
- 9.5.1. Company overview
- 9.5.2. Key Executives
- 9.5.3. Company snapshot
- 9.5.4. Operating business segments
- 9.5.5. Product portfolio
- 9.6. Celgene Corporation
- 9.6.1. Company overview
- 9.6.2. Key Executives
- 9.6.3. Company snapshot
- 9.6.4. Operating business segments
- 9.6.5. Product portfolio
- 9.7. Cellectis
- 9.7.1. Company overview
- 9.7.2. Key Executives
- 9.7.3. Company snapshot
- 9.7.4. Operating business segments
- 9.7.5. Product portfolio
- 9.7.6. Business performance
- 9.7.7. Key strategic moves and developments
- 9.8. Celyad Oncology
- 9.8.1. Company overview
- 9.8.2. Key Executives
- 9.8.3. Company snapshot
- 9.8.4. Operating business segments
- 9.8.5. Product portfolio
- 9.8.6. Key strategic moves and developments
- 9.9. Gilead Sciences, Inc. (Kite Pharma Inc.)
- 9.9.1. Company overview
- 9.9.2. Key Executives
- 9.9.3. Company snapshot
- 9.9.4. Operating business segments
- 9.9.5. Product portfolio
- 9.9.6. Business performance
- 9.9.7. Key strategic moves and developments
- 9.10. Intellia Therapeutics
- 9.10.1. Company overview
- 9.10.2. Key Executives
- 9.10.3. Company snapshot
- 9.10.4. Operating business segments
- 9.10.5. Product portfolio
- 9.11. Juno Therapeutics, Inc.
- 9.11.1. Company overview
- 9.11.2. Key Executives
- 9.11.3. Company snapshot
- 9.11.4. Operating business segments
- 9.11.5. Product portfolio
- 9.12. Merck & Co., Inc.
- 9.12.1. Company overview
- 9.12.2. Key Executives
- 9.12.3. Company snapshot
- 9.12.4. Operating business segments
- 9.12.5. Product portfolio
- 9.12.6. Business performance
- 9.13. Miltenyi Biotech
- 9.13.1. Company overview
- 9.13.2. Key Executives
- 9.13.3. Company snapshot
- 9.13.4. Operating business segments
- 9.13.5. Product portfolio
- 9.14. Novartis AG
- 9.14.1. Company overview
- 9.14.2. Key Executives
- 9.14.3. Company snapshot
- 9.14.4. Operating business segments
- 9.14.5. Product portfolio
- 9.14.6. Business performance
- 9.15. Pfizer, Inc.
- 9.15.1. Company overview
- 9.15.2. Key Executives
- 9.15.3. Company snapshot
- 9.15.4. Operating business segments
- 9.15.5. Product portfolio
- 9.15.6. Business performance
- 9.16. Sorrento Therapeutics, Inc.
- 9.16.1. Company overview
- 9.16.2. Key Executives
- 9.16.3. Company snapshot
- 9.16.4. Operating business segments
- 9.16.5. Product portfolio
- 9.16.6. Business performance
LIST OF TABLES
- TABLE 01. GLOBAL CAR T-CELL THERAPY MARKET, BY DRUG TYPE, 2021-2031 ($MILLION)
- TABLE 02. CAR T-CELL THERAPY MARKET FOR AXICABTAGENE CILOLEUCEL, BY REGION, 2021-2031 ($MILLION)
- TABLE 03. CAR T-CELL THERAPY MARKET FOR TISAGENLECLEUCEL, BY REGION, 2021-2031 ($MILLION)
- TABLE 04. CAR T-CELL THERAPY MARKET FOR BREXUCABTAGENE AUTOLEUCEL, BY REGION, 2021-2031 ($MILLION)
- TABLE 05. CAR T-CELL THERAPY MARKET FOR OTHERS, BY REGION, 2021-2031 ($MILLION)
- TABLE 06. GLOBAL CAR T-CELL THERAPY MARKET, BY INDICATION, 2021-2031 ($MILLION)
- TABLE 07. CAR T-CELL THERAPY MARKET FOR LYMPHOMA, BY REGION, 2021-2031 ($MILLION)
- TABLE 08. CAR T-CELL THERAPY MARKET FOR ACUTE LYMPHOCYTIC LEUKEMIA, BY REGION, 2021-2031 ($MILLION)
- TABLE 09. CAR T-CELL THERAPY MARKET FOR OTHERS, BY REGION, 2021-2031 ($MILLION)
- TABLE 10. GLOBAL CAR T-CELL THERAPY MARKET, BY END USER, 2021-2031 ($MILLION)
- TABLE 11. CAR T-CELL THERAPY MARKET FOR HOSPITALS, BY REGION, 2021-2031 ($MILLION)
- TABLE 12. CAR T-CELL THERAPY MARKET FOR CANCER TREATMENT CENTERS, BY REGION, 2021-2031 ($MILLION)
- TABLE 13. CAR T-CELL THERAPY MARKET, BY REGION, 2021-2031 ($MILLION)
- TABLE 14. NORTH AMERICA CAR T-CELL THERAPY MARKET, BY DRUG TYPE, 2021-2031 ($MILLION)
- TABLE 15. NORTH AMERICA CAR T-CELL THERAPY MARKET, BY INDICATION, 2021-2031 ($MILLION)
- TABLE 16. NORTH AMERICA CAR T-CELL THERAPY MARKET, BY END USER, 2021-2031 ($MILLION)
- TABLE 17. NORTH AMERICA CAR T-CELL THERAPY MARKET, BY COUNTRY, 2021-2031 ($MILLION)
- TABLE 18. U.S. CAR T-CELL THERAPY MARKET, BY DRUG TYPE, 2021-2031 ($MILLION)
- TABLE 19. U.S. CAR T-CELL THERAPY MARKET, BY INDICATION, 2021-2031 ($MILLION)
- TABLE 20. U.S. CAR T-CELL THERAPY MARKET, BY END USER, 2021-2031 ($MILLION)
- TABLE 21. CANADA CAR T-CELL THERAPY MARKET, BY DRUG TYPE, 2021-2031 ($MILLION)
- TABLE 22. CANADA CAR T-CELL THERAPY MARKET, BY INDICATION, 2021-2031 ($MILLION)
- TABLE 23. CANADA CAR T-CELL THERAPY MARKET, BY END USER, 2021-2031 ($MILLION)
- TABLE 24. EUROPE CAR T-CELL THERAPY MARKET, BY DRUG TYPE, 2021-2031 ($MILLION)
- TABLE 25. EUROPE CAR T-CELL THERAPY MARKET, BY INDICATION, 2021-2031 ($MILLION)
- TABLE 26. EUROPE CAR T-CELL THERAPY MARKET, BY END USER, 2021-2031 ($MILLION)
- TABLE 27. EUROPE CAR T-CELL THERAPY MARKET, BY COUNTRY, 2021-2031 ($MILLION)
- TABLE 28. GERMANY CAR T-CELL THERAPY MARKET, BY DRUG TYPE, 2021-2031 ($MILLION)
- TABLE 29. GERMANY CAR T-CELL THERAPY MARKET, BY INDICATION, 2021-2031 ($MILLION)
- TABLE 30. GERMANY CAR T-CELL THERAPY MARKET, BY END USER, 2021-2031 ($MILLION)
- TABLE 31. FRANCE CAR T-CELL THERAPY MARKET, BY DRUG TYPE, 2021-2031 ($MILLION)
- TABLE 32. FRANCE CAR T-CELL THERAPY MARKET, BY INDICATION, 2021-2031 ($MILLION)
- TABLE 33. FRANCE CAR T-CELL THERAPY MARKET, BY END USER, 2021-2031 ($MILLION)
- TABLE 34. U.K. CAR T-CELL THERAPY MARKET, BY DRUG TYPE, 2021-2031 ($MILLION)
- TABLE 35. U.K. CAR T-CELL THERAPY MARKET, BY INDICATION, 2021-2031 ($MILLION)
- TABLE 36. U.K. CAR T-CELL THERAPY MARKET, BY END USER, 2021-2031 ($MILLION)
- TABLE 37. REST OF EUROPE CAR T-CELL THERAPY MARKET, BY DRUG TYPE, 2021-2031 ($MILLION)
- TABLE 38. REST OF EUROPE CAR T-CELL THERAPY MARKET, BY INDICATION, 2021-2031 ($MILLION)
- TABLE 39. REST OF EUROPE CAR T-CELL THERAPY MARKET, BY END USER, 2021-2031 ($MILLION)
- TABLE 40. ASIA-PACIFIC CAR T-CELL THERAPY MARKET, BY DRUG TYPE, 2021-2031 ($MILLION)
- TABLE 41. ASIA-PACIFIC CAR T-CELL THERAPY MARKET, BY INDICATION, 2021-2031 ($MILLION)
- TABLE 42. ASIA-PACIFIC CAR T-CELL THERAPY MARKET, BY END USER, 2021-2031 ($MILLION)
- TABLE 43. ASIA-PACIFIC CAR T-CELL THERAPY MARKET, BY COUNTRY, 2021-2031 ($MILLION)
- TABLE 44. JAPAN CAR T-CELL THERAPY MARKET, BY DRUG TYPE, 2021-2031 ($MILLION)
- TABLE 45. JAPAN CAR T-CELL THERAPY MARKET, BY INDICATION, 2021-2031 ($MILLION)
- TABLE 46. JAPAN CAR T-CELL THERAPY MARKET, BY END USER, 2021-2031 ($MILLION)
- TABLE 47. CHINA CAR T-CELL THERAPY MARKET, BY DRUG TYPE, 2021-2031 ($MILLION)
- TABLE 48. CHINA CAR T-CELL THERAPY MARKET, BY INDICATION, 2021-2031 ($MILLION)
- TABLE 49. CHINA CAR T-CELL THERAPY MARKET, BY END USER, 2021-2031 ($MILLION)
- TABLE 50. REST OF ASIA-PACIFIC CAR T-CELL THERAPY MARKET, BY DRUG TYPE, 2021-2031 ($MILLION)
- TABLE 51. REST OF ASIA-PACIFIC CAR T-CELL THERAPY MARKET, BY INDICATION, 2021-2031 ($MILLION)
- TABLE 52. REST OF ASIA-PACIFIC CAR T-CELL THERAPY MARKET, BY END USER, 2021-2031 ($MILLION)
- TABLE 53. LAMEA CAR T-CELL THERAPY MARKET, BY DRUG TYPE, 2021-2031 ($MILLION)
- TABLE 54. LAMEA CAR T-CELL THERAPY MARKET, BY INDICATION, 2021-2031 ($MILLION)
- TABLE 55. LAMEA CAR T-CELL THERAPY MARKET, BY END USER, 2021-2031 ($MILLION)
- TABLE 56. LAMEA CAR T-CELL THERAPY MARKET, BY COUNTRY, 2021-2031 ($MILLION)
- TABLE 57. LATIN AMERICA CAR T-CELL THERAPY MARKET, BY DRUG TYPE, 2021-2031 ($MILLION)
- TABLE 58. LATIN AMERICA CAR T-CELL THERAPY MARKET, BY INDICATION, 2021-2031 ($MILLION)
- TABLE 59. LATIN AMERICA CAR T-CELL THERAPY MARKET, BY END USER, 2021-2031 ($MILLION)
- TABLE 60. MIDDLE EAST AND AFRICA CAR T-CELL THERAPY MARKET, BY DRUG TYPE, 2021-2031 ($MILLION)
- TABLE 61. MIDDLE EAST AND AFRICA CAR T-CELL THERAPY MARKET, BY INDICATION, 2021-2031 ($MILLION)
- TABLE 62. MIDDLE EAST AND AFRICA CAR T-CELL THERAPY MARKET, BY END USER, 2021-2031 ($MILLION)
- TABLE 63. AUTOLUS THERAPEUTICS: KEY EXECUTIVES
- TABLE 64. AUTOLUS THERAPEUTICS: COMPANY SNAPSHOT
- TABLE 65. AUTOLUS THERAPEUTICS: PRODUCT SEGMENTS
- TABLE 66. AUTOLUS THERAPEUTICS: PRODUCT PORTFOLIO
- TABLE 67. BLUEBIRD BIO, INC.: KEY EXECUTIVES
- TABLE 68. BLUEBIRD BIO, INC.: COMPANY SNAPSHOT
- TABLE 69. BLUEBIRD BIO, INC.: SERVICE SEGMENTS
- TABLE 70. BLUEBIRD BIO, INC.: PRODUCT PORTFOLIO
- TABLE 71. BLUEBIRD BIO, INC.: KEY STRATERGIES
- TABLE 72. BRISTOL-MYERS SQUIBB: KEY EXECUTIVES
- TABLE 73. BRISTOL-MYERS SQUIBB: COMPANY SNAPSHOT
- TABLE 74. BRISTOL-MYERS SQUIBB: PRODUCT SEGMENTS
- TABLE 75. BRISTOL-MYERS SQUIBB: PRODUCT PORTFOLIO
- TABLE 76. BRISTOL-MYERS SQUIBB: KEY STRATERGIES
- TABLE 77. CARIBOU BIOSCIENCES, INC.: KEY EXECUTIVES
- TABLE 78. CARIBOU BIOSCIENCES, INC.: COMPANY SNAPSHOT
- TABLE 79. CARIBOU BIOSCIENCES, INC.: PRODUCT SEGMENTS
- TABLE 80. CARIBOU BIOSCIENCES, INC.: PRODUCT PORTFOLIO
- TABLE 81. CARTESIAN THERAPEUTICS, INC.: KEY EXECUTIVES
- TABLE 82. CARTESIAN THERAPEUTICS, INC.: COMPANY SNAPSHOT
- TABLE 83. CARTESIAN THERAPEUTICS, INC.: PRODUCT SEGMENTS
- TABLE 84. CARTESIAN THERAPEUTICS, INC.: PRODUCT PORTFOLIO
- TABLE 85. CELGENE CORPORATION: KEY EXECUTIVES
- TABLE 86. CELGENE CORPORATION: COMPANY SNAPSHOT
- TABLE 87. CELGENE CORPORATION: PRODUCT SEGMENTS
- TABLE 88. CELGENE CORPORATION: PRODUCT PORTFOLIO
- TABLE 89. CELLECTIS: KEY EXECUTIVES
- TABLE 90. CELLECTIS: COMPANY SNAPSHOT
- TABLE 91. CELLECTIS: PRODUCT SEGMENTS
- TABLE 92. CELLECTIS: PRODUCT PORTFOLIO
- TABLE 93. CELLECTIS: KEY STRATERGIES
- TABLE 94. CELYAD ONCOLOGY: KEY EXECUTIVES
- TABLE 95. CELYAD ONCOLOGY: COMPANY SNAPSHOT
- TABLE 96. CELYAD ONCOLOGY: PRODUCT SEGMENTS
- TABLE 97. CELYAD ONCOLOGY: PRODUCT PORTFOLIO
- TABLE 98. CELYAD ONCOLOGY: KEY STRATERGIES
- TABLE 99. GILEAD SCIENCES, INC. (KITE PHARMA INC.): KEY EXECUTIVES
- TABLE 100. GILEAD SCIENCES, INC. (KITE PHARMA INC.): COMPANY SNAPSHOT
- TABLE 101. GILEAD SCIENCES, INC. (KITE PHARMA INC.): PRODUCT SEGMENTS
- TABLE 102. GILEAD SCIENCES, INC. (KITE PHARMA INC.): PRODUCT PORTFOLIO
- TABLE 103. GILEAD SCIENCES, INC. (KITE PHARMA INC.): KEY STRATERGIES
- TABLE 104. INTELLIA THERAPEUTICS: KEY EXECUTIVES
- TABLE 105. INTELLIA THERAPEUTICS: COMPANY SNAPSHOT
- TABLE 106. INTELLIA THERAPEUTICS: PRODUCT SEGMENTS
- TABLE 107. INTELLIA THERAPEUTICS: PRODUCT PORTFOLIO
- TABLE 108. JUNO THERAPEUTICS, INC.: KEY EXECUTIVES
- TABLE 109. JUNO THERAPEUTICS, INC.: COMPANY SNAPSHOT
- TABLE 110. JUNO THERAPEUTICS, INC.: SERVICE SEGMENTS
- TABLE 111. JUNO THERAPEUTICS, INC.: PRODUCT PORTFOLIO
- TABLE 112. MERCK & CO., INC.: KEY EXECUTIVES
- TABLE 113. MERCK & CO., INC.: COMPANY SNAPSHOT
- TABLE 114. MERCK & CO., INC.: PRODUCT SEGMENTS
- TABLE 115. MERCK & CO., INC.: PRODUCT PORTFOLIO
- TABLE 116. MILTENYI BIOTECH: KEY EXECUTIVES
- TABLE 117. MILTENYI BIOTECH: COMPANY SNAPSHOT
- TABLE 118. MILTENYI BIOTECH: PRODUCT SEGMENTS
- TABLE 119. MILTENYI BIOTECH: PRODUCT PORTFOLIO
- TABLE 120. NOVARTIS AG: KEY EXECUTIVES
- TABLE 121. NOVARTIS AG: COMPANY SNAPSHOT
- TABLE 122. NOVARTIS AG: PRODUCT SEGMENTS
- TABLE 123. NOVARTIS AG: PRODUCT PORTFOLIO
- TABLE 124. PFIZER, INC.: KEY EXECUTIVES
- TABLE 125. PFIZER, INC.: COMPANY SNAPSHOT
- TABLE 126. PFIZER, INC.: PRODUCT SEGMENTS
- TABLE 127. PFIZER, INC.: PRODUCT PORTFOLIO
- TABLE 128. SORRENTO THERAPEUTICS, INC.: KEY EXECUTIVES
- TABLE 129. SORRENTO THERAPEUTICS, INC.: COMPANY SNAPSHOT
- TABLE 130. SORRENTO THERAPEUTICS, INC.: PRODUCT SEGMENTS
- TABLE 131. SORRENTO THERAPEUTICS, INC.: PRODUCT PORTFOLIO
LIST OF FIGURES
- FIGURE 01. CAR T-CELL THERAPY MARKET, 2021-2031
- FIGURE 02. SEGMENTATION OF CAR T-CELL THERAPY MARKET,2021-2031
- FIGURE 03. TOP INVESTMENT POCKETS IN CAR T-CELL THERAPY MARKET (2022-2031)
- FIGURE 04. LOW BARGAINING POWER OF SUPPLIERS
- FIGURE 05. LOW THREAT OF NEW ENTRANTS
- FIGURE 06. LOW THREAT OF SUBSTITUTES
- FIGURE 07. LOW INTENSITY OF RIVALRY
- FIGURE 08. LOW BARGAINING POWER OF BUYERS
- FIGURE 09. GLOBAL CAR T-CELL THERAPY MARKET:DRIVERS, RESTRAINTS AND OPPORTUNITIES
- FIGURE 10. CAR T-CELL THERAPY MARKET, BY DRUG TYPE, 2021(%)
- FIGURE 11. COMPARATIVE SHARE ANALYSIS OF CAR T-CELL THERAPY MARKET FOR AXICABTAGENE CILOLEUCEL, BY COUNTRY 2021 AND 2031(%)
- FIGURE 12. COMPARATIVE SHARE ANALYSIS OF CAR T-CELL THERAPY MARKET FOR TISAGENLECLEUCEL, BY COUNTRY 2021 AND 2031(%)
- FIGURE 13. COMPARATIVE SHARE ANALYSIS OF CAR T-CELL THERAPY MARKET FOR BREXUCABTAGENE AUTOLEUCEL, BY COUNTRY 2021 AND 2031(%)
- FIGURE 14. COMPARATIVE SHARE ANALYSIS OF CAR T-CELL THERAPY MARKET FOR OTHERS, BY COUNTRY 2021 AND 2031(%)
- FIGURE 15. CAR T-CELL THERAPY MARKET, BY INDICATION, 2021(%)
- FIGURE 16. COMPARATIVE SHARE ANALYSIS OF CAR T-CELL THERAPY MARKET FOR LYMPHOMA, BY COUNTRY 2021 AND 2031(%)
- FIGURE 17. COMPARATIVE SHARE ANALYSIS OF CAR T-CELL THERAPY MARKET FOR ACUTE LYMPHOCYTIC LEUKEMIA, BY COUNTRY 2021 AND 2031(%)
- FIGURE 18. COMPARATIVE SHARE ANALYSIS OF CAR T-CELL THERAPY MARKET FOR OTHERS, BY COUNTRY 2021 AND 2031(%)
- FIGURE 19. CAR T-CELL THERAPY MARKET, BY END USER, 2021(%)
- FIGURE 20. COMPARATIVE SHARE ANALYSIS OF CAR T-CELL THERAPY MARKET FOR HOSPITALS, BY COUNTRY 2021 AND 2031(%)
- FIGURE 21. COMPARATIVE SHARE ANALYSIS OF CAR T-CELL THERAPY MARKET FOR CANCER TREATMENT CENTERS, BY COUNTRY 2021 AND 2031(%)
- FIGURE 22. CAR T-CELL THERAPY MARKET BY REGION, 2021(%)
- FIGURE 23. U.S. CAR T-CELL THERAPY MARKET, 2021-2031 ($MILLION)
- FIGURE 24. CANADA CAR T-CELL THERAPY MARKET, 2021-2031 ($MILLION)
- FIGURE 25. GERMANY CAR T-CELL THERAPY MARKET, 2021-2031 ($MILLION)
- FIGURE 26. FRANCE CAR T-CELL THERAPY MARKET, 2021-2031 ($MILLION)
- FIGURE 27. U.K. CAR T-CELL THERAPY MARKET, 2021-2031 ($MILLION)
- FIGURE 28. REST OF EUROPE CAR T-CELL THERAPY MARKET, 2021-2031 ($MILLION)
- FIGURE 29. JAPAN CAR T-CELL THERAPY MARKET, 2021-2031 ($MILLION)
- FIGURE 30. CHINA CAR T-CELL THERAPY MARKET, 2021-2031 ($MILLION)
- FIGURE 31. REST OF ASIA-PACIFIC CAR T-CELL THERAPY MARKET, 2021-2031 ($MILLION)
- FIGURE 32. LATIN AMERICA CAR T-CELL THERAPY MARKET, 2021-2031 ($MILLION)
- FIGURE 33. MIDDLE EAST AND AFRICA CAR T-CELL THERAPY MARKET, 2021-2031 ($MILLION)
- FIGURE 34. TOP WINNING STRATEGIES, BY YEAR
- FIGURE 35. TOP WINNING STRATEGIES, BY DEVELOPMENT
- FIGURE 36. TOP WINNING STRATEGIES, BY COMPANY
- FIGURE 37. PRODUCT MAPPING OF TOP 10 PLAYERS
- FIGURE 38. COMPETITIVE DASHBOARD
- FIGURE 39. COMPETITIVE HEATMAP: CAR T-CELL THERAPY MARKET
- FIGURE 40. TOP PLAYER POSITIONING, 2021
- FIGURE 41. BLUEBIRD BIO, INC.: NET REVENUE, 2021-2022 ($MILLION)
- FIGURE 42. BRISTOL-MYERS SQUIBB: NET REVENUE, 2019-2021 ($MILLION)
- FIGURE 43. CELLECTIS: NET REVENUE, 2019-2021 ($MILLION)
- FIGURE 44. MERCK & CO., INC.: NET SALES, 2020-2022 ($MILLION)
- FIGURE 45. MERCK & CO., INC.: REVENUE SHARE BY SEGMENT, 2022 (%)
- FIGURE 46. MERCK & CO., INC.: REVENUE SHARE BY REGION, 2022 (%)
- FIGURE 47. NOVARTIS AG: NET SALES, 2020-2022 ($MILLION)
- FIGURE 48. NOVARTIS AG: REVENUE SHARE BY SEGMENT, 2022 (%)
- FIGURE 49. NOVARTIS AG: REVENUE SHARE BY REGION, 2022 (%)
- FIGURE 50. PFIZER, INC.: NET REVENUE, 2019-2021 ($MILLION)
- FIGURE 51. PFIZER, INC.: REVENUE SHARE BY REGION, 2021 (%)
- FIGURE 52. SORRENTO THERAPEUTICS, INC.: NET SALES, 2019-2021 ($MILLION)

