
PUBLISHER: Allied Market Research | PRODUCT CODE: 1446884

PUBLISHER: Allied Market Research | PRODUCT CODE: 1446884
Power Grid Market By Component (Power Generation, Transmission Lines, Distribution Networks, Consumer Use), By Energy Source (Solar, Wind, Natural Gas, Coal, Others): Global Opportunity Analysis and Industry Forecast, 2023-2032
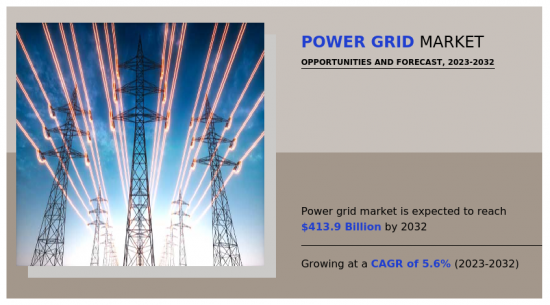
The global power grid market is anticipated to reach $413.9 billion by 2032, growing from $241.6 billion in 2022 at a CAGR of 5.6% from 2023 to 2032. The power grid is a network of power lines and associated infrastructure, serving as the crucial component of the modern electrical system. The power grid facilitates the transmission and distribution of electricity from power plants to residences and businesses, spanning vast geographic areas. Comprising the essential components required for electricity generation, transmission, and distribution, the power grid plays a vital role in ensuring a seamless and continuous supply of electrical power.
The growing inclination towards clean energy transition with rising demand for sustainable energy sources is a major factor driving the growth of the power grid market. This surge is notably driven by global efforts to reduce dependence on fossil fuels, subsequently mitigating greenhouse gas emissions. The advent of renewable energy harnessed through the power grid has not only paved the way for sustainable energy but has also spurred investments in the renewable energy sector. Consequently, a decrease in reliance on imported fossil fuels has been witnessed, contributing to the overall growth of the power grid market.
However, the power grid market faces challenges, primarily due to the aging infrastructure and limited storage capacity. The majority of power grids globally exhibit signs of aging, leading to increased maintenance costs and susceptibility to power failures. In addition, the centralized structure of many power grids can lead to inefficiencies, as electricity often needs to travel long distances from power plants to end-users. Also, different regions or countries may have power grids with varying technical standards, hindering seamless energy exchanges and collaborations. The lack of public awareness regarding energy conservation, smart grid technologies, and the benefits of transitioning to a more sustainable and resilient power grid is anticipated to restrain the power grid market size in the upcoming years.
The electrification of the transportation sector, along with the surging adoption of electric vehicles (EVs) worldwide, presents a significant opportunity for the power grid market. The rise in demand for efficient power grid solutions is driven by the growing network of electric vehicle charging infrastructures. Thus, the growing adoption of EVs is poised to contribute substantially to global electricity consumption, with estimates projecting a significant share of vehicle sales being electric in the upcoming years. For instance, the upward trajectory of electric vehicle sales, accounting for 18% of global vehicle sales in 2023, is indicative of the immense opportunity for the power grid market as it navigates the evolving landscape of the energy and transportation sectors.
The COVID-19 pandemic had significant impacts on the power grid market growth as global supply chains were disrupted. The demand for electricity was reduced owing to the closure of manufacturing units, industrial and commercial sectors. In addition, the fluctuations in energy demand posed challenges to grid stability. Grid operators had to manage rapid changes in supply and demand, requiring increased flexibility in grid management strategies. All these factors led to the negative impact on the power grid industry share during the pandemic.
The key players profiled in this report include Siemens AG, ABB Ltd, General Electric Company, Schneider Electric SE, State Grid Corporation of China, Eaton Corporation, Mitsubishi Electric Corporation, Toshiba Corporation, National Grid plc, and NextEra Energy, Inc. The market players are continuously striving to achieve a dominant position in this competitive market using strategies such as collaborations and acquisitions.
Key Benefits For Stakeholders
- This report provides a quantitative analysis of the market segments, current trends, estimations, and dynamics of the power grid market analysis from 2022 to 2032 to identify the prevailing power grid market opportunities.
- The market research is offered along with information related to key drivers, restraints, and opportunities.
- Porter's five forces analysis highlights the potency of buyers and suppliers to enable stakeholders make profit-oriented business decisions and strengthen their supplier-buyer network.
- In-depth analysis of the power grid market segmentation assists to determine the prevailing market opportunities.
- Major countries in each region are mapped according to their revenue contribution to the global market.
- Market player positioning facilitates benchmarking and provides a clear understanding of the present position of the market players.
- The report includes the analysis of the regional as well as global power grid market trends, key players, market segments, application areas, and market growth strategies.
Additional benefits you will get with this purchase are:
- Quarterly Update and* (only available with a corporate license, on listed price)
- 5 additional Company Profile of client Choice pre- or Post-purchase, as a free update.
- Free Upcoming Version on the Purchase of Five and Enterprise User License.
- 16 analyst hours of support* (post-purchase, if you find additional data requirements upon review of the report, you may receive support amounting to 16 analyst hours to solve questions, and post-sale queries)
- 15% Free Customization* (in case the scope or segment of the report does not match your requirements, 15% is equivalent to 3 working days of free work, applicable once)
- Free data Pack on the Five and Enterprise User License. (Excel version of the report)
- Free Updated report if the report is 6-12 months old or older.
- 24-hour priority response*
- Free Industry updates and white papers.
Possible Customization with this report (with additional cost and timeline, please talk to the sales executive to know more)
- Consumer Buying Behavior Analysis
- Investment Opportunities
- Upcoming/New Entrant by Regions
- Technology Trend Analysis
- New Product Development/ Product Matrix of Key Players
- Pain Point Analysis
- Regulatory Guidelines
- Strategic Recommedations
- Additional company profiles with specific to client's interest
- Additional country or region analysis- market size and forecast
- Brands Share Analysis
- Criss-cross segment analysis- market size and forecast
- Expanded list for Company Profiles
- Historic market data
- Market share analysis of players at global/region/country level
- SWOT Analysis
Key Market Segments
By Component
- Power Generation
- Transmission Lines
- Distribution Networks
- Consumer Use
By Energy Source
- Solar
- Wind
- Natural Gas
- Coal
- Others
By Region
- North America
- U.S.
- Canada
- Mexico
- Europe
- Germany
- UK
- France
- Italy
- Spain
- Rest of Europe
- Asia-Pacific
- China
- Japan
- India
- South Korea
- Australia
- Rest of Asia-Pacific
- LAMEA
- Brazil
- United Arab Emirates
- Saudi Arabia
- South Africa
- Rest of LAMEA
Key Market Players:
- Siemens AG
- ABB Ltd.
- General Electric Company
- Schneider Electric SE
- State Grid Corporation of China
- Eaton Corporation
- Mitsubishi Electric Corporation
- Toshiba Corporation
- National Grid plc
- NextEra Energy, Inc.
TABLE OF CONTENTS
CHAPTER 1: INTRODUCTION
- 1.1. Report description
- 1.2. Key market segments
- 1.3. Key benefits to the stakeholders
- 1.4. Research methodology
- 1.4.1. Primary research
- 1.4.2. Secondary research
- 1.4.3. Analyst tools and models
CHAPTER 2: EXECUTIVE SUMMARY
- 2.1. CXO Perspective
CHAPTER 3: MARKET OVERVIEW
- 3.1. Market definition and scope
- 3.2. Key findings
- 3.2.1. Top impacting factors
- 3.2.2. Top investment pockets
- 3.3. Porter's five forces analysis
- 3.4. Market dynamics
- 3.4.1. Drivers
- 3.4.2. Restraints
- 3.4.3. Opportunities
- 3.5. Market Share Analysis
- 3.6. Value Chain Analysis
- 3.7. Regulatory Guidelines
- 3.8. Key Regulation Analysis
- 3.9. Patent Landscape
CHAPTER 4: POWER GRID MARKET, BY COMPONENT
- 4.1. Overview
- 4.1.1. Market size and forecast
- 4.2. Power Generation
- 4.2.1. Key market trends, growth factors and opportunities
- 4.2.2. Market size and forecast, by region
- 4.2.3. Market share analysis by country
- 4.3. Transmission Lines
- 4.3.1. Key market trends, growth factors and opportunities
- 4.3.2. Market size and forecast, by region
- 4.3.3. Market share analysis by country
- 4.4. Distribution Networks
- 4.4.1. Key market trends, growth factors and opportunities
- 4.4.2. Market size and forecast, by region
- 4.4.3. Market share analysis by country
- 4.5. Consumer Use
- 4.5.1. Key market trends, growth factors and opportunities
- 4.5.2. Market size and forecast, by region
- 4.5.3. Market share analysis by country
CHAPTER 5: POWER GRID MARKET, BY ENERGY SOURCE
- 5.1. Overview
- 5.1.1. Market size and forecast
- 5.2. Solar
- 5.2.1. Key market trends, growth factors and opportunities
- 5.2.2. Market size and forecast, by region
- 5.2.3. Market share analysis by country
- 5.3. Wind
- 5.3.1. Key market trends, growth factors and opportunities
- 5.3.2. Market size and forecast, by region
- 5.3.3. Market share analysis by country
- 5.4. Natural Gas
- 5.4.1. Key market trends, growth factors and opportunities
- 5.4.2. Market size and forecast, by region
- 5.4.3. Market share analysis by country
- 5.5. Coal
- 5.5.1. Key market trends, growth factors and opportunities
- 5.5.2. Market size and forecast, by region
- 5.5.3. Market share analysis by country
- 5.6. Others
- 5.6.1. Key market trends, growth factors and opportunities
- 5.6.2. Market size and forecast, by region
- 5.6.3. Market share analysis by country
CHAPTER 6: POWER GRID MARKET, BY REGION
- 6.1. Overview
- 6.1.1. Market size and forecast By Region
- 6.2. North America
- 6.2.1. Key market trends, growth factors and opportunities
- 6.2.2. Market size and forecast, by Component
- 6.2.3. Market size and forecast, by Energy Source
- 6.2.4. Market size and forecast, by country
- 6.2.4.1. U.S.
- 6.2.4.1.1. Market size and forecast, by Component
- 6.2.4.1.2. Market size and forecast, by Energy Source
- 6.2.4.2. Canada
- 6.2.4.2.1. Market size and forecast, by Component
- 6.2.4.2.2. Market size and forecast, by Energy Source
- 6.2.4.3. Mexico
- 6.2.4.3.1. Market size and forecast, by Component
- 6.2.4.3.2. Market size and forecast, by Energy Source
- 6.3. Europe
- 6.3.1. Key market trends, growth factors and opportunities
- 6.3.2. Market size and forecast, by Component
- 6.3.3. Market size and forecast, by Energy Source
- 6.3.4. Market size and forecast, by country
- 6.3.4.1. Germany
- 6.3.4.1.1. Market size and forecast, by Component
- 6.3.4.1.2. Market size and forecast, by Energy Source
- 6.3.4.2. UK
- 6.3.4.2.1. Market size and forecast, by Component
- 6.3.4.2.2. Market size and forecast, by Energy Source
- 6.3.4.3. France
- 6.3.4.3.1. Market size and forecast, by Component
- 6.3.4.3.2. Market size and forecast, by Energy Source
- 6.3.4.4. Italy
- 6.3.4.4.1. Market size and forecast, by Component
- 6.3.4.4.2. Market size and forecast, by Energy Source
- 6.3.4.5. Spain
- 6.3.4.5.1. Market size and forecast, by Component
- 6.3.4.5.2. Market size and forecast, by Energy Source
- 6.3.4.6. Rest of Europe
- 6.3.4.6.1. Market size and forecast, by Component
- 6.3.4.6.2. Market size and forecast, by Energy Source
- 6.4. Asia-Pacific
- 6.4.1. Key market trends, growth factors and opportunities
- 6.4.2. Market size and forecast, by Component
- 6.4.3. Market size and forecast, by Energy Source
- 6.4.4. Market size and forecast, by country
- 6.4.4.1. China
- 6.4.4.1.1. Market size and forecast, by Component
- 6.4.4.1.2. Market size and forecast, by Energy Source
- 6.4.4.2. Japan
- 6.4.4.2.1. Market size and forecast, by Component
- 6.4.4.2.2. Market size and forecast, by Energy Source
- 6.4.4.3. India
- 6.4.4.3.1. Market size and forecast, by Component
- 6.4.4.3.2. Market size and forecast, by Energy Source
- 6.4.4.4. South Korea
- 6.4.4.4.1. Market size and forecast, by Component
- 6.4.4.4.2. Market size and forecast, by Energy Source
- 6.4.4.5. Australia
- 6.4.4.5.1. Market size and forecast, by Component
- 6.4.4.5.2. Market size and forecast, by Energy Source
- 6.4.4.6. Rest of Asia-Pacific
- 6.4.4.6.1. Market size and forecast, by Component
- 6.4.4.6.2. Market size and forecast, by Energy Source
- 6.5. LAMEA
- 6.5.1. Key market trends, growth factors and opportunities
- 6.5.2. Market size and forecast, by Component
- 6.5.3. Market size and forecast, by Energy Source
- 6.5.4. Market size and forecast, by country
- 6.5.4.1. Brazil
- 6.5.4.1.1. Market size and forecast, by Component
- 6.5.4.1.2. Market size and forecast, by Energy Source
- 6.5.4.2. United Arab Emirates
- 6.5.4.2.1. Market size and forecast, by Component
- 6.5.4.2.2. Market size and forecast, by Energy Source
- 6.5.4.3. Saudi Arabia
- 6.5.4.3.1. Market size and forecast, by Component
- 6.5.4.3.2. Market size and forecast, by Energy Source
- 6.5.4.4. South Africa
- 6.5.4.4.1. Market size and forecast, by Component
- 6.5.4.4.2. Market size and forecast, by Energy Source
- 6.5.4.5. Rest of LAMEA
- 6.5.4.5.1. Market size and forecast, by Component
- 6.5.4.5.2. Market size and forecast, by Energy Source
CHAPTER 7: COMPETITIVE LANDSCAPE
- 7.1. Introduction
- 7.2. Top winning strategies
- 7.3. Product mapping of top 10 player
- 7.4. Competitive dashboard
- 7.5. Competitive heatmap
- 7.6. Top player positioning, 2022
CHAPTER 8: COMPANY PROFILES
- 8.1. Siemens AG
- 8.1.1. Company overview
- 8.1.2. Key executives
- 8.1.3. Company snapshot
- 8.2. ABB Ltd.
- 8.2.1. Company overview
- 8.2.2. Key executives
- 8.2.3. Company snapshot
- 8.3. General Electric Company
- 8.3.1. Company overview
- 8.3.2. Key executives
- 8.3.3. Company snapshot
- 8.4. Schneider Electric SE
- 8.4.1. Company overview
- 8.4.2. Key executives
- 8.4.3. Company snapshot
- 8.5. State Grid Corporation of China
- 8.5.1. Company overview
- 8.5.2. Key executives
- 8.5.3. Company snapshot
- 8.6. Eaton Corporation
- 8.6.1. Company overview
- 8.6.2. Key executives
- 8.6.3. Company snapshot
- 8.7. Mitsubishi Electric Corporation
- 8.7.1. Company overview
- 8.7.2. Key executives
- 8.7.3. Company snapshot
- 8.8. Toshiba Corporation
- 8.8.1. Company overview
- 8.8.2. Key executives
- 8.8.3. Company snapshot
- 8.9. National Grid plc
- 8.9.1. Company overview
- 8.9.2. Key executives
- 8.9.3. Company snapshot
- 8.10. NextEra Energy, Inc.
- 8.10.1. Company overview
- 8.10.2. Key executives
- 8.10.3. Company snapshot
LIST OF TABLES
- TABLE 01. GLOBAL POWER GRID MARKET, BY COMPONENT, 2022-2032 ($BILLION)
- TABLE 02. POWER GRID MARKET FOR POWER GENERATION, BY REGION, 2022-2032 ($BILLION)
- TABLE 03. POWER GRID MARKET FOR TRANSMISSION LINES, BY REGION, 2022-2032 ($BILLION)
- TABLE 04. POWER GRID MARKET FOR DISTRIBUTION NETWORKS, BY REGION, 2022-2032 ($BILLION)
- TABLE 05. POWER GRID MARKET FOR CONSUMER USE, BY REGION, 2022-2032 ($BILLION)
- TABLE 06. GLOBAL POWER GRID MARKET, BY ENERGY SOURCE, 2022-2032 ($BILLION)
- TABLE 07. POWER GRID MARKET FOR SOLAR, BY REGION, 2022-2032 ($BILLION)
- TABLE 08. POWER GRID MARKET FOR WIND, BY REGION, 2022-2032 ($BILLION)
- TABLE 09. POWER GRID MARKET FOR NATURAL GAS, BY REGION, 2022-2032 ($BILLION)
- TABLE 10. POWER GRID MARKET FOR COAL, BY REGION, 2022-2032 ($BILLION)
- TABLE 11. POWER GRID MARKET FOR OTHERS, BY REGION, 2022-2032 ($BILLION)
- TABLE 12. POWER GRID MARKET, BY REGION, 2022-2032 ($BILLION)
- TABLE 13. NORTH AMERICA POWER GRID MARKET, BY COMPONENT, 2022-2032 ($BILLION)
- TABLE 14. NORTH AMERICA POWER GRID MARKET, BY ENERGY SOURCE, 2022-2032 ($BILLION)
- TABLE 15. NORTH AMERICA POWER GRID MARKET, BY COUNTRY, 2022-2032 ($BILLION)
- TABLE 16. U.S. POWER GRID MARKET, BY COMPONENT, 2022-2032 ($BILLION)
- TABLE 17. U.S. POWER GRID MARKET, BY ENERGY SOURCE, 2022-2032 ($BILLION)
- TABLE 18. CANADA POWER GRID MARKET, BY COMPONENT, 2022-2032 ($BILLION)
- TABLE 19. CANADA POWER GRID MARKET, BY ENERGY SOURCE, 2022-2032 ($BILLION)
- TABLE 20. MEXICO POWER GRID MARKET, BY COMPONENT, 2022-2032 ($BILLION)
- TABLE 21. MEXICO POWER GRID MARKET, BY ENERGY SOURCE, 2022-2032 ($BILLION)
- TABLE 22. EUROPE POWER GRID MARKET, BY COMPONENT, 2022-2032 ($BILLION)
- TABLE 23. EUROPE POWER GRID MARKET, BY ENERGY SOURCE, 2022-2032 ($BILLION)
- TABLE 24. EUROPE POWER GRID MARKET, BY COUNTRY, 2022-2032 ($BILLION)
- TABLE 25. GERMANY POWER GRID MARKET, BY COMPONENT, 2022-2032 ($BILLION)
- TABLE 26. GERMANY POWER GRID MARKET, BY ENERGY SOURCE, 2022-2032 ($BILLION)
- TABLE 27. UK POWER GRID MARKET, BY COMPONENT, 2022-2032 ($BILLION)
- TABLE 28. UK POWER GRID MARKET, BY ENERGY SOURCE, 2022-2032 ($BILLION)
- TABLE 29. FRANCE POWER GRID MARKET, BY COMPONENT, 2022-2032 ($BILLION)
- TABLE 30. FRANCE POWER GRID MARKET, BY ENERGY SOURCE, 2022-2032 ($BILLION)
- TABLE 31. ITALY POWER GRID MARKET, BY COMPONENT, 2022-2032 ($BILLION)
- TABLE 32. ITALY POWER GRID MARKET, BY ENERGY SOURCE, 2022-2032 ($BILLION)
- TABLE 33. SPAIN POWER GRID MARKET, BY COMPONENT, 2022-2032 ($BILLION)
- TABLE 34. SPAIN POWER GRID MARKET, BY ENERGY SOURCE, 2022-2032 ($BILLION)
- TABLE 35. REST OF EUROPE POWER GRID MARKET, BY COMPONENT, 2022-2032 ($BILLION)
- TABLE 36. REST OF EUROPE POWER GRID MARKET, BY ENERGY SOURCE, 2022-2032 ($BILLION)
- TABLE 37. ASIA-PACIFIC POWER GRID MARKET, BY COMPONENT, 2022-2032 ($BILLION)
- TABLE 38. ASIA-PACIFIC POWER GRID MARKET, BY ENERGY SOURCE, 2022-2032 ($BILLION)
- TABLE 39. ASIA-PACIFIC POWER GRID MARKET, BY COUNTRY, 2022-2032 ($BILLION)
- TABLE 40. CHINA POWER GRID MARKET, BY COMPONENT, 2022-2032 ($BILLION)
- TABLE 41. CHINA POWER GRID MARKET, BY ENERGY SOURCE, 2022-2032 ($BILLION)
- TABLE 42. JAPAN POWER GRID MARKET, BY COMPONENT, 2022-2032 ($BILLION)
- TABLE 43. JAPAN POWER GRID MARKET, BY ENERGY SOURCE, 2022-2032 ($BILLION)
- TABLE 44. INDIA POWER GRID MARKET, BY COMPONENT, 2022-2032 ($BILLION)
- TABLE 45. INDIA POWER GRID MARKET, BY ENERGY SOURCE, 2022-2032 ($BILLION)
- TABLE 46. SOUTH KOREA POWER GRID MARKET, BY COMPONENT, 2022-2032 ($BILLION)
- TABLE 47. SOUTH KOREA POWER GRID MARKET, BY ENERGY SOURCE, 2022-2032 ($BILLION)
- TABLE 48. AUSTRALIA POWER GRID MARKET, BY COMPONENT, 2022-2032 ($BILLION)
- TABLE 49. AUSTRALIA POWER GRID MARKET, BY ENERGY SOURCE, 2022-2032 ($BILLION)
- TABLE 50. REST OF ASIA-PACIFIC POWER GRID MARKET, BY COMPONENT, 2022-2032 ($BILLION)
- TABLE 51. REST OF ASIA-PACIFIC POWER GRID MARKET, BY ENERGY SOURCE, 2022-2032 ($BILLION)
- TABLE 52. LAMEA POWER GRID MARKET, BY COMPONENT, 2022-2032 ($BILLION)
- TABLE 53. LAMEA POWER GRID MARKET, BY ENERGY SOURCE, 2022-2032 ($BILLION)
- TABLE 54. LAMEA POWER GRID MARKET, BY COUNTRY, 2022-2032 ($BILLION)
- TABLE 55. BRAZIL POWER GRID MARKET, BY COMPONENT, 2022-2032 ($BILLION)
- TABLE 56. BRAZIL POWER GRID MARKET, BY ENERGY SOURCE, 2022-2032 ($BILLION)
- TABLE 57. UNITED ARAB EMIRATES POWER GRID MARKET, BY COMPONENT, 2022-2032 ($BILLION)
- TABLE 58. UNITED ARAB EMIRATES POWER GRID MARKET, BY ENERGY SOURCE, 2022-2032 ($BILLION)
- TABLE 59. SAUDI ARABIA POWER GRID MARKET, BY COMPONENT, 2022-2032 ($BILLION)
- TABLE 60. SAUDI ARABIA POWER GRID MARKET, BY ENERGY SOURCE, 2022-2032 ($BILLION)
- TABLE 61. SOUTH AFRICA POWER GRID MARKET, BY COMPONENT, 2022-2032 ($BILLION)
- TABLE 62. SOUTH AFRICA POWER GRID MARKET, BY ENERGY SOURCE, 2022-2032 ($BILLION)
- TABLE 63. REST OF LAMEA POWER GRID MARKET, BY COMPONENT, 2022-2032 ($BILLION)
- TABLE 64. REST OF LAMEA POWER GRID MARKET, BY ENERGY SOURCE, 2022-2032 ($BILLION)
- TABLE 65. SIEMENS AG: KEY EXECUTIVES
- TABLE 66. SIEMENS AG: COMPANY SNAPSHOT
- TABLE 67. ABB LTD.: KEY EXECUTIVES
- TABLE 68. ABB LTD.: COMPANY SNAPSHOT
- TABLE 69. GENERAL ELECTRIC COMPANY: KEY EXECUTIVES
- TABLE 70. GENERAL ELECTRIC COMPANY: COMPANY SNAPSHOT
- TABLE 71. SCHNEIDER ELECTRIC SE: KEY EXECUTIVES
- TABLE 72. SCHNEIDER ELECTRIC SE: COMPANY SNAPSHOT
- TABLE 73. STATE GRID CORPORATION OF CHINA: KEY EXECUTIVES
- TABLE 74. STATE GRID CORPORATION OF CHINA: COMPANY SNAPSHOT
- TABLE 75. EATON CORPORATION: KEY EXECUTIVES
- TABLE 76. EATON CORPORATION: COMPANY SNAPSHOT
- TABLE 77. MITSUBISHI ELECTRIC CORPORATION: KEY EXECUTIVES
- TABLE 78. MITSUBISHI ELECTRIC CORPORATION: COMPANY SNAPSHOT
- TABLE 79. TOSHIBA CORPORATION: KEY EXECUTIVES
- TABLE 80. TOSHIBA CORPORATION: COMPANY SNAPSHOT
- TABLE 81. NATIONAL GRID PLC: KEY EXECUTIVES
- TABLE 82. NATIONAL GRID PLC: COMPANY SNAPSHOT
- TABLE 83. NEXTERA ENERGY, INC.: KEY EXECUTIVES
- TABLE 84. NEXTERA ENERGY, INC.: COMPANY SNAPSHOT
LIST OF FIGURES
- FIGURE 01. POWER GRID MARKET, 2022-2032
- FIGURE 02. SEGMENTATION OF POWER GRID MARKET,2022-2032
- FIGURE 03. TOP IMPACTING FACTORS IN POWER GRID MARKET
- FIGURE 04. TOP INVESTMENT POCKETS IN POWER GRID MARKET (2023-2032)
- FIGURE 05. BARGAINING POWER OF SUPPLIERS
- FIGURE 06. BARGAINING POWER OF BUYERS
- FIGURE 07. THREAT OF SUBSTITUTION
- FIGURE 08. THREAT OF SUBSTITUTION
- FIGURE 09. COMPETITIVE RIVALRY
- FIGURE 10. GLOBAL POWER GRID MARKET:DRIVERS, RESTRAINTS AND OPPORTUNITIES
- FIGURE 11. REGULATORY GUIDELINES: POWER GRID MARKET
- FIGURE 12. IMPACT OF KEY REGULATION: POWER GRID MARKET
- FIGURE 13. PATENT ANALYSIS BY COMPANY
- FIGURE 14. PATENT ANALYSIS BY COUNTRY
- FIGURE 15. POWER GRID MARKET, BY COMPONENT, 2022 AND 2032(%)
- FIGURE 16. COMPARATIVE SHARE ANALYSIS OF POWER GRID MARKET FOR POWER GENERATION, BY COUNTRY 2022 AND 2032(%)
- FIGURE 17. COMPARATIVE SHARE ANALYSIS OF POWER GRID MARKET FOR TRANSMISSION LINES, BY COUNTRY 2022 AND 2032(%)
- FIGURE 18. COMPARATIVE SHARE ANALYSIS OF POWER GRID MARKET FOR DISTRIBUTION NETWORKS, BY COUNTRY 2022 AND 2032(%)
- FIGURE 19. COMPARATIVE SHARE ANALYSIS OF POWER GRID MARKET FOR CONSUMER USE, BY COUNTRY 2022 AND 2032(%)
- FIGURE 20. POWER GRID MARKET, BY ENERGY SOURCE, 2022 AND 2032(%)
- FIGURE 21. COMPARATIVE SHARE ANALYSIS OF POWER GRID MARKET FOR SOLAR, BY COUNTRY 2022 AND 2032(%)
- FIGURE 22. COMPARATIVE SHARE ANALYSIS OF POWER GRID MARKET FOR WIND, BY COUNTRY 2022 AND 2032(%)
- FIGURE 23. COMPARATIVE SHARE ANALYSIS OF POWER GRID MARKET FOR NATURAL GAS, BY COUNTRY 2022 AND 2032(%)
- FIGURE 24. COMPARATIVE SHARE ANALYSIS OF POWER GRID MARKET FOR COAL, BY COUNTRY 2022 AND 2032(%)
- FIGURE 25. COMPARATIVE SHARE ANALYSIS OF POWER GRID MARKET FOR OTHERS, BY COUNTRY 2022 AND 2032(%)
- FIGURE 26. POWER GRID MARKET BY REGION, 2022 AND 2032(%)
- FIGURE 27. U.S. POWER GRID MARKET, 2022-2032 ($BILLION)
- FIGURE 28. CANADA POWER GRID MARKET, 2022-2032 ($BILLION)
- FIGURE 29. MEXICO POWER GRID MARKET, 2022-2032 ($BILLION)
- FIGURE 30. GERMANY POWER GRID MARKET, 2022-2032 ($BILLION)
- FIGURE 31. UK POWER GRID MARKET, 2022-2032 ($BILLION)
- FIGURE 32. FRANCE POWER GRID MARKET, 2022-2032 ($BILLION)
- FIGURE 33. ITALY POWER GRID MARKET, 2022-2032 ($BILLION)
- FIGURE 34. SPAIN POWER GRID MARKET, 2022-2032 ($BILLION)
- FIGURE 35. REST OF EUROPE POWER GRID MARKET, 2022-2032 ($BILLION)
- FIGURE 36. CHINA POWER GRID MARKET, 2022-2032 ($BILLION)
- FIGURE 37. JAPAN POWER GRID MARKET, 2022-2032 ($BILLION)
- FIGURE 38. INDIA POWER GRID MARKET, 2022-2032 ($BILLION)
- FIGURE 39. SOUTH KOREA POWER GRID MARKET, 2022-2032 ($BILLION)
- FIGURE 40. AUSTRALIA POWER GRID MARKET, 2022-2032 ($BILLION)
- FIGURE 41. REST OF ASIA-PACIFIC POWER GRID MARKET, 2022-2032 ($BILLION)
- FIGURE 42. BRAZIL POWER GRID MARKET, 2022-2032 ($BILLION)
- FIGURE 43. UNITED ARAB EMIRATES POWER GRID MARKET, 2022-2032 ($BILLION)
- FIGURE 44. SAUDI ARABIA POWER GRID MARKET, 2022-2032 ($BILLION)
- FIGURE 45. SOUTH AFRICA POWER GRID MARKET, 2022-2032 ($BILLION)
- FIGURE 46. REST OF LAMEA POWER GRID MARKET, 2022-2032 ($BILLION)
- FIGURE 47. PRODUCT MAPPING OF TOP 10 PLAYERS
- FIGURE 48. COMPETITIVE DASHBOARD
- FIGURE 49. COMPETITIVE HEATMAP: POWER GRID MARKET
- FIGURE 50. TOP PLAYER POSITIONING, 2022

