
PUBLISHER: Allied Market Research | PRODUCT CODE: 1446892

PUBLISHER: Allied Market Research | PRODUCT CODE: 1446892
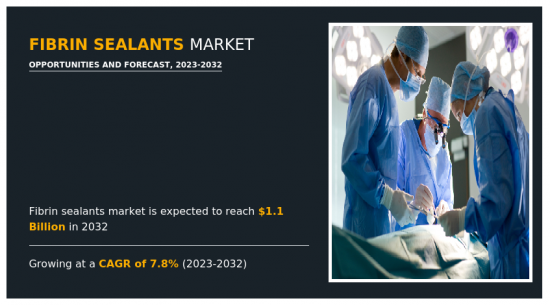
Fibrin Sealants Market By Dosage Forms, By Application, By End User : Global Opportunity Analysis and Industry Forecast, 2023-2032
The Fibrin Sealants Market was valued for $550.00 million in 2022 and is estimated to reach $1,136.50 million by 2032, exhibiting a CAGR of 7.8% from 2023 to 2032. Fibrin sealants are used in a wide range of surgeries, primarily as hemostatic agents, however, also to assist tissue sealing and wound healing. Fibrin sealants are used during surgeries to avoid surgical complications such as air and fluid leaks. These sealants are available in the form of films, powder, and liquid, and aid by creating a hemostatic layer, which stops blood and air leakage from the targeted area. Fibrin sealants contain fibrinogen and thrombin and differ in their final composition. This affects properties of the resulting fibrin clot and may influence their use in different surgical procedures. Fibrin sealants with high concentrations of fibrinogen tend to produce stronger clots, whereas those containing higher concentrations of thrombin form clots rapidly.
Major factors driving growth of the fibrin sealants market include rise in technological advancements, increase in prevalence rate of chronic diseases, such as heart diseases, cancer, ischemic stroke, aneurysm, and increase in road accidents related surgeries propel high adoption of fibrin sealants. For instance, according to World Health Organization Cardiovascular Diseases (CVDs) are leading cause of death globally, taking an estimated 17.9 million lives each year. It has been estimated in 2020 that around 17.9 million people die each year from CVDs, an estimated 31% of all deaths worldwide. For instance, according to the National Center for Health Statistics, every year, about 805,000 people in the U.S. have a heart attack. This led to increase in number of cardiac surgeries and use of fibrin sealants.
However, unfavorable reimbursements as well as complications such as high costs associated with fibrin sealant products are expected to hamper the market growth. On the contrary, unmet medical demands in developing countries and lucrative opportunities in emerging economies are expected to create immense opportunities for fibrin sealant manufacturers worldwide in the future.
The fibrin sealants market is segmented on the basis of dosage form, application, end user, and region. On the basis of dosage form, the market is classified into liquid, patch, and powder. As per application, it is classified into general surgery, cardiovascular surgery, wound management, orthopedic surgery, urological surgery, ophthalmic surgery, and others.
Depending on end user, it is fragmented into hospitals, ambulatory surgical centers, and clinics. Region wise, the market is analyzed across North America (the U.S., Canada, and Mexico), Europe (Germany, France, the UK, Italy, Spain, and rest of Europe), Asia-Pacific (Japan, China, Australia, India, South Korea, and rest of Asia-Pacific), and LAMEA (Brazil, South Africa, Saudi Arabia, and rest of LAMEA).
Major players profiled in the report are Baxter International Inc., Becton, Dickinson and Company, Corza Medical, CSL Behring, Grifols, S.A., Hemarus Therapeutics Ltd., Johnson and Johnson, Nordson Corporation (Nordson Medical), Shanghai RAAS Blood Products Co., Ltd., and Vivostat A/S.
Key Benefits For Stakeholders
- This report provides a quantitative analysis of the market segments, current trends, estimations, and dynamics of the fibrin sealants market analysis from 2022 to 2032 to identify the prevailing fibrin sealants market opportunities.
- The market research is offered along with information related to key drivers, restraints, and opportunities.
- Porter's five forces analysis highlights the potency of buyers and suppliers to enable stakeholders make profit-oriented business decisions and strengthen their supplier-buyer network.
- In-depth analysis of the fibrin sealants market segmentation assists to determine the prevailing market opportunities.
- Major countries in each region are mapped according to their revenue contribution to the global market.
- Market player positioning facilitates benchmarking and provides a clear understanding of the present position of the market players.
- The report includes the analysis of the regional as well as global fibrin sealants market trends, key players, market segments, application areas, and market growth strategies.
Additional benefits you will get with this purchase are:
- Quarterly Update and* (only available with a corporate license, on listed price)
- 5 additional Company Profile of client Choice pre- or Post-purchase, as a free update.
- Free Upcoming Version on the Purchase of Five and Enterprise User License.
- 16 analyst hours of support* (post-purchase, if you find additional data requirements upon review of the report, you may receive support amounting to 16 analyst hours to solve questions, and post-sale queries)
- 15% Free Customization* (in case the scope or segment of the report does not match your requirements, 15% is equivalent to 3 working days of free work, applicable once)
- Free data Pack on the Five and Enterprise User License. (Excel version of the report)
- Free Updated report if the report is 6-12 months old or older.
- 24-hour priority response*
- Free Industry updates and white papers.
Possible Customization with this report (with additional cost and timeline, please talk to the sales executive to know more)
- Additional company profiles with specific to client's interest
- Additional country or region analysis- market size and forecast
- Average Selling Price Analysis / Price Point Analysis
- Criss-cross segment analysis- market size and forecast
- Expanded list for Company Profiles
- Historic market data
- Key player details (including location, contact details, supplier/vendor network etc. in excel format)
- Market share analysis of players at global/region/country level
- SWOT Analysis
Key Market Segments
By Dosage Forms
- Liquid
- Liquid Type
- Frozen fibrin sealants
- Freeze dried fibrin sealants
- Patch
- Powder
By Application
- General Surgery
- Cardiovascular Surgery
- Wound Management
- Orthopedic Surgery
- Urological Surgeries
- Ophthalmic Surgeries
- Others
By End User
- Hospitals
- Ambulatory Surgical Centers
- Clinics
By Region
- North America
- U.S.
- Canada
- Mexico
- Europe
- Germany
- France
- UK
- Italy
- Spain
- Rest of Europe
- Asia-Pacific
- Japan
- China
- India
- Australia
- South Korea
- Rest of Asia-Pacific
- LAMEA
- Brazil
- South Africa
- Saudi Arabia
- Rest of LAMEA
Key Market Players:
- Grifols, S.A.
- Baxter International Inc.
- CSL Behring
- Johnson and Johnson
- Hemarus Therapeutics Ltd.
- Nordson Corporation (Nordson Medical)
- Becton, Dickinson and Company
- Vivostat A/S
- Shanghai Raas Blood Products Co. Ltd
- Corza Medical
TABLE OF CONTENTS
CHAPTER 1: INTRODUCTION
- 1.1. Report description
- 1.2. Key market segments
- 1.3. Key benefits to the stakeholders
- 1.4. Research methodology
- 1.4.1. Primary research
- 1.4.2. Secondary research
- 1.4.3. Analyst tools and models
CHAPTER 2: EXECUTIVE SUMMARY
- 2.1. CXO Perspective
CHAPTER 3: MARKET OVERVIEW
- 3.1. Market definition and scope
- 3.2. Key findings
- 3.2.1. Top impacting factors
- 3.2.2. Top investment pockets
- 3.3. Porter's five forces analysis
- 3.3.1. Low bargaining power of suppliers
- 3.3.2. Low threat of new entrants
- 3.3.3. Low threat of substitutes
- 3.3.4. Low intensity of rivalry
- 3.3.5. Low bargaining power of buyers
- 3.4. Market dynamics
- 3.4.1. Drivers
- 3.4.1.1. Increase in geriatric population and rise in awareness regarding fibrin sealants
- 3.4.1.2. Growth in the prevalence of chronic diseases and rise in the number of surgical procedures conducted globally
- 3.4.2. Restraints
- 3.4.2.1. High cost of fibrin sealants and availability of alternate products
- 3.4.3. Opportunities
- 3.4.3.1. Growth opportunities in emerging countries
- 3.4.1. Drivers
CHAPTER 4: FIBRIN SEALANTS MARKET, BY DOSAGE FORMS
- 4.1. Overview
- 4.1.1. Market size and forecast
- 4.2. Liquid
- 4.2.1. Key market trends, growth factors and opportunities
- 4.2.2. Market size and forecast, by region
- 4.2.3. Market share analysis by country
- 4.2.4. Liquid Fibrin Sealants Market by Liquid Type
- 4.3. Patch
- 4.3.1. Key market trends, growth factors and opportunities
- 4.3.2. Market size and forecast, by region
- 4.3.3. Market share analysis by country
- 4.4. Powder
- 4.4.1. Key market trends, growth factors and opportunities
- 4.4.2. Market size and forecast, by region
- 4.4.3. Market share analysis by country
CHAPTER 5: FIBRIN SEALANTS MARKET, BY APPLICATION
- 5.1. Overview
- 5.1.1. Market size and forecast
- 5.2. General Surgery
- 5.2.1. Key market trends, growth factors and opportunities
- 5.2.2. Market size and forecast, by region
- 5.2.3. Market share analysis by country
- 5.3. Cardiovascular Surgery
- 5.3.1. Key market trends, growth factors and opportunities
- 5.3.2. Market size and forecast, by region
- 5.3.3. Market share analysis by country
- 5.4. Wound Management
- 5.4.1. Key market trends, growth factors and opportunities
- 5.4.2. Market size and forecast, by region
- 5.4.3. Market share analysis by country
- 5.5. Orthopedic Surgery
- 5.5.1. Key market trends, growth factors and opportunities
- 5.5.2. Market size and forecast, by region
- 5.5.3. Market share analysis by country
- 5.6. Urological Surgeries
- 5.6.1. Key market trends, growth factors and opportunities
- 5.6.2. Market size and forecast, by region
- 5.6.3. Market share analysis by country
- 5.7. Ophthalmic Surgeries
- 5.7.1. Key market trends, growth factors and opportunities
- 5.7.2. Market size and forecast, by region
- 5.7.3. Market share analysis by country
- 5.8. Others
- 5.8.1. Key market trends, growth factors and opportunities
- 5.8.2. Market size and forecast, by region
- 5.8.3. Market share analysis by country
CHAPTER 6: FIBRIN SEALANTS MARKET, BY END USER
- 6.1. Overview
- 6.1.1. Market size and forecast
- 6.2. Hospitals
- 6.2.1. Key market trends, growth factors and opportunities
- 6.2.2. Market size and forecast, by region
- 6.2.3. Market share analysis by country
- 6.3. Ambulatory Surgical Centers
- 6.3.1. Key market trends, growth factors and opportunities
- 6.3.2. Market size and forecast, by region
- 6.3.3. Market share analysis by country
- 6.4. Clinics
- 6.4.1. Key market trends, growth factors and opportunities
- 6.4.2. Market size and forecast, by region
- 6.4.3. Market share analysis by country
CHAPTER 7: FIBRIN SEALANTS MARKET, BY REGION
- 7.1. Overview
- 7.1.1. Market size and forecast By Region
- 7.2. North America
- 7.2.1. Key market trends, growth factors and opportunities
- 7.2.2. Market size and forecast, by Dosage Forms
- 7.2.3. Market size and forecast, by Application
- 7.2.4. Market size and forecast, by End User
- 7.2.5. Market size and forecast, by country
- 7.2.5.1. U.S.
- 7.2.5.1.1. Market size and forecast, by Dosage Forms
- 7.2.5.1.2. Market size and forecast, by Application
- 7.2.5.1.3. Market size and forecast, by End User
- 7.2.5.2. Canada
- 7.2.5.2.1. Market size and forecast, by Dosage Forms
- 7.2.5.2.2. Market size and forecast, by Application
- 7.2.5.2.3. Market size and forecast, by End User
- 7.2.5.3. Mexico
- 7.2.5.3.1. Market size and forecast, by Dosage Forms
- 7.2.5.3.2. Market size and forecast, by Application
- 7.2.5.3.3. Market size and forecast, by End User
- 7.3. Europe
- 7.3.1. Key market trends, growth factors and opportunities
- 7.3.2. Market size and forecast, by Dosage Forms
- 7.3.3. Market size and forecast, by Application
- 7.3.4. Market size and forecast, by End User
- 7.3.5. Market size and forecast, by country
- 7.3.5.1. Germany
- 7.3.5.1.1. Market size and forecast, by Dosage Forms
- 7.3.5.1.2. Market size and forecast, by Application
- 7.3.5.1.3. Market size and forecast, by End User
- 7.3.5.2. France
- 7.3.5.2.1. Market size and forecast, by Dosage Forms
- 7.3.5.2.2. Market size and forecast, by Application
- 7.3.5.2.3. Market size and forecast, by End User
- 7.3.5.3. UK
- 7.3.5.3.1. Market size and forecast, by Dosage Forms
- 7.3.5.3.2. Market size and forecast, by Application
- 7.3.5.3.3. Market size and forecast, by End User
- 7.3.5.4. Italy
- 7.3.5.4.1. Market size and forecast, by Dosage Forms
- 7.3.5.4.2. Market size and forecast, by Application
- 7.3.5.4.3. Market size and forecast, by End User
- 7.3.5.5. Spain
- 7.3.5.5.1. Market size and forecast, by Dosage Forms
- 7.3.5.5.2. Market size and forecast, by Application
- 7.3.5.5.3. Market size and forecast, by End User
- 7.3.5.6. Rest of Europe
- 7.3.5.6.1. Market size and forecast, by Dosage Forms
- 7.3.5.6.2. Market size and forecast, by Application
- 7.3.5.6.3. Market size and forecast, by End User
- 7.4. Asia-Pacific
- 7.4.1. Key market trends, growth factors and opportunities
- 7.4.2. Market size and forecast, by Dosage Forms
- 7.4.3. Market size and forecast, by Application
- 7.4.4. Market size and forecast, by End User
- 7.4.5. Market size and forecast, by country
- 7.4.5.1. Japan
- 7.4.5.1.1. Market size and forecast, by Dosage Forms
- 7.4.5.1.2. Market size and forecast, by Application
- 7.4.5.1.3. Market size and forecast, by End User
- 7.4.5.2. China
- 7.4.5.2.1. Market size and forecast, by Dosage Forms
- 7.4.5.2.2. Market size and forecast, by Application
- 7.4.5.2.3. Market size and forecast, by End User
- 7.4.5.3. India
- 7.4.5.3.1. Market size and forecast, by Dosage Forms
- 7.4.5.3.2. Market size and forecast, by Application
- 7.4.5.3.3. Market size and forecast, by End User
- 7.4.5.4. Australia
- 7.4.5.4.1. Market size and forecast, by Dosage Forms
- 7.4.5.4.2. Market size and forecast, by Application
- 7.4.5.4.3. Market size and forecast, by End User
- 7.4.5.5. South Korea
- 7.4.5.5.1. Market size and forecast, by Dosage Forms
- 7.4.5.5.2. Market size and forecast, by Application
- 7.4.5.5.3. Market size and forecast, by End User
- 7.4.5.6. Rest of Asia-Pacific
- 7.4.5.6.1. Market size and forecast, by Dosage Forms
- 7.4.5.6.2. Market size and forecast, by Application
- 7.4.5.6.3. Market size and forecast, by End User
- 7.5. LAMEA
- 7.5.1. Key market trends, growth factors and opportunities
- 7.5.2. Market size and forecast, by Dosage Forms
- 7.5.3. Market size and forecast, by Application
- 7.5.4. Market size and forecast, by End User
- 7.5.5. Market size and forecast, by country
- 7.5.5.1. Brazil
- 7.5.5.1.1. Market size and forecast, by Dosage Forms
- 7.5.5.1.2. Market size and forecast, by Application
- 7.5.5.1.3. Market size and forecast, by End User
- 7.5.5.2. South Africa
- 7.5.5.2.1. Market size and forecast, by Dosage Forms
- 7.5.5.2.2. Market size and forecast, by Application
- 7.5.5.2.3. Market size and forecast, by End User
- 7.5.5.3. Saudi Arabia
- 7.5.5.3.1. Market size and forecast, by Dosage Forms
- 7.5.5.3.2. Market size and forecast, by Application
- 7.5.5.3.3. Market size and forecast, by End User
- 7.5.5.4. Rest of LAMEA
- 7.5.5.4.1. Market size and forecast, by Dosage Forms
- 7.5.5.4.2. Market size and forecast, by Application
- 7.5.5.4.3. Market size and forecast, by End User
CHAPTER 8: COMPETITIVE LANDSCAPE
- 8.1. Introduction
- 8.2. Top winning strategies
- 8.3. Product mapping of top 10 player
- 8.4. Competitive dashboard
- 8.5. Competitive heatmap
- 8.6. Top player positioning, 2022
CHAPTER 9: COMPANY PROFILES
- 9.1. Baxter International Inc.
- 9.1.1. Company overview
- 9.1.2. Key executives
- 9.1.3. Company snapshot
- 9.1.4. Operating business segments
- 9.1.5. Product portfolio
- 9.1.6. Business performance
- 9.2. Becton, Dickinson and Company
- 9.2.1. Company overview
- 9.2.2. Key executives
- 9.2.3. Company snapshot
- 9.2.4. Operating business segments
- 9.2.5. Product portfolio
- 9.2.6. Business performance
- 9.3. Corza Medical
- 9.3.1. Company overview
- 9.3.2. Key executives
- 9.3.3. Company snapshot
- 9.3.4. Operating business segments
- 9.3.5. Product portfolio
- 9.3.6. Key strategic moves and developments
- 9.4. CSL Behring
- 9.4.1. Company overview
- 9.4.2. Key executives
- 9.4.3. Company snapshot
- 9.4.4. Operating business segments
- 9.4.5. Product portfolio
- 9.4.6. Business performance
- 9.5. Grifols, S.A.
- 9.5.1. Company overview
- 9.5.2. Key executives
- 9.5.3. Company snapshot
- 9.5.4. Operating business segments
- 9.5.5. Product portfolio
- 9.5.6. Business performance
- 9.5.7. Key strategic moves and developments
- 9.6. Hemarus Therapeutics Ltd.
- 9.6.1. Company overview
- 9.6.2. Key executives
- 9.6.3. Company snapshot
- 9.6.4. Operating business segments
- 9.6.5. Product portfolio
- 9.7. Johnson and Johnson
- 9.7.1. Company overview
- 9.7.2. Key executives
- 9.7.3. Company snapshot
- 9.7.4. Operating business segments
- 9.7.5. Product portfolio
- 9.7.6. Business performance
- 9.8. Nordson Corporation (Nordson Medical)
- 9.8.1. Company overview
- 9.8.2. Key executives
- 9.8.3. Company snapshot
- 9.8.4. Operating business segments
- 9.8.5. Product portfolio
- 9.8.6. Business performance
- 9.9. Shanghai Raas Blood Products Co. Ltd
- 9.9.1. Company overview
- 9.9.2. Key executives
- 9.9.3. Company snapshot
- 9.9.4. Operating business segments
- 9.9.5. Product portfolio
- 9.10. Vivostat A/S
- 9.10.1. Company overview
- 9.10.2. Key executives
- 9.10.3. Company snapshot
- 9.10.4. Operating business segments
- 9.10.5. Product portfolio
LIST OF TABLES
- TABLE 01. GLOBAL FIBRIN SEALANTS MARKET, BY DOSAGE FORMS, 2022-2032 ($MILLION)
- TABLE 02. FIBRIN SEALANTS MARKET FOR LIQUID, BY REGION, 2022-2032 ($MILLION)
- TABLE 03. GLOBAL LIQUID FIBRIN SEALANTS MARKET, BY LIQUID TYPE, 2022-2032 ($MILLION)
- TABLE 04. FIBRIN SEALANTS MARKET FOR PATCH, BY REGION, 2022-2032 ($MILLION)
- TABLE 05. FIBRIN SEALANTS MARKET FOR POWDER, BY REGION, 2022-2032 ($MILLION)
- TABLE 06. GLOBAL FIBRIN SEALANTS MARKET, BY APPLICATION, 2022-2032 ($MILLION)
- TABLE 07. FIBRIN SEALANTS MARKET FOR GENERAL SURGERY, BY REGION, 2022-2032 ($MILLION)
- TABLE 08. FIBRIN SEALANTS MARKET FOR CARDIOVASCULAR SURGERY, BY REGION, 2022-2032 ($MILLION)
- TABLE 09. FIBRIN SEALANTS MARKET FOR WOUND MANAGEMENT, BY REGION, 2022-2032 ($MILLION)
- TABLE 10. FIBRIN SEALANTS MARKET FOR ORTHOPEDIC SURGERY, BY REGION, 2022-2032 ($MILLION)
- TABLE 11. FIBRIN SEALANTS MARKET FOR UROLOGICAL SURGERIES, BY REGION, 2022-2032 ($MILLION)
- TABLE 12. FIBRIN SEALANTS MARKET FOR OPHTHALMIC SURGERIES, BY REGION, 2022-2032 ($MILLION)
- TABLE 13. FIBRIN SEALANTS MARKET FOR OTHERS, BY REGION, 2022-2032 ($MILLION)
- TABLE 14. GLOBAL FIBRIN SEALANTS MARKET, BY END USER, 2022-2032 ($MILLION)
- TABLE 15. FIBRIN SEALANTS MARKET FOR HOSPITALS, BY REGION, 2022-2032 ($MILLION)
- TABLE 16. FIBRIN SEALANTS MARKET FOR AMBULATORY SURGICAL CENTERS, BY REGION, 2022-2032 ($MILLION)
- TABLE 17. FIBRIN SEALANTS MARKET FOR CLINICS, BY REGION, 2022-2032 ($MILLION)
- TABLE 18. FIBRIN SEALANTS MARKET, BY REGION, 2022-2032 ($MILLION)
- TABLE 19. NORTH AMERICA FIBRIN SEALANTS MARKET, BY DOSAGE FORMS, 2022-2032 ($MILLION)
- TABLE 20. NORTH AMERICA FIBRIN SEALANTS MARKET, BY APPLICATION, 2022-2032 ($MILLION)
- TABLE 21. NORTH AMERICA FIBRIN SEALANTS MARKET, BY END USER, 2022-2032 ($MILLION)
- TABLE 22. NORTH AMERICA FIBRIN SEALANTS MARKET, BY COUNTRY, 2022-2032 ($MILLION)
- TABLE 23. U.S. FIBRIN SEALANTS MARKET, BY DOSAGE FORMS, 2022-2032 ($MILLION)
- TABLE 24. U.S. FIBRIN SEALANTS MARKET, BY APPLICATION, 2022-2032 ($MILLION)
- TABLE 25. U.S. FIBRIN SEALANTS MARKET, BY END USER, 2022-2032 ($MILLION)
- TABLE 26. CANADA FIBRIN SEALANTS MARKET, BY DOSAGE FORMS, 2022-2032 ($MILLION)
- TABLE 27. CANADA FIBRIN SEALANTS MARKET, BY APPLICATION, 2022-2032 ($MILLION)
- TABLE 28. CANADA FIBRIN SEALANTS MARKET, BY END USER, 2022-2032 ($MILLION)
- TABLE 29. MEXICO FIBRIN SEALANTS MARKET, BY DOSAGE FORMS, 2022-2032 ($MILLION)
- TABLE 30. MEXICO FIBRIN SEALANTS MARKET, BY APPLICATION, 2022-2032 ($MILLION)
- TABLE 31. MEXICO FIBRIN SEALANTS MARKET, BY END USER, 2022-2032 ($MILLION)
- TABLE 32. EUROPE FIBRIN SEALANTS MARKET, BY DOSAGE FORMS, 2022-2032 ($MILLION)
- TABLE 33. EUROPE FIBRIN SEALANTS MARKET, BY APPLICATION, 2022-2032 ($MILLION)
- TABLE 34. EUROPE FIBRIN SEALANTS MARKET, BY END USER, 2022-2032 ($MILLION)
- TABLE 35. EUROPE FIBRIN SEALANTS MARKET, BY COUNTRY, 2022-2032 ($MILLION)
- TABLE 36. GERMANY FIBRIN SEALANTS MARKET, BY DOSAGE FORMS, 2022-2032 ($MILLION)
- TABLE 37. GERMANY FIBRIN SEALANTS MARKET, BY APPLICATION, 2022-2032 ($MILLION)
- TABLE 38. GERMANY FIBRIN SEALANTS MARKET, BY END USER, 2022-2032 ($MILLION)
- TABLE 39. FRANCE FIBRIN SEALANTS MARKET, BY DOSAGE FORMS, 2022-2032 ($MILLION)
- TABLE 40. FRANCE FIBRIN SEALANTS MARKET, BY APPLICATION, 2022-2032 ($MILLION)
- TABLE 41. FRANCE FIBRIN SEALANTS MARKET, BY END USER, 2022-2032 ($MILLION)
- TABLE 42. UK FIBRIN SEALANTS MARKET, BY DOSAGE FORMS, 2022-2032 ($MILLION)
- TABLE 43. UK FIBRIN SEALANTS MARKET, BY APPLICATION, 2022-2032 ($MILLION)
- TABLE 44. UK FIBRIN SEALANTS MARKET, BY END USER, 2022-2032 ($MILLION)
- TABLE 45. ITALY FIBRIN SEALANTS MARKET, BY DOSAGE FORMS, 2022-2032 ($MILLION)
- TABLE 46. ITALY FIBRIN SEALANTS MARKET, BY APPLICATION, 2022-2032 ($MILLION)
- TABLE 47. ITALY FIBRIN SEALANTS MARKET, BY END USER, 2022-2032 ($MILLION)
- TABLE 48. SPAIN FIBRIN SEALANTS MARKET, BY DOSAGE FORMS, 2022-2032 ($MILLION)
- TABLE 49. SPAIN FIBRIN SEALANTS MARKET, BY APPLICATION, 2022-2032 ($MILLION)
- TABLE 50. SPAIN FIBRIN SEALANTS MARKET, BY END USER, 2022-2032 ($MILLION)
- TABLE 51. REST OF EUROPE FIBRIN SEALANTS MARKET, BY DOSAGE FORMS, 2022-2032 ($MILLION)
- TABLE 52. REST OF EUROPE FIBRIN SEALANTS MARKET, BY APPLICATION, 2022-2032 ($MILLION)
- TABLE 53. REST OF EUROPE FIBRIN SEALANTS MARKET, BY END USER, 2022-2032 ($MILLION)
- TABLE 54. ASIA-PACIFIC FIBRIN SEALANTS MARKET, BY DOSAGE FORMS, 2022-2032 ($MILLION)
- TABLE 55. ASIA-PACIFIC FIBRIN SEALANTS MARKET, BY APPLICATION, 2022-2032 ($MILLION)
- TABLE 56. ASIA-PACIFIC FIBRIN SEALANTS MARKET, BY END USER, 2022-2032 ($MILLION)
- TABLE 57. ASIA-PACIFIC FIBRIN SEALANTS MARKET, BY COUNTRY, 2022-2032 ($MILLION)
- TABLE 58. JAPAN FIBRIN SEALANTS MARKET, BY DOSAGE FORMS, 2022-2032 ($MILLION)
- TABLE 59. JAPAN FIBRIN SEALANTS MARKET, BY APPLICATION, 2022-2032 ($MILLION)
- TABLE 60. JAPAN FIBRIN SEALANTS MARKET, BY END USER, 2022-2032 ($MILLION)
- TABLE 61. CHINA FIBRIN SEALANTS MARKET, BY DOSAGE FORMS, 2022-2032 ($MILLION)
- TABLE 62. CHINA FIBRIN SEALANTS MARKET, BY APPLICATION, 2022-2032 ($MILLION)
- TABLE 63. CHINA FIBRIN SEALANTS MARKET, BY END USER, 2022-2032 ($MILLION)
- TABLE 64. INDIA FIBRIN SEALANTS MARKET, BY DOSAGE FORMS, 2022-2032 ($MILLION)
- TABLE 65. INDIA FIBRIN SEALANTS MARKET, BY APPLICATION, 2022-2032 ($MILLION)
- TABLE 66. INDIA FIBRIN SEALANTS MARKET, BY END USER, 2022-2032 ($MILLION)
- TABLE 67. AUSTRALIA FIBRIN SEALANTS MARKET, BY DOSAGE FORMS, 2022-2032 ($MILLION)
- TABLE 68. AUSTRALIA FIBRIN SEALANTS MARKET, BY APPLICATION, 2022-2032 ($MILLION)
- TABLE 69. AUSTRALIA FIBRIN SEALANTS MARKET, BY END USER, 2022-2032 ($MILLION)
- TABLE 70. SOUTH KOREA FIBRIN SEALANTS MARKET, BY DOSAGE FORMS, 2022-2032 ($MILLION)
- TABLE 71. SOUTH KOREA FIBRIN SEALANTS MARKET, BY APPLICATION, 2022-2032 ($MILLION)
- TABLE 72. SOUTH KOREA FIBRIN SEALANTS MARKET, BY END USER, 2022-2032 ($MILLION)
- TABLE 73. REST OF ASIA-PACIFIC FIBRIN SEALANTS MARKET, BY DOSAGE FORMS, 2022-2032 ($MILLION)
- TABLE 74. REST OF ASIA-PACIFIC FIBRIN SEALANTS MARKET, BY APPLICATION, 2022-2032 ($MILLION)
- TABLE 75. REST OF ASIA-PACIFIC FIBRIN SEALANTS MARKET, BY END USER, 2022-2032 ($MILLION)
- TABLE 76. LAMEA FIBRIN SEALANTS MARKET, BY DOSAGE FORMS, 2022-2032 ($MILLION)
- TABLE 77. LAMEA FIBRIN SEALANTS MARKET, BY APPLICATION, 2022-2032 ($MILLION)
- TABLE 78. LAMEA FIBRIN SEALANTS MARKET, BY END USER, 2022-2032 ($MILLION)
- TABLE 79. LAMEA FIBRIN SEALANTS MARKET, BY COUNTRY, 2022-2032 ($MILLION)
- TABLE 80. BRAZIL FIBRIN SEALANTS MARKET, BY DOSAGE FORMS, 2022-2032 ($MILLION)
- TABLE 81. BRAZIL FIBRIN SEALANTS MARKET, BY APPLICATION, 2022-2032 ($MILLION)
- TABLE 82. BRAZIL FIBRIN SEALANTS MARKET, BY END USER, 2022-2032 ($MILLION)
- TABLE 83. SOUTH AFRICA FIBRIN SEALANTS MARKET, BY DOSAGE FORMS, 2022-2032 ($MILLION)
- TABLE 84. SOUTH AFRICA FIBRIN SEALANTS MARKET, BY APPLICATION, 2022-2032 ($MILLION)
- TABLE 85. SOUTH AFRICA FIBRIN SEALANTS MARKET, BY END USER, 2022-2032 ($MILLION)
- TABLE 86. SAUDI ARABIA FIBRIN SEALANTS MARKET, BY DOSAGE FORMS, 2022-2032 ($MILLION)
- TABLE 87. SAUDI ARABIA FIBRIN SEALANTS MARKET, BY APPLICATION, 2022-2032 ($MILLION)
- TABLE 88. SAUDI ARABIA FIBRIN SEALANTS MARKET, BY END USER, 2022-2032 ($MILLION)
- TABLE 89. REST OF LAMEA FIBRIN SEALANTS MARKET, BY DOSAGE FORMS, 2022-2032 ($MILLION)
- TABLE 90. REST OF LAMEA FIBRIN SEALANTS MARKET, BY APPLICATION, 2022-2032 ($MILLION)
- TABLE 91. REST OF LAMEA FIBRIN SEALANTS MARKET, BY END USER, 2022-2032 ($MILLION)
- TABLE 92. BAXTER INTERNATIONAL INC.: KEY EXECUTIVES
- TABLE 93. BAXTER INTERNATIONAL INC.: COMPANY SNAPSHOT
- TABLE 94. BAXTER INTERNATIONAL INC.: PRODUCT SEGMENTS
- TABLE 95. BAXTER INTERNATIONAL INC.: PRODUCT PORTFOLIO
- TABLE 96. BECTON, DICKINSON AND COMPANY: KEY EXECUTIVES
- TABLE 97. BECTON, DICKINSON AND COMPANY: COMPANY SNAPSHOT
- TABLE 98. BECTON, DICKINSON AND COMPANY: PRODUCT SEGMENTS
- TABLE 99. BECTON, DICKINSON AND COMPANY: PRODUCT PORTFOLIO
- TABLE 100. CORZA MEDICAL: KEY EXECUTIVES
- TABLE 101. CORZA MEDICAL: COMPANY SNAPSHOT
- TABLE 102. CORZA MEDICAL: PRODUCT SEGMENTS
- TABLE 103. CORZA MEDICAL: SERVICE SEGMENTS
- TABLE 104. CORZA MEDICAL: PRODUCT PORTFOLIO
- TABLE 105. CORZA MEDICAL: KEY STRATERGIES
- TABLE 106. CSL BEHRING: KEY EXECUTIVES
- TABLE 107. CSL BEHRING: COMPANY SNAPSHOT
- TABLE 108. CSL BEHRING: SERVICE SEGMENTS
- TABLE 109. CSL BEHRING: PRODUCT PORTFOLIO
- TABLE 110. GRIFOLS, S.A.: KEY EXECUTIVES
- TABLE 111. GRIFOLS, S.A.: COMPANY SNAPSHOT
- TABLE 112. GRIFOLS, S.A.: PRODUCT SEGMENTS
- TABLE 113. GRIFOLS, S.A.: SERVICE SEGMENTS
- TABLE 114. GRIFOLS, S.A.: PRODUCT PORTFOLIO
- TABLE 115. GRIFOLS, S.A.: KEY STRATERGIES
- TABLE 116. HEMARUS THERAPEUTICS LTD.: KEY EXECUTIVES
- TABLE 117. HEMARUS THERAPEUTICS LTD.: COMPANY SNAPSHOT
- TABLE 118. HEMARUS THERAPEUTICS LTD.: PRODUCT SEGMENTS
- TABLE 119. HEMARUS THERAPEUTICS LTD.: SERVICE SEGMENTS
- TABLE 120. HEMARUS THERAPEUTICS LTD.: PRODUCT PORTFOLIO
- TABLE 121. JOHNSON AND JOHNSON: KEY EXECUTIVES
- TABLE 122. JOHNSON AND JOHNSON: COMPANY SNAPSHOT
- TABLE 123. JOHNSON AND JOHNSON: PRODUCT SEGMENTS
- TABLE 124. JOHNSON AND JOHNSON: SERVICE SEGMENTS
- TABLE 125. JOHNSON AND JOHNSON: PRODUCT PORTFOLIO
- TABLE 126. NORDSON CORPORATION (NORDSON MEDICAL): KEY EXECUTIVES
- TABLE 127. NORDSON CORPORATION (NORDSON MEDICAL): COMPANY SNAPSHOT
- TABLE 128. NORDSON CORPORATION (NORDSON MEDICAL): PRODUCT SEGMENTS
- TABLE 129. NORDSON CORPORATION (NORDSON MEDICAL): SERVICE SEGMENTS
- TABLE 130. NORDSON CORPORATION (NORDSON MEDICAL): PRODUCT PORTFOLIO
- TABLE 131. SHANGHAI RAAS BLOOD PRODUCTS CO. LTD: KEY EXECUTIVES
- TABLE 132. SHANGHAI RAAS BLOOD PRODUCTS CO. LTD: COMPANY SNAPSHOT
- TABLE 133. SHANGHAI RAAS BLOOD PRODUCTS CO. LTD: SERVICE SEGMENTS
- TABLE 134. SHANGHAI RAAS BLOOD PRODUCTS CO. LTD: PRODUCT PORTFOLIO
- TABLE 135. VIVOSTAT A/S: KEY EXECUTIVES
- TABLE 136. VIVOSTAT A/S: COMPANY SNAPSHOT
- TABLE 137. VIVOSTAT A/S: SERVICE SEGMENTS
- TABLE 138. VIVOSTAT A/S: PRODUCT PORTFOLIO
LIST OF FIGURES
- FIGURE 01. FIBRIN SEALANTS MARKET, 2022-2032
- FIGURE 02. SEGMENTATION OF FIBRIN SEALANTS MARKET,2022-2032
- FIGURE 03. TOP IMPACTING FACTORS IN FIBRIN SEALANTS MARKET (2022 TO 2032)
- FIGURE 04. TOP INVESTMENT POCKETS IN FIBRIN SEALANTS MARKET (2023-2032)
- FIGURE 05. LOW BARGAINING POWER OF SUPPLIERS
- FIGURE 06. LOW THREAT OF NEW ENTRANTS
- FIGURE 07. LOW THREAT OF SUBSTITUTES
- FIGURE 08. LOW INTENSITY OF RIVALRY
- FIGURE 09. LOW BARGAINING POWER OF BUYERS
- FIGURE 10. GLOBAL FIBRIN SEALANTS MARKET:DRIVERS, RESTRAINTS AND OPPORTUNITIES
- FIGURE 11. FIBRIN SEALANTS MARKET, BY DOSAGE FORMS, 2022 AND 2032(%)
- FIGURE 12. COMPARATIVE SHARE ANALYSIS OF FIBRIN SEALANTS MARKET FOR LIQUID, BY COUNTRY 2022 AND 2032(%)
- FIGURE 13. COMPARATIVE SHARE ANALYSIS OF FIBRIN SEALANTS MARKET FOR PATCH, BY COUNTRY 2022 AND 2032(%)
- FIGURE 14. COMPARATIVE SHARE ANALYSIS OF FIBRIN SEALANTS MARKET FOR POWDER, BY COUNTRY 2022 AND 2032(%)
- FIGURE 15. FIBRIN SEALANTS MARKET, BY APPLICATION, 2022 AND 2032(%)
- FIGURE 16. COMPARATIVE SHARE ANALYSIS OF FIBRIN SEALANTS MARKET FOR GENERAL SURGERY, BY COUNTRY 2022 AND 2032(%)
- FIGURE 17. COMPARATIVE SHARE ANALYSIS OF FIBRIN SEALANTS MARKET FOR CARDIOVASCULAR SURGERY, BY COUNTRY 2022 AND 2032(%)
- FIGURE 18. COMPARATIVE SHARE ANALYSIS OF FIBRIN SEALANTS MARKET FOR WOUND MANAGEMENT, BY COUNTRY 2022 AND 2032(%)
- FIGURE 19. COMPARATIVE SHARE ANALYSIS OF FIBRIN SEALANTS MARKET FOR ORTHOPEDIC SURGERY, BY COUNTRY 2022 AND 2032(%)
- FIGURE 20. COMPARATIVE SHARE ANALYSIS OF FIBRIN SEALANTS MARKET FOR UROLOGICAL SURGERIES, BY COUNTRY 2022 AND 2032(%)
- FIGURE 21. COMPARATIVE SHARE ANALYSIS OF FIBRIN SEALANTS MARKET FOR OPHTHALMIC SURGERIES, BY COUNTRY 2022 AND 2032(%)
- FIGURE 22. COMPARATIVE SHARE ANALYSIS OF FIBRIN SEALANTS MARKET FOR OTHERS, BY COUNTRY 2022 AND 2032(%)
- FIGURE 23. FIBRIN SEALANTS MARKET, BY END USER, 2022 AND 2032(%)
- FIGURE 24. COMPARATIVE SHARE ANALYSIS OF FIBRIN SEALANTS MARKET FOR HOSPITALS, BY COUNTRY 2022 AND 2032(%)
- FIGURE 25. COMPARATIVE SHARE ANALYSIS OF FIBRIN SEALANTS MARKET FOR AMBULATORY SURGICAL CENTERS, BY COUNTRY 2022 AND 2032(%)
- FIGURE 26. COMPARATIVE SHARE ANALYSIS OF FIBRIN SEALANTS MARKET FOR CLINICS, BY COUNTRY 2022 AND 2032(%)
- FIGURE 27. FIBRIN SEALANTS MARKET BY REGION, 2022 AND 2032(%)
- FIGURE 28. U.S. FIBRIN SEALANTS MARKET, 2022-2032 ($MILLION)
- FIGURE 29. CANADA FIBRIN SEALANTS MARKET, 2022-2032 ($MILLION)
- FIGURE 30. MEXICO FIBRIN SEALANTS MARKET, 2022-2032 ($MILLION)
- FIGURE 31. GERMANY FIBRIN SEALANTS MARKET, 2022-2032 ($MILLION)
- FIGURE 32. FRANCE FIBRIN SEALANTS MARKET, 2022-2032 ($MILLION)
- FIGURE 33. UK FIBRIN SEALANTS MARKET, 2022-2032 ($MILLION)
- FIGURE 34. ITALY FIBRIN SEALANTS MARKET, 2022-2032 ($MILLION)
- FIGURE 35. SPAIN FIBRIN SEALANTS MARKET, 2022-2032 ($MILLION)
- FIGURE 36. REST OF EUROPE FIBRIN SEALANTS MARKET, 2022-2032 ($MILLION)
- FIGURE 37. JAPAN FIBRIN SEALANTS MARKET, 2022-2032 ($MILLION)
- FIGURE 38. CHINA FIBRIN SEALANTS MARKET, 2022-2032 ($MILLION)
- FIGURE 39. INDIA FIBRIN SEALANTS MARKET, 2022-2032 ($MILLION)
- FIGURE 40. AUSTRALIA FIBRIN SEALANTS MARKET, 2022-2032 ($MILLION)
- FIGURE 41. SOUTH KOREA FIBRIN SEALANTS MARKET, 2022-2032 ($MILLION)
- FIGURE 42. REST OF ASIA-PACIFIC FIBRIN SEALANTS MARKET, 2022-2032 ($MILLION)
- FIGURE 43. BRAZIL FIBRIN SEALANTS MARKET, 2022-2032 ($MILLION)
- FIGURE 44. SOUTH AFRICA FIBRIN SEALANTS MARKET, 2022-2032 ($MILLION)
- FIGURE 45. SAUDI ARABIA FIBRIN SEALANTS MARKET, 2022-2032 ($MILLION)
- FIGURE 46. REST OF LAMEA FIBRIN SEALANTS MARKET, 2022-2032 ($MILLION)
- FIGURE 47. TOP WINNING STRATEGIES, BY YEAR (2019-2021)
- FIGURE 48. TOP WINNING STRATEGIES, BY DEVELOPMENT (2019-2021)
- FIGURE 49. TOP WINNING STRATEGIES, BY COMPANY (2019-2021)
- FIGURE 50. PRODUCT MAPPING OF TOP 10 PLAYERS
- FIGURE 51. COMPETITIVE DASHBOARD
- FIGURE 52. COMPETITIVE HEATMAP: FIBRIN SEALANTS MARKET
- FIGURE 53. TOP PLAYER POSITIONING, 2022
- FIGURE 54. BAXTER INTERNATIONAL INC.: NET SALES, 2020-2022 ($MILLION)
- FIGURE 55. BAXTER INTERNATIONAL INC.: REVENUE SHARE BY REGION, 2022 (%)
- FIGURE 56. BAXTER INTERNATIONAL INC.: REVENUE SHARE BY SEGMENT, 2022 (%)
- FIGURE 57. BECTON, DICKINSON, AND COMPANY: NET REVENUE, 2021-2023 ($MILLION)
- FIGURE 58. BECTON, DICKINSON, AND COMPANY: REVENUE SHARE BY SEGMENT, 2022 (%)
- FIGURE 59. BECTON, DICKINSON, AND COMPANY: REVENUE SHARE BY REGION, 2022 (%)
- FIGURE 60. CSL BEHRING: NET REVENUE, 2021-2023 ($MILLION)
- FIGURE 61. CSL BEHRING: REVENUE SHARE BY SEGMENT, 2023 (%)
- FIGURE 62. CSL BEHRING: REVENUE SHARE BY REGION, 2023 (%)
- FIGURE 63. GRIFOLS, S.A.: NET SALES, 2020-2022 ($MILLION)
- FIGURE 64. GRIFOLS, S.A.: REVENUE SHARE BY SEGMENT, 2022 (%)
- FIGURE 65. GRIFOLS, S.A.: REVENUE SHARE BY REGION, 2022 (%)
- FIGURE 66. JOHNSON AND JOHNSON: NET REVENUE, 2019-2021 ($MILLION)
- FIGURE 67. JOHNSON AND JOHNSON: REVENUE SHARE BY SEGMENT, 2021 (%)
- FIGURE 68. JOHNSON AND JOHNSON: REVENUE SHARE BY REGION, 2021 (%)
- FIGURE 69. NORDSON CORPORATION (NORDSON MEDICAL): NET SALES, 2020-2022 ($MILLION)
- FIGURE 70. NORDSON CORPORATION (NORDSON MEDICAL): REVENUE SHARE BY SEGMENT, 2022 (%)
- FIGURE 71. NORDSON CORPORATION (NORDSON MEDICAL): REVENUE SHARE BY REGION, 2022 (%)

