
PUBLISHER: Allied Market Research | PRODUCT CODE: 1446915

PUBLISHER: Allied Market Research | PRODUCT CODE: 1446915
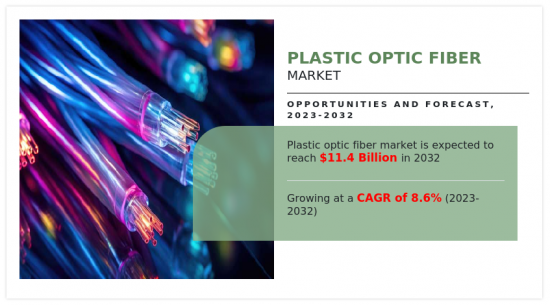
Plastic Optic Fiber Market By Cable Type (Single Mode, Multi Mode), By End-Use Industry (IT and Telecommunication, Energy and Power, Healthcare, Aerospace and Defense, Others): Global Opportunity Analysis and Industry Forecast, 2023-2032
The global plastic optic fiber market size was valued at $5.0 billion in 2022, and is projected to reach $11.4 billion by 2032, growing at a CAGR of 8.6% from 2023 to 2032.
Plastic optic fibers are slender, transparent strands made from polymers, designed to transmit light signals along their length. These fibers are used primarily in telecommunications and networking to transmit data, sound, or images over long distances with high speed and accuracy. It is based on the principle of guiding light through internal reflection. When light enters the core of the fiber at a specific angle, it continuously reflects off the walls of the core, staying confined within the core and transmitting signals over great distances.
Rise in internet penetration and digitalization trends become significant drivers for the growing demand for optic fibers. As businesses and individuals gain access to the internet, there is an escalating need for robust, high-speed, and reliable data transmission infrastructure. Optic fibers, renowned for their ability to transmit vast amounts of data at incredible speeds over long distances, perfectly meet this surging demand. Moreover, the proliferation of online services, cloud computing, and multimedia content consumption has fueled the need for faster and more reliable internet connections. Optic fibers provide the necessary infrastructure to support these services, offering higher bandwidth capabilities compared to traditional copper-based systems. All these factors drive the demand for the plastic optic fiber market during the forecast period.
However, the lack of optic fiber coverage in rural and remote areas poses a significant hurdle to the comprehensive expansion of this technology. While urban centers often benefit from robust optic fiber networks, rural and remote regions face challenges in infrastructure development due to several factors. In addition, the absence of requisite infrastructure in rural areas such as adequate supporting facilities and connectivity points, adds to the complexity and cost of network expansion. All these factors hamper the plastic optic fiber market growth.
Telemedicine and remote healthcare stand at the forefront of transformative healthcare practices where optic fibers play a crucial role in facilitating their efficacy and widespread adoption. These innovative approaches leverage telecommunications technology to deliver medical services, diagnostics, and consultations remotely, overcoming geographical barriers and enhancing access to healthcare. In addition, wearable medical devices equipped with plastic optic fiber sensors collect and transmit vital patient data such as heart rate, blood pressure, or glucose levels, to healthcare providers, enabling timely interventions and adjustments to treatment plans. All these factors are anticipated to offer new growth opportunities for optic fiber during the forecast period.
The plastic optic fiber market is segmented on the basis of cable type, end-use industry, and region. On the basis of cable type, the market is divided into single mode and multi mode. The single mode segment accounted for more than half of global plastic optic fiber market share in 2022 and is expected to maintain its dominance during the forecast period. The rise in demand for higher bandwidth and faster data transfer speeds is a significant driver for single mode cables. With the explosive growth of data-intensive applications such as video streaming, cloud computing, and the internet of things (IoT), there is a continuous need for networks capable of handling massive amounts of data with minimal latency. Single mode cables with their high bandwidth capacity and low signal loss, are well-suited for meeting these escalating data transmission demands.
On the basis of end-use industry, the market is segmented into IT & telecommunication, energy & power, healthcare, aerospace & defense, and others. The IT & telecommunication segment accounted for more than two-fifths of global plastic optic fiber market share in 2022 and is expected to maintain its dominance during the forecast period. The evolution towards 5G networks represents a pivotal driver for optic fiber deployment. 5G technology demands an extensive and robust infrastructure to support its high-speed, low-latency capabilities. Optic fiber networks form the foundation for 5G, enabling the ultra-fast transmission of massive amounts of data required for this next-generation wireless technology.
Region-wise, the market is analyzed across North America, Europe, Asia-Pacific, and LAMEA. Asia-Pacific accounted for more than half of the global plastic optic fiber market share in 2022 and is expected to maintain its dominance during the forecast period. Countries in Asia-Pacific such as China, India, South Korea, and Vietnam are witnessing rapid urbanization and industrialization, leading to an increased demand for high-speed, reliable connectivity across various sectors. This demand is further amplified by the proliferation of digital technologies, the Internet of Things (IoT), cloud services, and the rising number of mobile users. Optic fiber with its superior capacity and speed, is a critical enabler for meeting these escalating connectivity needs, driving its extensive deployment in the region.
Key players in the plastic optic fiber industry include Corning Incorporated, Finisar Corporation, Finolex Cables Ltd., Fujikura Ltd., Hengtong Group Co., Ltd., Leoni, PCT International, Inc, Prysmian Group, Sumitomo Electric Industries Ltd, and Yangtze Optical Fiber and Cable Joint Stock Limited Company.
Apart from these major players, there are other key players in the plastic optic fiber market. These include AFL, Asahi Kasei Corporation, Chromis Fiberoptics, Clearfield Inc., Electri-Cord Manufacturing Company, Molex, LLC, PolyOptics GmbH, Radix Technologies Ltd., SABIC, Teledyne Reynolds, Timbercon Europe Ltd., and VAHALI Group.
Key findings of the study
- On the basis of cable type, multi mode segment is anticipated to grow at the fastest CAGR of 8.8% during the forecast period.
- On the basis of end-use industry, the healthcare segment is anticipated to grow at the fastest CAGR of 9.2% during the forecast period.
- Region-wise, Asia-Pacific has the highest share in 2022 in terms of revenue.
Key Benefits For Stakeholders
- This report provides a quantitative analysis of the market segments, current trends, estimations, and dynamics of the plastic optic fiber market analysis from 2022 to 2032 to identify the prevailing plastic optic fiber market opportunities.
- The market research is offered along with information related to key drivers, restraints, and opportunities.
- Porter's five forces analysis highlights the potency of buyers and suppliers to enable stakeholders make profit-oriented business decisions and strengthen their supplier-buyer network.
- In-depth analysis of the plastic optic fiber market segmentation assists to determine the prevailing market opportunities.
- Major countries in each region are mapped according to their revenue contribution to the global market.
- Market player positioning facilitates benchmarking and provides a clear understanding of the present position of the market players.
- The report includes the analysis of the regional as well as global plastic optic fiber market trends, key players, market segments, application areas, and market growth strategies.
Additional benefits you will get with this purchase are:
- Quarterly Update and* (only available with a corporate license, on listed price)
- 5 additional Company Profile of client Choice pre- or Post-purchase, as a free update.
- Free Upcoming Version on the Purchase of Five and Enterprise User License.
- 16 analyst hours of support* (post-purchase, if you find additional data requirements upon review of the report, you may receive support amounting to 16 analyst hours to solve questions, and post-sale queries)
- 15% Free Customization* (in case the scope or segment of the report does not match your requirements, 15% is equivalent to 3 working days of free work, applicable once)
- Free data Pack on the Five and Enterprise User License. (Excel version of the report)
- Free Updated report if the report is 6-12 months old or older.
- 24-hour priority response*
- Free Industry updates and white papers.
Possible Customization with this report (with additional cost and timeline, please talk to the sales executive to know more)
- Analysis of raw material in a product (by %)
- End user preferences and pain points
- Product Life Cycles
- Supply Chain Analysis & Vendor Margins
- Technology Trend Analysis
- Market share analysis of players by products/segments
- New Product Development/ Product Matrix of Key Players
- Regulatory Guidelines
- Additional company profiles with specific to client's interest
- Additional country or region analysis- market size and forecast
- Average Selling Price Analysis / Price Point Analysis
- Expanded list for Company Profiles
- Historic market data
- Import Export Analysis/Data
- Key player details (including location, contact details, supplier/vendor network etc. in excel format)
- Market share analysis of players at global/region/country level
- Volume Market Size and Forecast
Key Market Segments
By Cable Type
- Single Mode
- Multi Mode
By End-Use Industry
- IT and Telecommunication
- Energy and Power
- Healthcare
- Aerospace and Defense
- Others
By Region
- North America
- U.S.
- Canada
- Mexico
- Europe
- Germany
- France
- UK
- Spain
- Italy
- Rest of Europe
- Asia-Pacific
- China
- India
- Japan
- South Korea
- Australia
- Rest of Asia-Pacific
- LAMEA
- Brazil
- South Africa
- Saudi Arabia
- Rest of LAMEA
Key Market Players:
- Corning Incorporated
- Prysmian Group
- Sumitomo Electric Industries, Ltd.
- Yangtze Optical Fibre and Cable Joint Stock Limited Company
- Fujikura Ltd.
- Leoni AG
- Hengtong Group Co., Ltd.
- FINISAR CORPORATION
- PCT International, Inc.
- Finolex Cables Ltd.
TABLE OF CONTENTS
CHAPTER 1: INTRODUCTION
- 1.1. Report description
- 1.2. Key market segments
- 1.3. Key benefits to the stakeholders
- 1.4. Research methodology
- 1.4.1. Primary research
- 1.4.2. Secondary research
- 1.4.3. Analyst tools and models
CHAPTER 2: EXECUTIVE SUMMARY
- 2.1. CXO Perspective
CHAPTER 3: MARKET OVERVIEW
- 3.1. Market definition and scope
- 3.2. Key findings
- 3.2.1. Top impacting factors
- 3.2.2. Top investment pockets
- 3.3. Porter's five forces analysis
- 3.4. Market dynamics
- 3.4.1. Drivers
- 3.4.2. Restraints
- 3.4.3. Opportunities
- 3.5. Value Chain Analysis
- 3.6. Key Regulation Analysis
- 3.7. Patent Landscape
CHAPTER 4: PLASTIC OPTIC FIBER MARKET, BY CABLE TYPE
- 4.1. Overview
- 4.1.1. Market size and forecast
- 4.2. Single Mode
- 4.2.1. Key market trends, growth factors and opportunities
- 4.2.2. Market size and forecast, by region
- 4.2.3. Market share analysis by country
- 4.3. Multi Mode
- 4.3.1. Key market trends, growth factors and opportunities
- 4.3.2. Market size and forecast, by region
- 4.3.3. Market share analysis by country
CHAPTER 5: PLASTIC OPTIC FIBER MARKET, BY END-USE INDUSTRY
- 5.1. Overview
- 5.1.1. Market size and forecast
- 5.2. IT and Telecommunication
- 5.2.1. Key market trends, growth factors and opportunities
- 5.2.2. Market size and forecast, by region
- 5.2.3. Market share analysis by country
- 5.3. Energy and Power
- 5.3.1. Key market trends, growth factors and opportunities
- 5.3.2. Market size and forecast, by region
- 5.3.3. Market share analysis by country
- 5.4. Healthcare
- 5.4.1. Key market trends, growth factors and opportunities
- 5.4.2. Market size and forecast, by region
- 5.4.3. Market share analysis by country
- 5.5. Aerospace and Defense
- 5.5.1. Key market trends, growth factors and opportunities
- 5.5.2. Market size and forecast, by region
- 5.5.3. Market share analysis by country
- 5.6. Others
- 5.6.1. Key market trends, growth factors and opportunities
- 5.6.2. Market size and forecast, by region
- 5.6.3. Market share analysis by country
CHAPTER 6: PLASTIC OPTIC FIBER MARKET, BY REGION
- 6.1. Overview
- 6.1.1. Market size and forecast By Region
- 6.2. North America
- 6.2.1. Key market trends, growth factors and opportunities
- 6.2.2. Market size and forecast, by Cable Type
- 6.2.3. Market size and forecast, by End-Use Industry
- 6.2.4. Market size and forecast, by country
- 6.2.4.1. U.S.
- 6.2.4.1.1. Market size and forecast, by Cable Type
- 6.2.4.1.2. Market size and forecast, by End-Use Industry
- 6.2.4.2. Canada
- 6.2.4.2.1. Market size and forecast, by Cable Type
- 6.2.4.2.2. Market size and forecast, by End-Use Industry
- 6.2.4.3. Mexico
- 6.2.4.3.1. Market size and forecast, by Cable Type
- 6.2.4.3.2. Market size and forecast, by End-Use Industry
- 6.3. Europe
- 6.3.1. Key market trends, growth factors and opportunities
- 6.3.2. Market size and forecast, by Cable Type
- 6.3.3. Market size and forecast, by End-Use Industry
- 6.3.4. Market size and forecast, by country
- 6.3.4.1. Germany
- 6.3.4.1.1. Market size and forecast, by Cable Type
- 6.3.4.1.2. Market size and forecast, by End-Use Industry
- 6.3.4.2. France
- 6.3.4.2.1. Market size and forecast, by Cable Type
- 6.3.4.2.2. Market size and forecast, by End-Use Industry
- 6.3.4.3. UK
- 6.3.4.3.1. Market size and forecast, by Cable Type
- 6.3.4.3.2. Market size and forecast, by End-Use Industry
- 6.3.4.4. Spain
- 6.3.4.4.1. Market size and forecast, by Cable Type
- 6.3.4.4.2. Market size and forecast, by End-Use Industry
- 6.3.4.5. Italy
- 6.3.4.5.1. Market size and forecast, by Cable Type
- 6.3.4.5.2. Market size and forecast, by End-Use Industry
- 6.3.4.6. Rest of Europe
- 6.3.4.6.1. Market size and forecast, by Cable Type
- 6.3.4.6.2. Market size and forecast, by End-Use Industry
- 6.4. Asia-Pacific
- 6.4.1. Key market trends, growth factors and opportunities
- 6.4.2. Market size and forecast, by Cable Type
- 6.4.3. Market size and forecast, by End-Use Industry
- 6.4.4. Market size and forecast, by country
- 6.4.4.1. China
- 6.4.4.1.1. Market size and forecast, by Cable Type
- 6.4.4.1.2. Market size and forecast, by End-Use Industry
- 6.4.4.2. India
- 6.4.4.2.1. Market size and forecast, by Cable Type
- 6.4.4.2.2. Market size and forecast, by End-Use Industry
- 6.4.4.3. Japan
- 6.4.4.3.1. Market size and forecast, by Cable Type
- 6.4.4.3.2. Market size and forecast, by End-Use Industry
- 6.4.4.4. South Korea
- 6.4.4.4.1. Market size and forecast, by Cable Type
- 6.4.4.4.2. Market size and forecast, by End-Use Industry
- 6.4.4.5. Australia
- 6.4.4.5.1. Market size and forecast, by Cable Type
- 6.4.4.5.2. Market size and forecast, by End-Use Industry
- 6.4.4.6. Rest of Asia-Pacific
- 6.4.4.6.1. Market size and forecast, by Cable Type
- 6.4.4.6.2. Market size and forecast, by End-Use Industry
- 6.5. LAMEA
- 6.5.1. Key market trends, growth factors and opportunities
- 6.5.2. Market size and forecast, by Cable Type
- 6.5.3. Market size and forecast, by End-Use Industry
- 6.5.4. Market size and forecast, by country
- 6.5.4.1. Brazil
- 6.5.4.1.1. Market size and forecast, by Cable Type
- 6.5.4.1.2. Market size and forecast, by End-Use Industry
- 6.5.4.2. South Africa
- 6.5.4.2.1. Market size and forecast, by Cable Type
- 6.5.4.2.2. Market size and forecast, by End-Use Industry
- 6.5.4.3. Saudi Arabia
- 6.5.4.3.1. Market size and forecast, by Cable Type
- 6.5.4.3.2. Market size and forecast, by End-Use Industry
- 6.5.4.4. Rest of LAMEA
- 6.5.4.4.1. Market size and forecast, by Cable Type
- 6.5.4.4.2. Market size and forecast, by End-Use Industry
CHAPTER 7: COMPETITIVE LANDSCAPE
- 7.1. Introduction
- 7.2. Top winning strategies
- 7.3. Product mapping of top 10 player
- 7.4. Competitive dashboard
- 7.5. Competitive heatmap
- 7.6. Top player positioning, 2022
CHAPTER 8: COMPANY PROFILES
- 8.1. Corning Incorporated
- 8.1.1. Company overview
- 8.1.2. Key executives
- 8.1.3. Company snapshot
- 8.1.4. Operating business segments
- 8.1.5. Product portfolio
- 8.1.6. Business performance
- 8.1.7. Key strategic moves and developments
- 8.2. Prysmian Group
- 8.2.1. Company overview
- 8.2.2. Key executives
- 8.2.3. Company snapshot
- 8.2.4. Operating business segments
- 8.2.5. Product portfolio
- 8.2.6. Business performance
- 8.2.7. Key strategic moves and developments
- 8.3. Sumitomo Electric Industries, Ltd.
- 8.3.1. Company overview
- 8.3.2. Key executives
- 8.3.3. Company snapshot
- 8.3.4. Operating business segments
- 8.3.5. Product portfolio
- 8.3.6. Business performance
- 8.3.7. Key strategic moves and developments
- 8.4. Yangtze Optical Fibre and Cable Joint Stock Limited Company
- 8.4.1. Company overview
- 8.4.2. Key executives
- 8.4.3. Company snapshot
- 8.4.4. Operating business segments
- 8.4.5. Product portfolio
- 8.4.6. Business performance
- 8.4.7. Key strategic moves and developments
- 8.5. Fujikura Ltd.
- 8.5.1. Company overview
- 8.5.2. Key executives
- 8.5.3. Company snapshot
- 8.5.4. Operating business segments
- 8.5.5. Product portfolio
- 8.5.6. Business performance
- 8.5.7. Key strategic moves and developments
- 8.6. Leoni AG
- 8.6.1. Company overview
- 8.6.2. Key executives
- 8.6.3. Company snapshot
- 8.6.4. Operating business segments
- 8.6.5. Product portfolio
- 8.6.6. Business performance
- 8.6.7. Key strategic moves and developments
- 8.7. Hengtong Group Co., Ltd.
- 8.7.1. Company overview
- 8.7.2. Key executives
- 8.7.3. Company snapshot
- 8.7.4. Operating business segments
- 8.7.5. Product portfolio
- 8.7.6. Business performance
- 8.7.7. Key strategic moves and developments
- 8.8. FINISAR CORPORATION
- 8.8.1. Company overview
- 8.8.2. Key executives
- 8.8.3. Company snapshot
- 8.8.4. Operating business segments
- 8.8.5. Product portfolio
- 8.8.6. Business performance
- 8.8.7. Key strategic moves and developments
- 8.9. PCT International, Inc.
- 8.9.1. Company overview
- 8.9.2. Key executives
- 8.9.3. Company snapshot
- 8.9.4. Operating business segments
- 8.9.5. Product portfolio
- 8.9.6. Business performance
- 8.9.7. Key strategic moves and developments
- 8.10. Finolex Cables Ltd.
- 8.10.1. Company overview
- 8.10.2. Key executives
- 8.10.3. Company snapshot
- 8.10.4. Operating business segments
- 8.10.5. Product portfolio
- 8.10.6. Business performance
- 8.10.7. Key strategic moves and developments
LIST OF TABLES
- TABLE 01. GLOBAL PLASTIC OPTIC FIBER MARKET, BY CABLE TYPE, 2022-2032 ($MILLION)
- TABLE 02. PLASTIC OPTIC FIBER MARKET FOR SINGLE MODE, BY REGION, 2022-2032 ($MILLION)
- TABLE 03. PLASTIC OPTIC FIBER MARKET FOR MULTI MODE, BY REGION, 2022-2032 ($MILLION)
- TABLE 04. GLOBAL PLASTIC OPTIC FIBER MARKET, BY END-USE INDUSTRY, 2022-2032 ($MILLION)
- TABLE 05. PLASTIC OPTIC FIBER MARKET FOR IT AND TELECOMMUNICATION, BY REGION, 2022-2032 ($MILLION)
- TABLE 06. PLASTIC OPTIC FIBER MARKET FOR ENERGY AND POWER, BY REGION, 2022-2032 ($MILLION)
- TABLE 07. PLASTIC OPTIC FIBER MARKET FOR HEALTHCARE, BY REGION, 2022-2032 ($MILLION)
- TABLE 08. PLASTIC OPTIC FIBER MARKET FOR AEROSPACE AND DEFENSE, BY REGION, 2022-2032 ($MILLION)
- TABLE 09. PLASTIC OPTIC FIBER MARKET FOR OTHERS, BY REGION, 2022-2032 ($MILLION)
- TABLE 10. PLASTIC OPTIC FIBER MARKET, BY REGION, 2022-2032 ($MILLION)
- TABLE 11. NORTH AMERICA PLASTIC OPTIC FIBER MARKET, BY CABLE TYPE, 2022-2032 ($MILLION)
- TABLE 12. NORTH AMERICA PLASTIC OPTIC FIBER MARKET, BY END-USE INDUSTRY, 2022-2032 ($MILLION)
- TABLE 13. NORTH AMERICA PLASTIC OPTIC FIBER MARKET, BY COUNTRY, 2022-2032 ($MILLION)
- TABLE 14. U.S. PLASTIC OPTIC FIBER MARKET, BY CABLE TYPE, 2022-2032 ($MILLION)
- TABLE 15. U.S. PLASTIC OPTIC FIBER MARKET, BY END-USE INDUSTRY, 2022-2032 ($MILLION)
- TABLE 16. CANADA PLASTIC OPTIC FIBER MARKET, BY CABLE TYPE, 2022-2032 ($MILLION)
- TABLE 17. CANADA PLASTIC OPTIC FIBER MARKET, BY END-USE INDUSTRY, 2022-2032 ($MILLION)
- TABLE 18. MEXICO PLASTIC OPTIC FIBER MARKET, BY CABLE TYPE, 2022-2032 ($MILLION)
- TABLE 19. MEXICO PLASTIC OPTIC FIBER MARKET, BY END-USE INDUSTRY, 2022-2032 ($MILLION)
- TABLE 20. EUROPE PLASTIC OPTIC FIBER MARKET, BY CABLE TYPE, 2022-2032 ($MILLION)
- TABLE 21. EUROPE PLASTIC OPTIC FIBER MARKET, BY END-USE INDUSTRY, 2022-2032 ($MILLION)
- TABLE 22. EUROPE PLASTIC OPTIC FIBER MARKET, BY COUNTRY, 2022-2032 ($MILLION)
- TABLE 23. GERMANY PLASTIC OPTIC FIBER MARKET, BY CABLE TYPE, 2022-2032 ($MILLION)
- TABLE 24. GERMANY PLASTIC OPTIC FIBER MARKET, BY END-USE INDUSTRY, 2022-2032 ($MILLION)
- TABLE 25. FRANCE PLASTIC OPTIC FIBER MARKET, BY CABLE TYPE, 2022-2032 ($MILLION)
- TABLE 26. FRANCE PLASTIC OPTIC FIBER MARKET, BY END-USE INDUSTRY, 2022-2032 ($MILLION)
- TABLE 27. UK PLASTIC OPTIC FIBER MARKET, BY CABLE TYPE, 2022-2032 ($MILLION)
- TABLE 28. UK PLASTIC OPTIC FIBER MARKET, BY END-USE INDUSTRY, 2022-2032 ($MILLION)
- TABLE 29. SPAIN PLASTIC OPTIC FIBER MARKET, BY CABLE TYPE, 2022-2032 ($MILLION)
- TABLE 30. SPAIN PLASTIC OPTIC FIBER MARKET, BY END-USE INDUSTRY, 2022-2032 ($MILLION)
- TABLE 31. ITALY PLASTIC OPTIC FIBER MARKET, BY CABLE TYPE, 2022-2032 ($MILLION)
- TABLE 32. ITALY PLASTIC OPTIC FIBER MARKET, BY END-USE INDUSTRY, 2022-2032 ($MILLION)
- TABLE 33. REST OF EUROPE PLASTIC OPTIC FIBER MARKET, BY CABLE TYPE, 2022-2032 ($MILLION)
- TABLE 34. REST OF EUROPE PLASTIC OPTIC FIBER MARKET, BY END-USE INDUSTRY, 2022-2032 ($MILLION)
- TABLE 35. ASIA-PACIFIC PLASTIC OPTIC FIBER MARKET, BY CABLE TYPE, 2022-2032 ($MILLION)
- TABLE 36. ASIA-PACIFIC PLASTIC OPTIC FIBER MARKET, BY END-USE INDUSTRY, 2022-2032 ($MILLION)
- TABLE 37. ASIA-PACIFIC PLASTIC OPTIC FIBER MARKET, BY COUNTRY, 2022-2032 ($MILLION)
- TABLE 38. CHINA PLASTIC OPTIC FIBER MARKET, BY CABLE TYPE, 2022-2032 ($MILLION)
- TABLE 39. CHINA PLASTIC OPTIC FIBER MARKET, BY END-USE INDUSTRY, 2022-2032 ($MILLION)
- TABLE 40. INDIA PLASTIC OPTIC FIBER MARKET, BY CABLE TYPE, 2022-2032 ($MILLION)
- TABLE 41. INDIA PLASTIC OPTIC FIBER MARKET, BY END-USE INDUSTRY, 2022-2032 ($MILLION)
- TABLE 42. JAPAN PLASTIC OPTIC FIBER MARKET, BY CABLE TYPE, 2022-2032 ($MILLION)
- TABLE 43. JAPAN PLASTIC OPTIC FIBER MARKET, BY END-USE INDUSTRY, 2022-2032 ($MILLION)
- TABLE 44. SOUTH KOREA PLASTIC OPTIC FIBER MARKET, BY CABLE TYPE, 2022-2032 ($MILLION)
- TABLE 45. SOUTH KOREA PLASTIC OPTIC FIBER MARKET, BY END-USE INDUSTRY, 2022-2032 ($MILLION)
- TABLE 46. AUSTRALIA PLASTIC OPTIC FIBER MARKET, BY CABLE TYPE, 2022-2032 ($MILLION)
- TABLE 47. AUSTRALIA PLASTIC OPTIC FIBER MARKET, BY END-USE INDUSTRY, 2022-2032 ($MILLION)
- TABLE 48. REST OF ASIA-PACIFIC PLASTIC OPTIC FIBER MARKET, BY CABLE TYPE, 2022-2032 ($MILLION)
- TABLE 49. REST OF ASIA-PACIFIC PLASTIC OPTIC FIBER MARKET, BY END-USE INDUSTRY, 2022-2032 ($MILLION)
- TABLE 50. LAMEA PLASTIC OPTIC FIBER MARKET, BY CABLE TYPE, 2022-2032 ($MILLION)
- TABLE 51. LAMEA PLASTIC OPTIC FIBER MARKET, BY END-USE INDUSTRY, 2022-2032 ($MILLION)
- TABLE 52. LAMEA PLASTIC OPTIC FIBER MARKET, BY COUNTRY, 2022-2032 ($MILLION)
- TABLE 53. BRAZIL PLASTIC OPTIC FIBER MARKET, BY CABLE TYPE, 2022-2032 ($MILLION)
- TABLE 54. BRAZIL PLASTIC OPTIC FIBER MARKET, BY END-USE INDUSTRY, 2022-2032 ($MILLION)
- TABLE 55. SOUTH AFRICA PLASTIC OPTIC FIBER MARKET, BY CABLE TYPE, 2022-2032 ($MILLION)
- TABLE 56. SOUTH AFRICA PLASTIC OPTIC FIBER MARKET, BY END-USE INDUSTRY, 2022-2032 ($MILLION)
- TABLE 57. SAUDI ARABIA PLASTIC OPTIC FIBER MARKET, BY CABLE TYPE, 2022-2032 ($MILLION)
- TABLE 58. SAUDI ARABIA PLASTIC OPTIC FIBER MARKET, BY END-USE INDUSTRY, 2022-2032 ($MILLION)
- TABLE 59. REST OF LAMEA PLASTIC OPTIC FIBER MARKET, BY CABLE TYPE, 2022-2032 ($MILLION)
- TABLE 60. REST OF LAMEA PLASTIC OPTIC FIBER MARKET, BY END-USE INDUSTRY, 2022-2032 ($MILLION)
- TABLE 61. CORNING INCORPORATED: KEY EXECUTIVES
- TABLE 62. CORNING INCORPORATED: COMPANY SNAPSHOT
- TABLE 63. CORNING INCORPORATED: PRODUCT SEGMENTS
- TABLE 64. CORNING INCORPORATED: SERVICE SEGMENTS
- TABLE 65. CORNING INCORPORATED: PRODUCT PORTFOLIO
- TABLE 66. CORNING INCORPORATED: KEY STRATERGIES
- TABLE 67. PRYSMIAN GROUP: KEY EXECUTIVES
- TABLE 68. PRYSMIAN GROUP: COMPANY SNAPSHOT
- TABLE 69. PRYSMIAN GROUP: PRODUCT SEGMENTS
- TABLE 70. PRYSMIAN GROUP: SERVICE SEGMENTS
- TABLE 71. PRYSMIAN GROUP: PRODUCT PORTFOLIO
- TABLE 72. PRYSMIAN GROUP: KEY STRATERGIES
- TABLE 73. SUMITOMO ELECTRIC INDUSTRIES, LTD.: KEY EXECUTIVES
- TABLE 74. SUMITOMO ELECTRIC INDUSTRIES, LTD.: COMPANY SNAPSHOT
- TABLE 75. SUMITOMO ELECTRIC INDUSTRIES, LTD.: PRODUCT SEGMENTS
- TABLE 76. SUMITOMO ELECTRIC INDUSTRIES, LTD.: SERVICE SEGMENTS
- TABLE 77. SUMITOMO ELECTRIC INDUSTRIES, LTD.: PRODUCT PORTFOLIO
- TABLE 78. SUMITOMO ELECTRIC INDUSTRIES, LTD.: KEY STRATERGIES
- TABLE 79. YANGTZE OPTICAL FIBRE AND CABLE JOINT STOCK LIMITED COMPANY: KEY EXECUTIVES
- TABLE 80. YANGTZE OPTICAL FIBRE AND CABLE JOINT STOCK LIMITED COMPANY: COMPANY SNAPSHOT
- TABLE 81. YANGTZE OPTICAL FIBRE AND CABLE JOINT STOCK LIMITED COMPANY: PRODUCT SEGMENTS
- TABLE 82. YANGTZE OPTICAL FIBRE AND CABLE JOINT STOCK LIMITED COMPANY: SERVICE SEGMENTS
- TABLE 83. YANGTZE OPTICAL FIBRE AND CABLE JOINT STOCK LIMITED COMPANY: PRODUCT PORTFOLIO
- TABLE 84. YANGTZE OPTICAL FIBRE AND CABLE JOINT STOCK LIMITED COMPANY: KEY STRATERGIES
- TABLE 85. FUJIKURA LTD.: KEY EXECUTIVES
- TABLE 86. FUJIKURA LTD.: COMPANY SNAPSHOT
- TABLE 87. FUJIKURA LTD.: PRODUCT SEGMENTS
- TABLE 88. FUJIKURA LTD.: SERVICE SEGMENTS
- TABLE 89. FUJIKURA LTD.: PRODUCT PORTFOLIO
- TABLE 90. FUJIKURA LTD.: KEY STRATERGIES
- TABLE 91. LEONI AG: KEY EXECUTIVES
- TABLE 92. LEONI AG: COMPANY SNAPSHOT
- TABLE 93. LEONI AG: PRODUCT SEGMENTS
- TABLE 94. LEONI AG: SERVICE SEGMENTS
- TABLE 95. LEONI AG: PRODUCT PORTFOLIO
- TABLE 96. LEONI AG: KEY STRATERGIES
- TABLE 97. HENGTONG GROUP CO., LTD.: KEY EXECUTIVES
- TABLE 98. HENGTONG GROUP CO., LTD.: COMPANY SNAPSHOT
- TABLE 99. HENGTONG GROUP CO., LTD.: PRODUCT SEGMENTS
- TABLE 100. HENGTONG GROUP CO., LTD.: SERVICE SEGMENTS
- TABLE 101. HENGTONG GROUP CO., LTD.: PRODUCT PORTFOLIO
- TABLE 102. HENGTONG GROUP CO., LTD.: KEY STRATERGIES
- TABLE 103. FINISAR CORPORATION: KEY EXECUTIVES
- TABLE 104. FINISAR CORPORATION: COMPANY SNAPSHOT
- TABLE 105. FINISAR CORPORATION: PRODUCT SEGMENTS
- TABLE 106. FINISAR CORPORATION: SERVICE SEGMENTS
- TABLE 107. FINISAR CORPORATION: PRODUCT PORTFOLIO
- TABLE 108. FINISAR CORPORATION: KEY STRATERGIES
- TABLE 109. PCT INTERNATIONAL, INC.: KEY EXECUTIVES
- TABLE 110. PCT INTERNATIONAL, INC.: COMPANY SNAPSHOT
- TABLE 111. PCT INTERNATIONAL, INC.: PRODUCT SEGMENTS
- TABLE 112. PCT INTERNATIONAL, INC.: SERVICE SEGMENTS
- TABLE 113. PCT INTERNATIONAL, INC.: PRODUCT PORTFOLIO
- TABLE 114. PCT INTERNATIONAL, INC.: KEY STRATERGIES
- TABLE 115. FINOLEX CABLES LTD.: KEY EXECUTIVES
- TABLE 116. FINOLEX CABLES LTD.: COMPANY SNAPSHOT
- TABLE 117. FINOLEX CABLES LTD.: PRODUCT SEGMENTS
- TABLE 118. FINOLEX CABLES LTD.: SERVICE SEGMENTS
- TABLE 119. FINOLEX CABLES LTD.: PRODUCT PORTFOLIO
- TABLE 120. FINOLEX CABLES LTD.: KEY STRATERGIES
LIST OF FIGURES
- FIGURE 01. PLASTIC OPTIC FIBER MARKET, 2022-2032
- FIGURE 02. SEGMENTATION OF PLASTIC OPTIC FIBER MARKET,2022-2032
- FIGURE 03. TOP IMPACTING FACTORS IN PLASTIC OPTIC FIBER MARKET
- FIGURE 04. TOP INVESTMENT POCKETS IN PLASTIC OPTIC FIBER MARKET (2023-2032)
- FIGURE 05. BARGAINING POWER OF SUPPLIERS
- FIGURE 06. BARGAINING POWER OF BUYERS
- FIGURE 07. THREAT OF SUBSTITUTION
- FIGURE 08. THREAT OF SUBSTITUTION
- FIGURE 09. COMPETITIVE RIVALRY
- FIGURE 10. GLOBAL PLASTIC OPTIC FIBER MARKET:DRIVERS, RESTRAINTS AND OPPORTUNITIES
- FIGURE 11. IMPACT OF KEY REGULATION: PLASTIC OPTIC FIBER MARKET
- FIGURE 12. PATENT ANALYSIS BY COMPANY
- FIGURE 13. PATENT ANALYSIS BY COUNTRY
- FIGURE 14. PLASTIC OPTIC FIBER MARKET, BY CABLE TYPE, 2022 AND 2032(%)
- FIGURE 15. COMPARATIVE SHARE ANALYSIS OF PLASTIC OPTIC FIBER MARKET FOR SINGLE MODE, BY COUNTRY 2022 AND 2032(%)
- FIGURE 16. COMPARATIVE SHARE ANALYSIS OF PLASTIC OPTIC FIBER MARKET FOR MULTI MODE, BY COUNTRY 2022 AND 2032(%)
- FIGURE 17. PLASTIC OPTIC FIBER MARKET, BY END-USE INDUSTRY, 2022 AND 2032(%)
- FIGURE 18. COMPARATIVE SHARE ANALYSIS OF PLASTIC OPTIC FIBER MARKET FOR IT AND TELECOMMUNICATION, BY COUNTRY 2022 AND 2032(%)
- FIGURE 19. COMPARATIVE SHARE ANALYSIS OF PLASTIC OPTIC FIBER MARKET FOR ENERGY AND POWER, BY COUNTRY 2022 AND 2032(%)
- FIGURE 20. COMPARATIVE SHARE ANALYSIS OF PLASTIC OPTIC FIBER MARKET FOR HEALTHCARE, BY COUNTRY 2022 AND 2032(%)
- FIGURE 21. COMPARATIVE SHARE ANALYSIS OF PLASTIC OPTIC FIBER MARKET FOR AEROSPACE AND DEFENSE, BY COUNTRY 2022 AND 2032(%)
- FIGURE 22. COMPARATIVE SHARE ANALYSIS OF PLASTIC OPTIC FIBER MARKET FOR OTHERS, BY COUNTRY 2022 AND 2032(%)
- FIGURE 23. PLASTIC OPTIC FIBER MARKET BY REGION, 2022 AND 2032(%)
- FIGURE 24. U.S. PLASTIC OPTIC FIBER MARKET, 2022-2032 ($MILLION)
- FIGURE 25. CANADA PLASTIC OPTIC FIBER MARKET, 2022-2032 ($MILLION)
- FIGURE 26. MEXICO PLASTIC OPTIC FIBER MARKET, 2022-2032 ($MILLION)
- FIGURE 27. GERMANY PLASTIC OPTIC FIBER MARKET, 2022-2032 ($MILLION)
- FIGURE 28. FRANCE PLASTIC OPTIC FIBER MARKET, 2022-2032 ($MILLION)
- FIGURE 29. UK PLASTIC OPTIC FIBER MARKET, 2022-2032 ($MILLION)
- FIGURE 30. SPAIN PLASTIC OPTIC FIBER MARKET, 2022-2032 ($MILLION)
- FIGURE 31. ITALY PLASTIC OPTIC FIBER MARKET, 2022-2032 ($MILLION)
- FIGURE 32. REST OF EUROPE PLASTIC OPTIC FIBER MARKET, 2022-2032 ($MILLION)
- FIGURE 33. CHINA PLASTIC OPTIC FIBER MARKET, 2022-2032 ($MILLION)
- FIGURE 34. INDIA PLASTIC OPTIC FIBER MARKET, 2022-2032 ($MILLION)
- FIGURE 35. JAPAN PLASTIC OPTIC FIBER MARKET, 2022-2032 ($MILLION)
- FIGURE 36. SOUTH KOREA PLASTIC OPTIC FIBER MARKET, 2022-2032 ($MILLION)
- FIGURE 37. AUSTRALIA PLASTIC OPTIC FIBER MARKET, 2022-2032 ($MILLION)
- FIGURE 38. REST OF ASIA-PACIFIC PLASTIC OPTIC FIBER MARKET, 2022-2032 ($MILLION)
- FIGURE 39. BRAZIL PLASTIC OPTIC FIBER MARKET, 2022-2032 ($MILLION)
- FIGURE 40. SOUTH AFRICA PLASTIC OPTIC FIBER MARKET, 2022-2032 ($MILLION)
- FIGURE 41. SAUDI ARABIA PLASTIC OPTIC FIBER MARKET, 2022-2032 ($MILLION)
- FIGURE 42. REST OF LAMEA PLASTIC OPTIC FIBER MARKET, 2022-2032 ($MILLION)
- FIGURE 43. TOP WINNING STRATEGIES, BY YEAR
- FIGURE 44. TOP WINNING STRATEGIES, BY DEVELOPMENT
- FIGURE 45. TOP WINNING STRATEGIES, BY COMPANY
- FIGURE 46. PRODUCT MAPPING OF TOP 10 PLAYERS
- FIGURE 47. COMPETITIVE DASHBOARD
- FIGURE 48. COMPETITIVE HEATMAP: PLASTIC OPTIC FIBER MARKET
- FIGURE 49. TOP PLAYER POSITIONING, 2022

