
PUBLISHER: Allied Market Research | PRODUCT CODE: 1446931

PUBLISHER: Allied Market Research | PRODUCT CODE: 1446931
Gas-to-Liquid Fuels Market By Product Type, By Plant Type, By Technology : Global Opportunity Analysis and Industry Forecast, 2023-2032
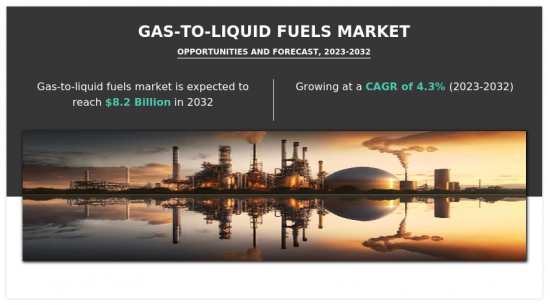
The global gas-to-liquid fuels market was valued at $5.4 billion in 2022, and is projected to reach $8.2 billion by 2032, growing at a CAGR of 4.3% from 2023 to 2032.
The Gas-to-Liquid (GTL) Fuels Market is at the forefront of transforming gaseous hydrocarbons, primarily natural gas, into liquid fuels and chemicals. Employing advanced techniques like Fischer-Tropsch synthesis and methanol synthesis, this industry plays a pivotal role in diversifying energy sources and ensuring the region's energy security. The focus is on optimizing regional gas reserves, making it easier to transport and utilize these transformed resources across key sectors such as transportation, manufacturing, and chemical production.
A primary driver for the gas-to-liquid fuels market is the ongoing shift for fuel diversification among major developed and developing countries. By offering a range of liquid fuels and chemicals derived from natural gas, the industry aims to reduce reliance on conventional oil-based fuels, fostering a more resilient energy portfolio. Energy security goals also drive the gas-to-liquid fuels market, aligning with efforts to decrease dependence on foreign oil imports. Furthermore, continuous technological advancements in processes like Fischer-Tropsch synthesis enhance efficiency, reduce costs, and broaden the range of derived products, making the market more appealing.
Despite its promise, the gas-to-liquid fuels industry faces hindrances, such as the high initial costs associated with establishing facilities. Market demand fluctuations introduce instability and unpredictability, impacting production planning and investment decisions. Environmental concerns, particularly regarding greenhouse gas emissions, impose restrictions on operations, prompting the industry to innovate sustainable methodologies and technologies to address these environmental impacts.
Amidst challenges, the North American gas-to-liquid fuels market presents promising opportunities. Regulatory support advocating cleaner energy sources and sustainable practices creates a favorable environment for growth, encouraging investments and innovation aligned with environmental goals. Innovations in process efficiency offer possibilities for refining GTL processes, reducing costs, and expanding the product range. The growing global demand for cleaner energy positions the industry to provide high-quality, cleaner fuels derived from natural gas.
Beyond North America, the gas-to-liquid fuels industry is gaining traction in other regions. In Europe, countries are exploring GTL technologies to diversify energy sources and reduce reliance on traditional fuels. The Asia-Pacific region, with its surging energy demand, sees GTL as a means of converting abundant natural gas resources into high-value liquid products. In the LAMEA region, particularly the Middle East and Africa, investment in GTL technologies aims to monetize abundant natural gas reserves. Each region faces unique challenges and opportunities, contributing to the global growth and development of the gas-to-liquid fuels market.
The global gas-to-liquid fuels market is segmented into product type, plant type, technology, and country. By product type, the market is divided into GTL diesel, GTL kerosene, GTL gasoline, GTL lubricant, GTL naphtha, and others. On the basis of the plant type, it is bifurcated into small scale and large scale. Depending on technology, the market is categorized into methanol synthesis and fisher-tropsch. Region-wise, the market is studied across North America, Europe, Asia-Pacific, and LAMEA.
The major players operating in the global gas-to-liquid fuels market are Royal Dutch Shell Plc, Chevron Corporation, ExxonMobil Corporation, Sasol Limited, Petroliam Nasional Berhad (PETRONAS), Velocys plc, Gazprom International Limited, PetroChina Company Limited, BP p.l.c., and CompactGTL. Other players include Oryx GTL, Primus Green Energy Inc., PetroSA, InfraLNG, Greyrock Energy, and Fluor Corporation.
Key Benefits For Stakeholders
- This report provides a quantitative analysis of the market segments, current trends, estimations, and dynamics of the gas-to-liquid fuels market analysis from 2022 to 2032 to identify the prevailing gas-to-liquid fuels market opportunities.
- The market research is offered along with information related to key drivers, restraints, and opportunities.
- Porter's five forces analysis highlights the potency of buyers and suppliers to enable stakeholders make profit-oriented business decisions and strengthen their supplier-buyer network.
- In-depth analysis of the gas-to-liquid fuels market segmentation assists to determine the prevailing market opportunities.
- Major countries in each region are mapped according to their revenue contribution to the global market.
- Market player positioning facilitates benchmarking and provides a clear understanding of the present position of the market players.
- The report includes the analysis of the regional as well as global gas-to-liquid fuels market trends, key players, market segments, application areas, and market growth strategies.
Additional benefits you will get with this purchase are:
- Quarterly Update and* (only available with a corporate license, on listed price)
- 5 additional Company Profile of client Choice pre- or Post-purchase, as a free update.
- Free Upcoming Version on the Purchase of Five and Enterprise User License.
- 16 analyst hours of support* (post-purchase, if you find additional data requirements upon review of the report, you may receive support amounting to 16 analyst hours to solve questions, and post-sale queries)
- 15% Free Customization* (in case the scope or segment of the report does not match your requirements, 15% is equivalent to 3 working days of free work, applicable once)
- Free data Pack on the Five and Enterprise User License. (Excel version of the report)
- Free Updated report if the report is 6-12 months old or older.
- 24-hour priority response*
- Free Industry updates and white papers.
Possible Customization with this report (with additional cost and timeline, please talk to the sales executive to know more)
- Manufacturing Capacity
- Investment Opportunities
- Upcoming/New Entrant by Regions
- Technology Trend Analysis
- Regulatory Guidelines
- Strategic Recommedations
- Additional company profiles with specific to client's interest
- Additional country or region analysis- market size and forecast
- Expanded list for Company Profiles
- Historic market data
- Import Export Analysis/Data
- Market share analysis of players at global/region/country level
- Volume Market Size and Forecast
Key Market Segments
By Product Type
- GTL Diesel
- GTL Kerosene
- GTL Gasoline
- GTL Lubricant
- GTL Naphtha
- Others
By Plant Type
- Small-Scale
- Large-Scale
By Technology
- Methanol Synthesis
- Fischer-Tropsch
By Region
- North America
- U.S.
- Canada
- Mexico
- Europe
- Germany
- UK
- France
- Italy
- Spain
- Rest of Europe
- Asia-Pacific
- China
- Japan
- India
- South Korea
- Australia
- Rest of Asia-Pacific
- LAMEA
- Brazil
- Saudi Arabia
- South Africa
- Rest of LAMEA
Key Market Players:
- Shell Plc.
- Chevron Corporation
- ExxonMobil Corporation
- Sasol Limited
- PETROLIAM NASIONAL BERHAD (PETRONAS)
- Velocys plc
- Gazprom International Limited
- PetroChina Company Limited
- BP p.l.c.
- CompactGTL
- Oryx GTL
- Primus Green Energy Inc.
- PetroSA
TABLE OF CONTENTS
CHAPTER 1: INTRODUCTION
- 1.1. Report description
- 1.2. Key market segments
- 1.3. Key benefits to the stakeholders
- 1.4. Research methodology
- 1.4.1. Primary research
- 1.4.2. Secondary research
- 1.4.3. Analyst tools and models
CHAPTER 2: EXECUTIVE SUMMARY
- 2.1. CXO Perspective
CHAPTER 3: MARKET OVERVIEW
- 3.1. Market definition and scope
- 3.2. Key findings
- 3.2.1. Top impacting factors
- 3.2.2. Top investment pockets
- 3.3. Porter's five forces analysis
- 3.4. Market dynamics
- 3.4.1. Drivers
- 3.4.2. Restraints
- 3.4.3. Opportunities
- 3.5. Value Chain Analysis
- 3.6. Key Regulation Analysis
CHAPTER 4: GAS-TO-LIQUID FUELS MARKET, BY PRODUCT TYPE
- 4.1. Overview
- 4.1.1. Market size and forecast
- 4.2. GTL Diesel
- 4.2.1. Key market trends, growth factors and opportunities
- 4.2.2. Market size and forecast, by region
- 4.2.3. Market share analysis by country
- 4.3. GTL Kerosene
- 4.3.1. Key market trends, growth factors and opportunities
- 4.3.2. Market size and forecast, by region
- 4.3.3. Market share analysis by country
- 4.4. GTL Gasoline
- 4.4.1. Key market trends, growth factors and opportunities
- 4.4.2. Market size and forecast, by region
- 4.4.3. Market share analysis by country
- 4.5. GTL Lubricant
- 4.5.1. Key market trends, growth factors and opportunities
- 4.5.2. Market size and forecast, by region
- 4.5.3. Market share analysis by country
- 4.6. GTL Naphtha
- 4.6.1. Key market trends, growth factors and opportunities
- 4.6.2. Market size and forecast, by region
- 4.6.3. Market share analysis by country
- 4.7. Others
- 4.7.1. Key market trends, growth factors and opportunities
- 4.7.2. Market size and forecast, by region
- 4.7.3. Market share analysis by country
CHAPTER 5: GAS-TO-LIQUID FUELS MARKET, BY PLANT TYPE
- 5.1. Overview
- 5.1.1. Market size and forecast
- 5.2. Small-Scale
- 5.2.1. Key market trends, growth factors and opportunities
- 5.2.2. Market size and forecast, by region
- 5.2.3. Market share analysis by country
- 5.3. Large-Scale
- 5.3.1. Key market trends, growth factors and opportunities
- 5.3.2. Market size and forecast, by region
- 5.3.3. Market share analysis by country
CHAPTER 6: GAS-TO-LIQUID FUELS MARKET, BY TECHNOLOGY
- 6.1. Overview
- 6.1.1. Market size and forecast
- 6.2. Methanol Synthesis
- 6.2.1. Key market trends, growth factors and opportunities
- 6.2.2. Market size and forecast, by region
- 6.2.3. Market share analysis by country
- 6.3. Fischer-Tropsch
- 6.3.1. Key market trends, growth factors and opportunities
- 6.3.2. Market size and forecast, by region
- 6.3.3. Market share analysis by country
CHAPTER 7: GAS-TO-LIQUID FUELS MARKET, BY REGION
- 7.1. Overview
- 7.1.1. Market size and forecast By Region
- 7.2. North America
- 7.2.1. Key market trends, growth factors and opportunities
- 7.2.2. Market size and forecast, by Product Type
- 7.2.3. Market size and forecast, by Plant Type
- 7.2.4. Market size and forecast, by Technology
- 7.2.5. Market size and forecast, by country
- 7.2.5.1. U.S.
- 7.2.5.1.1. Market size and forecast, by Product Type
- 7.2.5.1.2. Market size and forecast, by Plant Type
- 7.2.5.1.3. Market size and forecast, by Technology
- 7.2.5.2. Canada
- 7.2.5.2.1. Market size and forecast, by Product Type
- 7.2.5.2.2. Market size and forecast, by Plant Type
- 7.2.5.2.3. Market size and forecast, by Technology
- 7.2.5.3. Mexico
- 7.2.5.3.1. Market size and forecast, by Product Type
- 7.2.5.3.2. Market size and forecast, by Plant Type
- 7.2.5.3.3. Market size and forecast, by Technology
- 7.3. Europe
- 7.3.1. Key market trends, growth factors and opportunities
- 7.3.2. Market size and forecast, by Product Type
- 7.3.3. Market size and forecast, by Plant Type
- 7.3.4. Market size and forecast, by Technology
- 7.3.5. Market size and forecast, by country
- 7.3.5.1. Germany
- 7.3.5.1.1. Market size and forecast, by Product Type
- 7.3.5.1.2. Market size and forecast, by Plant Type
- 7.3.5.1.3. Market size and forecast, by Technology
- 7.3.5.2. UK
- 7.3.5.2.1. Market size and forecast, by Product Type
- 7.3.5.2.2. Market size and forecast, by Plant Type
- 7.3.5.2.3. Market size and forecast, by Technology
- 7.3.5.3. France
- 7.3.5.3.1. Market size and forecast, by Product Type
- 7.3.5.3.2. Market size and forecast, by Plant Type
- 7.3.5.3.3. Market size and forecast, by Technology
- 7.3.5.4. Italy
- 7.3.5.4.1. Market size and forecast, by Product Type
- 7.3.5.4.2. Market size and forecast, by Plant Type
- 7.3.5.4.3. Market size and forecast, by Technology
- 7.3.5.5. Spain
- 7.3.5.5.1. Market size and forecast, by Product Type
- 7.3.5.5.2. Market size and forecast, by Plant Type
- 7.3.5.5.3. Market size and forecast, by Technology
- 7.3.5.6. Rest of Europe
- 7.3.5.6.1. Market size and forecast, by Product Type
- 7.3.5.6.2. Market size and forecast, by Plant Type
- 7.3.5.6.3. Market size and forecast, by Technology
- 7.4. Asia-Pacific
- 7.4.1. Key market trends, growth factors and opportunities
- 7.4.2. Market size and forecast, by Product Type
- 7.4.3. Market size and forecast, by Plant Type
- 7.4.4. Market size and forecast, by Technology
- 7.4.5. Market size and forecast, by country
- 7.4.5.1. China
- 7.4.5.1.1. Market size and forecast, by Product Type
- 7.4.5.1.2. Market size and forecast, by Plant Type
- 7.4.5.1.3. Market size and forecast, by Technology
- 7.4.5.2. Japan
- 7.4.5.2.1. Market size and forecast, by Product Type
- 7.4.5.2.2. Market size and forecast, by Plant Type
- 7.4.5.2.3. Market size and forecast, by Technology
- 7.4.5.3. India
- 7.4.5.3.1. Market size and forecast, by Product Type
- 7.4.5.3.2. Market size and forecast, by Plant Type
- 7.4.5.3.3. Market size and forecast, by Technology
- 7.4.5.4. South Korea
- 7.4.5.4.1. Market size and forecast, by Product Type
- 7.4.5.4.2. Market size and forecast, by Plant Type
- 7.4.5.4.3. Market size and forecast, by Technology
- 7.4.5.5. Australia
- 7.4.5.5.1. Market size and forecast, by Product Type
- 7.4.5.5.2. Market size and forecast, by Plant Type
- 7.4.5.5.3. Market size and forecast, by Technology
- 7.4.5.6. Rest of Asia-Pacific
- 7.4.5.6.1. Market size and forecast, by Product Type
- 7.4.5.6.2. Market size and forecast, by Plant Type
- 7.4.5.6.3. Market size and forecast, by Technology
- 7.5. LAMEA
- 7.5.1. Key market trends, growth factors and opportunities
- 7.5.2. Market size and forecast, by Product Type
- 7.5.3. Market size and forecast, by Plant Type
- 7.5.4. Market size and forecast, by Technology
- 7.5.5. Market size and forecast, by country
- 7.5.5.1. Brazil
- 7.5.5.1.1. Market size and forecast, by Product Type
- 7.5.5.1.2. Market size and forecast, by Plant Type
- 7.5.5.1.3. Market size and forecast, by Technology
- 7.5.5.2. Saudi Arabia
- 7.5.5.2.1. Market size and forecast, by Product Type
- 7.5.5.2.2. Market size and forecast, by Plant Type
- 7.5.5.2.3. Market size and forecast, by Technology
- 7.5.5.3. South Africa
- 7.5.5.3.1. Market size and forecast, by Product Type
- 7.5.5.3.2. Market size and forecast, by Plant Type
- 7.5.5.3.3. Market size and forecast, by Technology
- 7.5.5.4. Rest of LAMEA
- 7.5.5.4.1. Market size and forecast, by Product Type
- 7.5.5.4.2. Market size and forecast, by Plant Type
- 7.5.5.4.3. Market size and forecast, by Technology
CHAPTER 8: COMPETITIVE LANDSCAPE
- 8.1. Introduction
- 8.2. Top winning strategies
- 8.3. Product mapping of top 10 player
- 8.4. Competitive dashboard
- 8.5. Competitive heatmap
- 8.6. Top player positioning, 2022
CHAPTER 9: COMPANY PROFILES
- 9.1. Shell Plc.
- 9.1.1. Company overview
- 9.1.2. Key executives
- 9.1.3. Company snapshot
- 9.1.4. Operating business segments
- 9.1.5. Product portfolio
- 9.1.6. Business performance
- 9.1.7. Key strategic moves and developments
- 9.2. Chevron Corporation
- 9.2.1. Company overview
- 9.2.2. Key executives
- 9.2.3. Company snapshot
- 9.2.4. Operating business segments
- 9.2.5. Product portfolio
- 9.2.6. Business performance
- 9.2.7. Key strategic moves and developments
- 9.3. ExxonMobil Corporation
- 9.3.1. Company overview
- 9.3.2. Key executives
- 9.3.3. Company snapshot
- 9.3.4. Operating business segments
- 9.3.5. Product portfolio
- 9.3.6. Business performance
- 9.3.7. Key strategic moves and developments
- 9.4. Sasol Limited
- 9.4.1. Company overview
- 9.4.2. Key executives
- 9.4.3. Company snapshot
- 9.4.4. Operating business segments
- 9.4.5. Product portfolio
- 9.4.6. Business performance
- 9.4.7. Key strategic moves and developments
- 9.5. PETROLIAM NASIONAL BERHAD (PETRONAS)
- 9.5.1. Company overview
- 9.5.2. Key executives
- 9.5.3. Company snapshot
- 9.5.4. Operating business segments
- 9.5.5. Product portfolio
- 9.5.6. Business performance
- 9.5.7. Key strategic moves and developments
- 9.6. Velocys plc
- 9.6.1. Company overview
- 9.6.2. Key executives
- 9.6.3. Company snapshot
- 9.6.4. Operating business segments
- 9.6.5. Product portfolio
- 9.6.6. Business performance
- 9.6.7. Key strategic moves and developments
- 9.7. Gazprom International Limited
- 9.7.1. Company overview
- 9.7.2. Key executives
- 9.7.3. Company snapshot
- 9.7.4. Operating business segments
- 9.7.5. Product portfolio
- 9.7.6. Business performance
- 9.7.7. Key strategic moves and developments
- 9.8. PetroChina Company Limited
- 9.8.1. Company overview
- 9.8.2. Key executives
- 9.8.3. Company snapshot
- 9.8.4. Operating business segments
- 9.8.5. Product portfolio
- 9.8.6. Business performance
- 9.8.7. Key strategic moves and developments
- 9.9. BP p.l.c.
- 9.9.1. Company overview
- 9.9.2. Key executives
- 9.9.3. Company snapshot
- 9.9.4. Operating business segments
- 9.9.5. Product portfolio
- 9.9.6. Business performance
- 9.9.7. Key strategic moves and developments
- 9.10. CompactGTL
- 9.10.1. Company overview
- 9.10.2. Key executives
- 9.10.3. Company snapshot
- 9.10.4. Operating business segments
- 9.10.5. Product portfolio
- 9.10.6. Business performance
- 9.10.7. Key strategic moves and developments
- 9.11. Oryx GTL
- 9.11.1. Company overview
- 9.11.2. Key executives
- 9.11.3. Company snapshot
- 9.11.4. Operating business segments
- 9.11.5. Product portfolio
- 9.11.6. Business performance
- 9.11.7. Key strategic moves and developments
- 9.12. Primus Green Energy Inc.
- 9.12.1. Company overview
- 9.12.2. Key executives
- 9.12.3. Company snapshot
- 9.12.4. Operating business segments
- 9.12.5. Product portfolio
- 9.12.6. Business performance
- 9.12.7. Key strategic moves and developments
- 9.13. PetroSA
- 9.13.1. Company overview
- 9.13.2. Key executives
- 9.13.3. Company snapshot
- 9.13.4. Operating business segments
- 9.13.5. Product portfolio
- 9.13.6. Business performance
- 9.13.7. Key strategic moves and developments
LIST OF TABLES
- TABLE 01. GLOBAL GAS-TO-LIQUID FUELS MARKET, BY PRODUCT TYPE, 2022-2032 ($MILLION)
- TABLE 02. GAS-TO-LIQUID FUELS MARKET FOR GTL DIESEL, BY REGION, 2022-2032 ($MILLION)
- TABLE 03. GAS-TO-LIQUID FUELS MARKET FOR GTL KEROSENE, BY REGION, 2022-2032 ($MILLION)
- TABLE 04. GAS-TO-LIQUID FUELS MARKET FOR GTL GASOLINE, BY REGION, 2022-2032 ($MILLION)
- TABLE 05. GAS-TO-LIQUID FUELS MARKET FOR GTL LUBRICANT, BY REGION, 2022-2032 ($MILLION)
- TABLE 06. GAS-TO-LIQUID FUELS MARKET FOR GTL NAPHTHA, BY REGION, 2022-2032 ($MILLION)
- TABLE 07. GAS-TO-LIQUID FUELS MARKET FOR OTHERS, BY REGION, 2022-2032 ($MILLION)
- TABLE 08. GLOBAL GAS-TO-LIQUID FUELS MARKET, BY PLANT TYPE, 2022-2032 ($MILLION)
- TABLE 09. GAS-TO-LIQUID FUELS MARKET FOR SMALL-SCALE, BY REGION, 2022-2032 ($MILLION)
- TABLE 10. GAS-TO-LIQUID FUELS MARKET FOR LARGE-SCALE, BY REGION, 2022-2032 ($MILLION)
- TABLE 11. GLOBAL GAS-TO-LIQUID FUELS MARKET, BY TECHNOLOGY, 2022-2032 ($MILLION)
- TABLE 12. GAS-TO-LIQUID FUELS MARKET FOR METHANOL SYNTHESIS, BY REGION, 2022-2032 ($MILLION)
- TABLE 13. GAS-TO-LIQUID FUELS MARKET FOR FISCHER-TROPSCH, BY REGION, 2022-2032 ($MILLION)
- TABLE 14. GAS-TO-LIQUID FUELS MARKET, BY REGION, 2022-2032 ($MILLION)
- TABLE 15. NORTH AMERICA GAS-TO-LIQUID FUELS MARKET, BY PRODUCT TYPE, 2022-2032 ($MILLION)
- TABLE 16. NORTH AMERICA GAS-TO-LIQUID FUELS MARKET, BY PLANT TYPE, 2022-2032 ($MILLION)
- TABLE 17. NORTH AMERICA GAS-TO-LIQUID FUELS MARKET, BY TECHNOLOGY, 2022-2032 ($MILLION)
- TABLE 18. NORTH AMERICA GAS-TO-LIQUID FUELS MARKET, BY COUNTRY, 2022-2032 ($MILLION)
- TABLE 19. U.S. GAS-TO-LIQUID FUELS MARKET, BY PRODUCT TYPE, 2022-2032 ($MILLION)
- TABLE 20. U.S. GAS-TO-LIQUID FUELS MARKET, BY PLANT TYPE, 2022-2032 ($MILLION)
- TABLE 21. U.S. GAS-TO-LIQUID FUELS MARKET, BY TECHNOLOGY, 2022-2032 ($MILLION)
- TABLE 22. CANADA GAS-TO-LIQUID FUELS MARKET, BY PRODUCT TYPE, 2022-2032 ($MILLION)
- TABLE 23. CANADA GAS-TO-LIQUID FUELS MARKET, BY PLANT TYPE, 2022-2032 ($MILLION)
- TABLE 24. CANADA GAS-TO-LIQUID FUELS MARKET, BY TECHNOLOGY, 2022-2032 ($MILLION)
- TABLE 25. MEXICO GAS-TO-LIQUID FUELS MARKET, BY PRODUCT TYPE, 2022-2032 ($MILLION)
- TABLE 26. MEXICO GAS-TO-LIQUID FUELS MARKET, BY PLANT TYPE, 2022-2032 ($MILLION)
- TABLE 27. MEXICO GAS-TO-LIQUID FUELS MARKET, BY TECHNOLOGY, 2022-2032 ($MILLION)
- TABLE 28. EUROPE GAS-TO-LIQUID FUELS MARKET, BY PRODUCT TYPE, 2022-2032 ($MILLION)
- TABLE 29. EUROPE GAS-TO-LIQUID FUELS MARKET, BY PLANT TYPE, 2022-2032 ($MILLION)
- TABLE 30. EUROPE GAS-TO-LIQUID FUELS MARKET, BY TECHNOLOGY, 2022-2032 ($MILLION)
- TABLE 31. EUROPE GAS-TO-LIQUID FUELS MARKET, BY COUNTRY, 2022-2032 ($MILLION)
- TABLE 32. GERMANY GAS-TO-LIQUID FUELS MARKET, BY PRODUCT TYPE, 2022-2032 ($MILLION)
- TABLE 33. GERMANY GAS-TO-LIQUID FUELS MARKET, BY PLANT TYPE, 2022-2032 ($MILLION)
- TABLE 34. GERMANY GAS-TO-LIQUID FUELS MARKET, BY TECHNOLOGY, 2022-2032 ($MILLION)
- TABLE 35. UK GAS-TO-LIQUID FUELS MARKET, BY PRODUCT TYPE, 2022-2032 ($MILLION)
- TABLE 36. UK GAS-TO-LIQUID FUELS MARKET, BY PLANT TYPE, 2022-2032 ($MILLION)
- TABLE 37. UK GAS-TO-LIQUID FUELS MARKET, BY TECHNOLOGY, 2022-2032 ($MILLION)
- TABLE 38. FRANCE GAS-TO-LIQUID FUELS MARKET, BY PRODUCT TYPE, 2022-2032 ($MILLION)
- TABLE 39. FRANCE GAS-TO-LIQUID FUELS MARKET, BY PLANT TYPE, 2022-2032 ($MILLION)
- TABLE 40. FRANCE GAS-TO-LIQUID FUELS MARKET, BY TECHNOLOGY, 2022-2032 ($MILLION)
- TABLE 41. ITALY GAS-TO-LIQUID FUELS MARKET, BY PRODUCT TYPE, 2022-2032 ($MILLION)
- TABLE 42. ITALY GAS-TO-LIQUID FUELS MARKET, BY PLANT TYPE, 2022-2032 ($MILLION)
- TABLE 43. ITALY GAS-TO-LIQUID FUELS MARKET, BY TECHNOLOGY, 2022-2032 ($MILLION)
- TABLE 44. SPAIN GAS-TO-LIQUID FUELS MARKET, BY PRODUCT TYPE, 2022-2032 ($MILLION)
- TABLE 45. SPAIN GAS-TO-LIQUID FUELS MARKET, BY PLANT TYPE, 2022-2032 ($MILLION)
- TABLE 46. SPAIN GAS-TO-LIQUID FUELS MARKET, BY TECHNOLOGY, 2022-2032 ($MILLION)
- TABLE 47. REST OF EUROPE GAS-TO-LIQUID FUELS MARKET, BY PRODUCT TYPE, 2022-2032 ($MILLION)
- TABLE 48. REST OF EUROPE GAS-TO-LIQUID FUELS MARKET, BY PLANT TYPE, 2022-2032 ($MILLION)
- TABLE 49. REST OF EUROPE GAS-TO-LIQUID FUELS MARKET, BY TECHNOLOGY, 2022-2032 ($MILLION)
- TABLE 50. ASIA-PACIFIC GAS-TO-LIQUID FUELS MARKET, BY PRODUCT TYPE, 2022-2032 ($MILLION)
- TABLE 51. ASIA-PACIFIC GAS-TO-LIQUID FUELS MARKET, BY PLANT TYPE, 2022-2032 ($MILLION)
- TABLE 52. ASIA-PACIFIC GAS-TO-LIQUID FUELS MARKET, BY TECHNOLOGY, 2022-2032 ($MILLION)
- TABLE 53. ASIA-PACIFIC GAS-TO-LIQUID FUELS MARKET, BY COUNTRY, 2022-2032 ($MILLION)
- TABLE 54. CHINA GAS-TO-LIQUID FUELS MARKET, BY PRODUCT TYPE, 2022-2032 ($MILLION)
- TABLE 55. CHINA GAS-TO-LIQUID FUELS MARKET, BY PLANT TYPE, 2022-2032 ($MILLION)
- TABLE 56. CHINA GAS-TO-LIQUID FUELS MARKET, BY TECHNOLOGY, 2022-2032 ($MILLION)
- TABLE 57. JAPAN GAS-TO-LIQUID FUELS MARKET, BY PRODUCT TYPE, 2022-2032 ($MILLION)
- TABLE 58. JAPAN GAS-TO-LIQUID FUELS MARKET, BY PLANT TYPE, 2022-2032 ($MILLION)
- TABLE 59. JAPAN GAS-TO-LIQUID FUELS MARKET, BY TECHNOLOGY, 2022-2032 ($MILLION)
- TABLE 60. INDIA GAS-TO-LIQUID FUELS MARKET, BY PRODUCT TYPE, 2022-2032 ($MILLION)
- TABLE 61. INDIA GAS-TO-LIQUID FUELS MARKET, BY PLANT TYPE, 2022-2032 ($MILLION)
- TABLE 62. INDIA GAS-TO-LIQUID FUELS MARKET, BY TECHNOLOGY, 2022-2032 ($MILLION)
- TABLE 63. SOUTH KOREA GAS-TO-LIQUID FUELS MARKET, BY PRODUCT TYPE, 2022-2032 ($MILLION)
- TABLE 64. SOUTH KOREA GAS-TO-LIQUID FUELS MARKET, BY PLANT TYPE, 2022-2032 ($MILLION)
- TABLE 65. SOUTH KOREA GAS-TO-LIQUID FUELS MARKET, BY TECHNOLOGY, 2022-2032 ($MILLION)
- TABLE 66. AUSTRALIA GAS-TO-LIQUID FUELS MARKET, BY PRODUCT TYPE, 2022-2032 ($MILLION)
- TABLE 67. AUSTRALIA GAS-TO-LIQUID FUELS MARKET, BY PLANT TYPE, 2022-2032 ($MILLION)
- TABLE 68. AUSTRALIA GAS-TO-LIQUID FUELS MARKET, BY TECHNOLOGY, 2022-2032 ($MILLION)
- TABLE 69. REST OF ASIA-PACIFIC GAS-TO-LIQUID FUELS MARKET, BY PRODUCT TYPE, 2022-2032 ($MILLION)
- TABLE 70. REST OF ASIA-PACIFIC GAS-TO-LIQUID FUELS MARKET, BY PLANT TYPE, 2022-2032 ($MILLION)
- TABLE 71. REST OF ASIA-PACIFIC GAS-TO-LIQUID FUELS MARKET, BY TECHNOLOGY, 2022-2032 ($MILLION)
- TABLE 72. LAMEA GAS-TO-LIQUID FUELS MARKET, BY PRODUCT TYPE, 2022-2032 ($MILLION)
- TABLE 73. LAMEA GAS-TO-LIQUID FUELS MARKET, BY PLANT TYPE, 2022-2032 ($MILLION)
- TABLE 74. LAMEA GAS-TO-LIQUID FUELS MARKET, BY TECHNOLOGY, 2022-2032 ($MILLION)
- TABLE 75. LAMEA GAS-TO-LIQUID FUELS MARKET, BY COUNTRY, 2022-2032 ($MILLION)
- TABLE 76. BRAZIL GAS-TO-LIQUID FUELS MARKET, BY PRODUCT TYPE, 2022-2032 ($MILLION)
- TABLE 77. BRAZIL GAS-TO-LIQUID FUELS MARKET, BY PLANT TYPE, 2022-2032 ($MILLION)
- TABLE 78. BRAZIL GAS-TO-LIQUID FUELS MARKET, BY TECHNOLOGY, 2022-2032 ($MILLION)
- TABLE 79. SAUDI ARABIA GAS-TO-LIQUID FUELS MARKET, BY PRODUCT TYPE, 2022-2032 ($MILLION)
- TABLE 80. SAUDI ARABIA GAS-TO-LIQUID FUELS MARKET, BY PLANT TYPE, 2022-2032 ($MILLION)
- TABLE 81. SAUDI ARABIA GAS-TO-LIQUID FUELS MARKET, BY TECHNOLOGY, 2022-2032 ($MILLION)
- TABLE 82. SOUTH AFRICA GAS-TO-LIQUID FUELS MARKET, BY PRODUCT TYPE, 2022-2032 ($MILLION)
- TABLE 83. SOUTH AFRICA GAS-TO-LIQUID FUELS MARKET, BY PLANT TYPE, 2022-2032 ($MILLION)
- TABLE 84. SOUTH AFRICA GAS-TO-LIQUID FUELS MARKET, BY TECHNOLOGY, 2022-2032 ($MILLION)
- TABLE 85. REST OF LAMEA GAS-TO-LIQUID FUELS MARKET, BY PRODUCT TYPE, 2022-2032 ($MILLION)
- TABLE 86. REST OF LAMEA GAS-TO-LIQUID FUELS MARKET, BY PLANT TYPE, 2022-2032 ($MILLION)
- TABLE 87. REST OF LAMEA GAS-TO-LIQUID FUELS MARKET, BY TECHNOLOGY, 2022-2032 ($MILLION)
- TABLE 88. SHELL PLC.: KEY EXECUTIVES
- TABLE 89. SHELL PLC.: COMPANY SNAPSHOT
- TABLE 90. SHELL PLC.: PRODUCT SEGMENTS
- TABLE 91. SHELL PLC.: SERVICE SEGMENTS
- TABLE 92. SHELL PLC.: PRODUCT PORTFOLIO
- TABLE 93. SHELL PLC.: KEY STRATERGIES
- TABLE 94. CHEVRON CORPORATION: KEY EXECUTIVES
- TABLE 95. CHEVRON CORPORATION: COMPANY SNAPSHOT
- TABLE 96. CHEVRON CORPORATION: PRODUCT SEGMENTS
- TABLE 97. CHEVRON CORPORATION: SERVICE SEGMENTS
- TABLE 98. CHEVRON CORPORATION: PRODUCT PORTFOLIO
- TABLE 99. CHEVRON CORPORATION: KEY STRATERGIES
- TABLE 100. EXXONMOBIL CORPORATION: KEY EXECUTIVES
- TABLE 101. EXXONMOBIL CORPORATION: COMPANY SNAPSHOT
- TABLE 102. EXXONMOBIL CORPORATION: PRODUCT SEGMENTS
- TABLE 103. EXXONMOBIL CORPORATION: SERVICE SEGMENTS
- TABLE 104. EXXONMOBIL CORPORATION: PRODUCT PORTFOLIO
- TABLE 105. EXXONMOBIL CORPORATION: KEY STRATERGIES
- TABLE 106. SASOL LIMITED: KEY EXECUTIVES
- TABLE 107. SASOL LIMITED: COMPANY SNAPSHOT
- TABLE 108. SASOL LIMITED: PRODUCT SEGMENTS
- TABLE 109. SASOL LIMITED: SERVICE SEGMENTS
- TABLE 110. SASOL LIMITED: PRODUCT PORTFOLIO
- TABLE 111. SASOL LIMITED: KEY STRATERGIES
- TABLE 112. PETROLIAM NASIONAL BERHAD (PETRONAS): KEY EXECUTIVES
- TABLE 113. PETROLIAM NASIONAL BERHAD (PETRONAS): COMPANY SNAPSHOT
- TABLE 114. PETROLIAM NASIONAL BERHAD (PETRONAS): PRODUCT SEGMENTS
- TABLE 115. PETROLIAM NASIONAL BERHAD (PETRONAS): SERVICE SEGMENTS
- TABLE 116. PETROLIAM NASIONAL BERHAD (PETRONAS): PRODUCT PORTFOLIO
- TABLE 117. PETROLIAM NASIONAL BERHAD (PETRONAS): KEY STRATERGIES
- TABLE 118. VELOCYS PLC: KEY EXECUTIVES
- TABLE 119. VELOCYS PLC: COMPANY SNAPSHOT
- TABLE 120. VELOCYS PLC: PRODUCT SEGMENTS
- TABLE 121. VELOCYS PLC: SERVICE SEGMENTS
- TABLE 122. VELOCYS PLC: PRODUCT PORTFOLIO
- TABLE 123. VELOCYS PLC: KEY STRATERGIES
- TABLE 124. GAZPROM INTERNATIONAL LIMITED: KEY EXECUTIVES
- TABLE 125. GAZPROM INTERNATIONAL LIMITED: COMPANY SNAPSHOT
- TABLE 126. GAZPROM INTERNATIONAL LIMITED: PRODUCT SEGMENTS
- TABLE 127. GAZPROM INTERNATIONAL LIMITED: SERVICE SEGMENTS
- TABLE 128. GAZPROM INTERNATIONAL LIMITED: PRODUCT PORTFOLIO
- TABLE 129. GAZPROM INTERNATIONAL LIMITED: KEY STRATERGIES
- TABLE 130. PETROCHINA COMPANY LIMITED: KEY EXECUTIVES
- TABLE 131. PETROCHINA COMPANY LIMITED: COMPANY SNAPSHOT
- TABLE 132. PETROCHINA COMPANY LIMITED: PRODUCT SEGMENTS
- TABLE 133. PETROCHINA COMPANY LIMITED: SERVICE SEGMENTS
- TABLE 134. PETROCHINA COMPANY LIMITED: PRODUCT PORTFOLIO
- TABLE 135. PETROCHINA COMPANY LIMITED: KEY STRATERGIES
- TABLE 136. BP P.L.C.: KEY EXECUTIVES
- TABLE 137. BP P.L.C.: COMPANY SNAPSHOT
- TABLE 138. BP P.L.C.: PRODUCT SEGMENTS
- TABLE 139. BP P.L.C.: SERVICE SEGMENTS
- TABLE 140. BP P.L.C.: PRODUCT PORTFOLIO
- TABLE 141. BP P.L.C.: KEY STRATERGIES
- TABLE 142. COMPACTGTL: KEY EXECUTIVES
- TABLE 143. COMPACTGTL: COMPANY SNAPSHOT
- TABLE 144. COMPACTGTL: PRODUCT SEGMENTS
- TABLE 145. COMPACTGTL: SERVICE SEGMENTS
- TABLE 146. COMPACTGTL: PRODUCT PORTFOLIO
- TABLE 147. COMPACTGTL: KEY STRATERGIES
- TABLE 148. ORYX GTL: KEY EXECUTIVES
- TABLE 149. ORYX GTL: COMPANY SNAPSHOT
- TABLE 150. ORYX GTL: PRODUCT SEGMENTS
- TABLE 151. ORYX GTL: SERVICE SEGMENTS
- TABLE 152. ORYX GTL: PRODUCT PORTFOLIO
- TABLE 153. ORYX GTL: KEY STRATERGIES
- TABLE 154. PRIMUS GREEN ENERGY INC.: KEY EXECUTIVES
- TABLE 155. PRIMUS GREEN ENERGY INC.: COMPANY SNAPSHOT
- TABLE 156. PRIMUS GREEN ENERGY INC.: PRODUCT SEGMENTS
- TABLE 157. PRIMUS GREEN ENERGY INC.: SERVICE SEGMENTS
- TABLE 158. PRIMUS GREEN ENERGY INC.: PRODUCT PORTFOLIO
- TABLE 159. PRIMUS GREEN ENERGY INC.: KEY STRATERGIES
- TABLE 160. PETROSA: KEY EXECUTIVES
- TABLE 161. PETROSA: COMPANY SNAPSHOT
- TABLE 162. PETROSA: PRODUCT SEGMENTS
- TABLE 163. PETROSA: SERVICE SEGMENTS
- TABLE 164. PETROSA: PRODUCT PORTFOLIO
- TABLE 165. PETROSA: KEY STRATERGIES
LIST OF FIGURES
- FIGURE 01. GAS-TO-LIQUID FUELS MARKET, 2022-2032
- FIGURE 02. SEGMENTATION OF GAS-TO-LIQUID FUELS MARKET,2022-2032
- FIGURE 03. TOP IMPACTING FACTORS IN GAS-TO-LIQUID FUELS MARKET
- FIGURE 04. TOP INVESTMENT POCKETS IN GAS-TO-LIQUID FUELS MARKET (2023-2032)
- FIGURE 05. BARGAINING POWER OF SUPPLIERS
- FIGURE 06. BARGAINING POWER OF BUYERS
- FIGURE 07. THREAT OF SUBSTITUTION
- FIGURE 08. THREAT OF SUBSTITUTION
- FIGURE 09. COMPETITIVE RIVALRY
- FIGURE 10. GLOBAL GAS-TO-LIQUID FUELS MARKET:DRIVERS, RESTRAINTS AND OPPORTUNITIES
- FIGURE 11. IMPACT OF KEY REGULATION: GAS-TO-LIQUID FUELS MARKET
- FIGURE 12. GAS-TO-LIQUID FUELS MARKET, BY PRODUCT TYPE, 2022 AND 2032(%)
- FIGURE 13. COMPARATIVE SHARE ANALYSIS OF GAS-TO-LIQUID FUELS MARKET FOR GTL DIESEL, BY COUNTRY 2022 AND 2032(%)
- FIGURE 14. COMPARATIVE SHARE ANALYSIS OF GAS-TO-LIQUID FUELS MARKET FOR GTL KEROSENE, BY COUNTRY 2022 AND 2032(%)
- FIGURE 15. COMPARATIVE SHARE ANALYSIS OF GAS-TO-LIQUID FUELS MARKET FOR GTL GASOLINE, BY COUNTRY 2022 AND 2032(%)
- FIGURE 16. COMPARATIVE SHARE ANALYSIS OF GAS-TO-LIQUID FUELS MARKET FOR GTL LUBRICANT, BY COUNTRY 2022 AND 2032(%)
- FIGURE 17. COMPARATIVE SHARE ANALYSIS OF GAS-TO-LIQUID FUELS MARKET FOR GTL NAPHTHA, BY COUNTRY 2022 AND 2032(%)
- FIGURE 18. COMPARATIVE SHARE ANALYSIS OF GAS-TO-LIQUID FUELS MARKET FOR OTHERS, BY COUNTRY 2022 AND 2032(%)
- FIGURE 19. GAS-TO-LIQUID FUELS MARKET, BY PLANT TYPE, 2022 AND 2032(%)
- FIGURE 20. COMPARATIVE SHARE ANALYSIS OF GAS-TO-LIQUID FUELS MARKET FOR SMALL-SCALE, BY COUNTRY 2022 AND 2032(%)
- FIGURE 21. COMPARATIVE SHARE ANALYSIS OF GAS-TO-LIQUID FUELS MARKET FOR LARGE-SCALE, BY COUNTRY 2022 AND 2032(%)
- FIGURE 22. GAS-TO-LIQUID FUELS MARKET, BY TECHNOLOGY, 2022 AND 2032(%)
- FIGURE 23. COMPARATIVE SHARE ANALYSIS OF GAS-TO-LIQUID FUELS MARKET FOR METHANOL SYNTHESIS, BY COUNTRY 2022 AND 2032(%)
- FIGURE 24. COMPARATIVE SHARE ANALYSIS OF GAS-TO-LIQUID FUELS MARKET FOR FISCHER-TROPSCH, BY COUNTRY 2022 AND 2032(%)
- FIGURE 25. GAS-TO-LIQUID FUELS MARKET BY REGION, 2022 AND 2032(%)
- FIGURE 26. U.S. GAS-TO-LIQUID FUELS MARKET, 2022-2032 ($MILLION)
- FIGURE 27. CANADA GAS-TO-LIQUID FUELS MARKET, 2022-2032 ($MILLION)
- FIGURE 28. MEXICO GAS-TO-LIQUID FUELS MARKET, 2022-2032 ($MILLION)
- FIGURE 29. GERMANY GAS-TO-LIQUID FUELS MARKET, 2022-2032 ($MILLION)
- FIGURE 30. UK GAS-TO-LIQUID FUELS MARKET, 2022-2032 ($MILLION)
- FIGURE 31. FRANCE GAS-TO-LIQUID FUELS MARKET, 2022-2032 ($MILLION)
- FIGURE 32. ITALY GAS-TO-LIQUID FUELS MARKET, 2022-2032 ($MILLION)
- FIGURE 33. SPAIN GAS-TO-LIQUID FUELS MARKET, 2022-2032 ($MILLION)
- FIGURE 34. REST OF EUROPE GAS-TO-LIQUID FUELS MARKET, 2022-2032 ($MILLION)
- FIGURE 35. CHINA GAS-TO-LIQUID FUELS MARKET, 2022-2032 ($MILLION)
- FIGURE 36. JAPAN GAS-TO-LIQUID FUELS MARKET, 2022-2032 ($MILLION)
- FIGURE 37. INDIA GAS-TO-LIQUID FUELS MARKET, 2022-2032 ($MILLION)
- FIGURE 38. SOUTH KOREA GAS-TO-LIQUID FUELS MARKET, 2022-2032 ($MILLION)
- FIGURE 39. AUSTRALIA GAS-TO-LIQUID FUELS MARKET, 2022-2032 ($MILLION)
- FIGURE 40. REST OF ASIA-PACIFIC GAS-TO-LIQUID FUELS MARKET, 2022-2032 ($MILLION)
- FIGURE 41. BRAZIL GAS-TO-LIQUID FUELS MARKET, 2022-2032 ($MILLION)
- FIGURE 42. SAUDI ARABIA GAS-TO-LIQUID FUELS MARKET, 2022-2032 ($MILLION)
- FIGURE 43. SOUTH AFRICA GAS-TO-LIQUID FUELS MARKET, 2022-2032 ($MILLION)
- FIGURE 44. REST OF LAMEA GAS-TO-LIQUID FUELS MARKET, 2022-2032 ($MILLION)
- FIGURE 45. TOP WINNING STRATEGIES, BY YEAR
- FIGURE 46. TOP WINNING STRATEGIES, BY DEVELOPMENT
- FIGURE 47. TOP WINNING STRATEGIES, BY COMPANY
- FIGURE 48. PRODUCT MAPPING OF TOP 10 PLAYERS
- FIGURE 49. COMPETITIVE DASHBOARD
- FIGURE 50. COMPETITIVE HEATMAP: GAS-TO-LIQUID FUELS MARKET
- FIGURE 51. TOP PLAYER POSITIONING, 2022

