
PUBLISHER: Allied Market Research | PRODUCT CODE: 1447170

PUBLISHER: Allied Market Research | PRODUCT CODE: 1447170
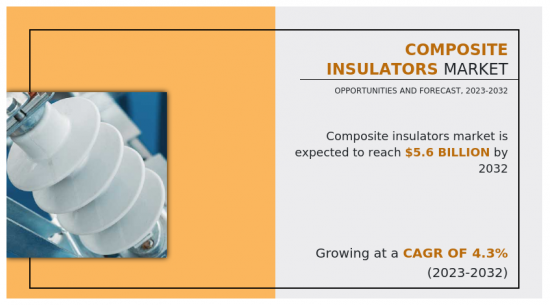
Composite Insulators Market By Product, By Voltage, By Application, By End Use : Global Opportunity Analysis and Industry Forecast, 2023-2032
The global composite insulators market was valued at $3.7 billion in 2022, and is projected to reach $5.6 billion by 2032, growing at a CAGR of 4.3% from 2023 to 2032.
The Global Composite Insulators Market stands at the forefront of revolutionizing electrical insulation solutions, employing advanced materials and technologies to enhance performance and reliability in power transmission and distribution systems. Leveraging innovative composite materials and manufacturing techniques, this industry plays a crucial role in meeting the increase in demand for efficient and durable insulators across diverse applications.
A key driver for the composite insulators market is the imperative for superior electrical performance. By utilizing composite materials such as fiberglass-reinforced polymers and silicone rubber, the industry aims to provide insulators with enhanced dielectric properties, mechanical strength, and resistance to environmental factors. This focus on advanced materials is crucial for optimizing power transmission efficiency and ensuring the reliability of electrical infrastructure. Energy security and grid reliability goals also drive the composite insulators market, aligning with efforts to modernize and upgrade aging power grids globally. The industry's commitment to developing high-performance insulators contributes to the overall resilience of electricity networks, reducing downtime and improving the overall stability of power systems.
Continuous technological advancements in composite materials and manufacturing processes further enhance the market's appeal. Innovations in design and engineering lead to insulators that offer not only superior electrical properties but also lighter weight, easier installation, and reduced maintenance requirements. These advancements contribute to the overall cost-effectiveness of composite insulators, making them an attractive choice for utilities and infrastructure developers.
Despite its potential, the composite insulators industry faces challenges, including the need for standardized testing protocols and certification processes. Ensuring consistent quality and performance across a range of operating conditions is crucial for gaining widespread acceptance in the market. In addition, market dynamics, including fluctuations in raw material prices and evolving regulatory standards, impact production planning and investment decisions.
The global composite insulators market presents promising opportunities across various regions. In North America, regulatory initiatives promoting grid modernization and the adoption of advanced technologies create a favorable environment for growth. Europe sees the adoption of composite insulators as a means to enhance the reliability of its power infrastructure, especially in the face of an increase in renewable energy integration. In the Asia-Pacific region, the growing demand for electricity and the need for reliable transmission infrastructure drive investments in composite insulators. In the Latin America, Middle East, and Africa (LAMEA) region, efforts to upgrade aging power infrastructure and improve grid resilience contribute to the increase in the adoption of composite insulators.
The global composite insulators are segmented based on product, voltage, application, end use, and country. By product, the market is divided into pin, suspension, shackle, and others. On the basis of the voltage, it is bifurcated into low, medium, and high. Depending on the application, the market is categorized into cables, switchgear, transformers, busbars, and others. On the basis of end use, the market is categorized into utilities, industries, and others. Region-wise, the market is studied across North America, Europe, Asia-Pacific, and LAMEA.
The major players operating in the global composite insulators market are ABB Ltd., Siemens AG, General Electric, TE Connectivity Ltd., PPC Insulators, MacLean Power Systems, G&W Electric Company, Southwest Composite Works, Victor Insulators, Inc., and Hubbell Inc.
Key Benefits For Stakeholders
- This report provides a quantitative analysis of the market segments, current trends, estimations, and dynamics of the composite insulators market analysis from 2022 to 2032 to identify the prevailing composite insulators market opportunities.
- The market research is offered along with information related to key drivers, restraints, and opportunities.
- Porter's five forces analysis highlights the potency of buyers and suppliers to enable stakeholders make profit-oriented business decisions and strengthen their supplier-buyer network.
- In-depth analysis of the composite insulators market segmentation assists to determine the prevailing market opportunities.
- Major countries in each region are mapped according to their revenue contribution to the global market.
- Market player positioning facilitates benchmarking and provides a clear understanding of the present position of the market players.
- The report includes the analysis of the regional as well as global composite insulators market trends, key players, market segments, application areas, and market growth strategies.
Additional benefits you will get with this purchase are:
- Quarterly Update and* (only available with a corporate license, on listed price)
- 5 additional Company Profile of client Choice pre- or Post-purchase, as a free update.
- Free Upcoming Version on the Purchase of Five and Enterprise User License.
- 16 analyst hours of support* (post-purchase, if you find additional data requirements upon review of the report, you may receive support amounting to 16 analyst hours to solve questions, and post-sale queries)
- 15% Free Customization* (in case the scope or segment of the report does not match your requirements, 15% is equivalent to 3 working days of free work, applicable once)
- Free data Pack on the Five and Enterprise User License. (Excel version of the report)
- Free Updated report if the report is 6-12 months old or older.
- 24-hour priority response*
- Free Industry updates and white papers.
Possible Customization with this report (with additional cost and timeline, please talk to the sales executive to know more)
- Investment Opportunities
- Upcoming/New Entrant by Regions
- Technology Trend Analysis
- Market share analysis of players by products/segments
- New Product Development/ Product Matrix of Key Players
- Regulatory Guidelines
- Strategic Recommedations
- Additional company profiles with specific to client's interest
- Additional country or region analysis- market size and forecast
- Expanded list for Company Profiles
- Historic market data
- Key player details (including location, contact details, supplier/vendor network etc. in excel format)
Key Market Segments
By Product
- Pin
- Suspension
- Shackle
- Others
By Voltage
- Low
- Medium
- High
By Application
- Cables
- Switchgears
- Transformers
- Busbars
- Others
By End Use
- Utilities
- Industries
- Others
By Region
- North America
- U.S.
- Canada
- Mexico
- Europe
- Germany
- France
- UK
- Italy
- Spain
- Rest of Europe
- Asia-Pacific
- China
- Japan
- India
- South Korea
- Rest of Asia-Pacific
- LAMEA
- Brazil
- Saudi Arabia
- South Africa
- Rest of LAMEA
Key Market Players:
- ABB Ltd.
- Siemens AG
- LAPP Insulators GmbH
- General Electric
- Zhejiang Zhenchao Petrochemical Machinery Co., Ltd.
- Aditya Birla Insulators
- Seves Group
- TE Connectivity Ltd.
- Hubbell Inc.
- Victor Insulators, Inc.
TABLE OF CONTENTS
CHAPTER 1: INTRODUCTION
- 1.1. Report description
- 1.2. Key market segments
- 1.3. Key benefits to the stakeholders
- 1.4. Research methodology
- 1.4.1. Primary research
- 1.4.2. Secondary research
- 1.4.3. Analyst tools and models
CHAPTER 2: EXECUTIVE SUMMARY
- 2.1. CXO Perspective
CHAPTER 3: MARKET OVERVIEW
- 3.1. Market definition and scope
- 3.2. Key findings
- 3.2.1. Top impacting factors
- 3.2.2. Top investment pockets
- 3.3. Porter's five forces analysis
- 3.4. Market dynamics
- 3.4.1. Drivers
- 3.4.2. Restraints
- 3.4.3. Opportunities
- 3.5. Value Chain Analysis
- 3.6. Key Regulation Analysis
- 3.7. Patent Landscape
CHAPTER 4: COMPOSITE INSULATORS MARKET, BY PRODUCT
- 4.1. Overview
- 4.1.1. Market size and forecast
- 4.2. Pin
- 4.2.1. Key market trends, growth factors and opportunities
- 4.2.2. Market size and forecast, by region
- 4.2.3. Market share analysis by country
- 4.3. Suspension
- 4.3.1. Key market trends, growth factors and opportunities
- 4.3.2. Market size and forecast, by region
- 4.3.3. Market share analysis by country
- 4.4. Shackle
- 4.4.1. Key market trends, growth factors and opportunities
- 4.4.2. Market size and forecast, by region
- 4.4.3. Market share analysis by country
- 4.5. Others
- 4.5.1. Key market trends, growth factors and opportunities
- 4.5.2. Market size and forecast, by region
- 4.5.3. Market share analysis by country
CHAPTER 5: COMPOSITE INSULATORS MARKET, BY VOLTAGE
- 5.1. Overview
- 5.1.1. Market size and forecast
- 5.2. Low
- 5.2.1. Key market trends, growth factors and opportunities
- 5.2.2. Market size and forecast, by region
- 5.2.3. Market share analysis by country
- 5.3. Medium
- 5.3.1. Key market trends, growth factors and opportunities
- 5.3.2. Market size and forecast, by region
- 5.3.3. Market share analysis by country
- 5.4. High
- 5.4.1. Key market trends, growth factors and opportunities
- 5.4.2. Market size and forecast, by region
- 5.4.3. Market share analysis by country
CHAPTER 6: COMPOSITE INSULATORS MARKET, BY APPLICATION
- 6.1. Overview
- 6.1.1. Market size and forecast
- 6.2. Cables
- 6.2.1. Key market trends, growth factors and opportunities
- 6.2.2. Market size and forecast, by region
- 6.2.3. Market share analysis by country
- 6.3. Switchgears
- 6.3.1. Key market trends, growth factors and opportunities
- 6.3.2. Market size and forecast, by region
- 6.3.3. Market share analysis by country
- 6.4. Transformers
- 6.4.1. Key market trends, growth factors and opportunities
- 6.4.2. Market size and forecast, by region
- 6.4.3. Market share analysis by country
- 6.5. Busbars
- 6.5.1. Key market trends, growth factors and opportunities
- 6.5.2. Market size and forecast, by region
- 6.5.3. Market share analysis by country
- 6.6. Others
- 6.6.1. Key market trends, growth factors and opportunities
- 6.6.2. Market size and forecast, by region
- 6.6.3. Market share analysis by country
CHAPTER 7: COMPOSITE INSULATORS MARKET, BY END USE
- 7.1. Overview
- 7.1.1. Market size and forecast
- 7.2. Utilities
- 7.2.1. Key market trends, growth factors and opportunities
- 7.2.2. Market size and forecast, by region
- 7.2.3. Market share analysis by country
- 7.3. Industries
- 7.3.1. Key market trends, growth factors and opportunities
- 7.3.2. Market size and forecast, by region
- 7.3.3. Market share analysis by country
- 7.4. Others
- 7.4.1. Key market trends, growth factors and opportunities
- 7.4.2. Market size and forecast, by region
- 7.4.3. Market share analysis by country
CHAPTER 8: COMPOSITE INSULATORS MARKET, BY REGION
- 8.1. Overview
- 8.1.1. Market size and forecast By Region
- 8.2. North America
- 8.2.1. Key market trends, growth factors and opportunities
- 8.2.2. Market size and forecast, by Product
- 8.2.3. Market size and forecast, by Voltage
- 8.2.4. Market size and forecast, by Application
- 8.2.5. Market size and forecast, by End Use
- 8.2.6. Market size and forecast, by country
- 8.2.6.1. U.S.
- 8.2.6.1.1. Market size and forecast, by Product
- 8.2.6.1.2. Market size and forecast, by Voltage
- 8.2.6.1.3. Market size and forecast, by Application
- 8.2.6.1.4. Market size and forecast, by End Use
- 8.2.6.2. Canada
- 8.2.6.2.1. Market size and forecast, by Product
- 8.2.6.2.2. Market size and forecast, by Voltage
- 8.2.6.2.3. Market size and forecast, by Application
- 8.2.6.2.4. Market size and forecast, by End Use
- 8.2.6.3. Mexico
- 8.2.6.3.1. Market size and forecast, by Product
- 8.2.6.3.2. Market size and forecast, by Voltage
- 8.2.6.3.3. Market size and forecast, by Application
- 8.2.6.3.4. Market size and forecast, by End Use
- 8.3. Europe
- 8.3.1. Key market trends, growth factors and opportunities
- 8.3.2. Market size and forecast, by Product
- 8.3.3. Market size and forecast, by Voltage
- 8.3.4. Market size and forecast, by Application
- 8.3.5. Market size and forecast, by End Use
- 8.3.6. Market size and forecast, by country
- 8.3.6.1. Germany
- 8.3.6.1.1. Market size and forecast, by Product
- 8.3.6.1.2. Market size and forecast, by Voltage
- 8.3.6.1.3. Market size and forecast, by Application
- 8.3.6.1.4. Market size and forecast, by End Use
- 8.3.6.2. France
- 8.3.6.2.1. Market size and forecast, by Product
- 8.3.6.2.2. Market size and forecast, by Voltage
- 8.3.6.2.3. Market size and forecast, by Application
- 8.3.6.2.4. Market size and forecast, by End Use
- 8.3.6.3. UK
- 8.3.6.3.1. Market size and forecast, by Product
- 8.3.6.3.2. Market size and forecast, by Voltage
- 8.3.6.3.3. Market size and forecast, by Application
- 8.3.6.3.4. Market size and forecast, by End Use
- 8.3.6.4. Italy
- 8.3.6.4.1. Market size and forecast, by Product
- 8.3.6.4.2. Market size and forecast, by Voltage
- 8.3.6.4.3. Market size and forecast, by Application
- 8.3.6.4.4. Market size and forecast, by End Use
- 8.3.6.5. Spain
- 8.3.6.5.1. Market size and forecast, by Product
- 8.3.6.5.2. Market size and forecast, by Voltage
- 8.3.6.5.3. Market size and forecast, by Application
- 8.3.6.5.4. Market size and forecast, by End Use
- 8.3.6.6. Rest of Europe
- 8.3.6.6.1. Market size and forecast, by Product
- 8.3.6.6.2. Market size and forecast, by Voltage
- 8.3.6.6.3. Market size and forecast, by Application
- 8.3.6.6.4. Market size and forecast, by End Use
- 8.4. Asia-Pacific
- 8.4.1. Key market trends, growth factors and opportunities
- 8.4.2. Market size and forecast, by Product
- 8.4.3. Market size and forecast, by Voltage
- 8.4.4. Market size and forecast, by Application
- 8.4.5. Market size and forecast, by End Use
- 8.4.6. Market size and forecast, by country
- 8.4.6.1. China
- 8.4.6.1.1. Market size and forecast, by Product
- 8.4.6.1.2. Market size and forecast, by Voltage
- 8.4.6.1.3. Market size and forecast, by Application
- 8.4.6.1.4. Market size and forecast, by End Use
- 8.4.6.2. Japan
- 8.4.6.2.1. Market size and forecast, by Product
- 8.4.6.2.2. Market size and forecast, by Voltage
- 8.4.6.2.3. Market size and forecast, by Application
- 8.4.6.2.4. Market size and forecast, by End Use
- 8.4.6.3. India
- 8.4.6.3.1. Market size and forecast, by Product
- 8.4.6.3.2. Market size and forecast, by Voltage
- 8.4.6.3.3. Market size and forecast, by Application
- 8.4.6.3.4. Market size and forecast, by End Use
- 8.4.6.4. South Korea
- 8.4.6.4.1. Market size and forecast, by Product
- 8.4.6.4.2. Market size and forecast, by Voltage
- 8.4.6.4.3. Market size and forecast, by Application
- 8.4.6.4.4. Market size and forecast, by End Use
- 8.4.6.5. Rest of Asia-Pacific
- 8.4.6.5.1. Market size and forecast, by Product
- 8.4.6.5.2. Market size and forecast, by Voltage
- 8.4.6.5.3. Market size and forecast, by Application
- 8.4.6.5.4. Market size and forecast, by End Use
- 8.5. LAMEA
- 8.5.1. Key market trends, growth factors and opportunities
- 8.5.2. Market size and forecast, by Product
- 8.5.3. Market size and forecast, by Voltage
- 8.5.4. Market size and forecast, by Application
- 8.5.5. Market size and forecast, by End Use
- 8.5.6. Market size and forecast, by country
- 8.5.6.1. Brazil
- 8.5.6.1.1. Market size and forecast, by Product
- 8.5.6.1.2. Market size and forecast, by Voltage
- 8.5.6.1.3. Market size and forecast, by Application
- 8.5.6.1.4. Market size and forecast, by End Use
- 8.5.6.2. Saudi Arabia
- 8.5.6.2.1. Market size and forecast, by Product
- 8.5.6.2.2. Market size and forecast, by Voltage
- 8.5.6.2.3. Market size and forecast, by Application
- 8.5.6.2.4. Market size and forecast, by End Use
- 8.5.6.3. South Africa
- 8.5.6.3.1. Market size and forecast, by Product
- 8.5.6.3.2. Market size and forecast, by Voltage
- 8.5.6.3.3. Market size and forecast, by Application
- 8.5.6.3.4. Market size and forecast, by End Use
- 8.5.6.4. Rest of LAMEA
- 8.5.6.4.1. Market size and forecast, by Product
- 8.5.6.4.2. Market size and forecast, by Voltage
- 8.5.6.4.3. Market size and forecast, by Application
- 8.5.6.4.4. Market size and forecast, by End Use
CHAPTER 9: COMPETITIVE LANDSCAPE
- 9.1. Introduction
- 9.2. Top winning strategies
- 9.3. Product mapping of top 10 player
- 9.4. Competitive dashboard
- 9.5. Competitive heatmap
- 9.6. Top player positioning, 2022
CHAPTER 10: COMPANY PROFILES
- 10.1. ABB Ltd.
- 10.1.1. Company overview
- 10.1.2. Key executives
- 10.1.3. Company snapshot
- 10.1.4. Operating business segments
- 10.1.5. Product portfolio
- 10.1.6. Business performance
- 10.1.7. Key strategic moves and developments
- 10.2. Siemens AG
- 10.2.1. Company overview
- 10.2.2. Key executives
- 10.2.3. Company snapshot
- 10.2.4. Operating business segments
- 10.2.5. Product portfolio
- 10.2.6. Business performance
- 10.2.7. Key strategic moves and developments
- 10.3. LAPP Insulators GmbH
- 10.3.1. Company overview
- 10.3.2. Key executives
- 10.3.3. Company snapshot
- 10.3.4. Operating business segments
- 10.3.5. Product portfolio
- 10.3.6. Business performance
- 10.3.7. Key strategic moves and developments
- 10.4. General Electric
- 10.4.1. Company overview
- 10.4.2. Key executives
- 10.4.3. Company snapshot
- 10.4.4. Operating business segments
- 10.4.5. Product portfolio
- 10.4.6. Business performance
- 10.4.7. Key strategic moves and developments
- 10.5. Zhejiang Zhenchao Petrochemical Machinery Co., Ltd.
- 10.5.1. Company overview
- 10.5.2. Key executives
- 10.5.3. Company snapshot
- 10.5.4. Operating business segments
- 10.5.5. Product portfolio
- 10.5.6. Business performance
- 10.5.7. Key strategic moves and developments
- 10.6. Aditya Birla Insulators
- 10.6.1. Company overview
- 10.6.2. Key executives
- 10.6.3. Company snapshot
- 10.6.4. Operating business segments
- 10.6.5. Product portfolio
- 10.6.6. Business performance
- 10.6.7. Key strategic moves and developments
- 10.7. Seves Group
- 10.7.1. Company overview
- 10.7.2. Key executives
- 10.7.3. Company snapshot
- 10.7.4. Operating business segments
- 10.7.5. Product portfolio
- 10.7.6. Business performance
- 10.7.7. Key strategic moves and developments
- 10.8. TE Connectivity Ltd.
- 10.8.1. Company overview
- 10.8.2. Key executives
- 10.8.3. Company snapshot
- 10.8.4. Operating business segments
- 10.8.5. Product portfolio
- 10.8.6. Business performance
- 10.8.7. Key strategic moves and developments
- 10.9. Hubbell Inc.
- 10.9.1. Company overview
- 10.9.2. Key executives
- 10.9.3. Company snapshot
- 10.9.4. Operating business segments
- 10.9.5. Product portfolio
- 10.9.6. Business performance
- 10.9.7. Key strategic moves and developments
- 10.10. Victor Insulators, Inc.
- 10.10.1. Company overview
- 10.10.2. Key executives
- 10.10.3. Company snapshot
- 10.10.4. Operating business segments
- 10.10.5. Product portfolio
- 10.10.6. Business performance
- 10.10.7. Key strategic moves and developments
LIST OF TABLES
- TABLE 01. GLOBAL COMPOSITE INSULATORS MARKET, BY PRODUCT, 2022-2032 ($MILLION)
- TABLE 02. COMPOSITE INSULATORS MARKET FOR PIN, BY REGION, 2022-2032 ($MILLION)
- TABLE 03. COMPOSITE INSULATORS MARKET FOR SUSPENSION, BY REGION, 2022-2032 ($MILLION)
- TABLE 04. COMPOSITE INSULATORS MARKET FOR SHACKLE, BY REGION, 2022-2032 ($MILLION)
- TABLE 05. COMPOSITE INSULATORS MARKET FOR OTHERS, BY REGION, 2022-2032 ($MILLION)
- TABLE 06. GLOBAL COMPOSITE INSULATORS MARKET, BY VOLTAGE, 2022-2032 ($MILLION)
- TABLE 07. COMPOSITE INSULATORS MARKET FOR LOW, BY REGION, 2022-2032 ($MILLION)
- TABLE 08. COMPOSITE INSULATORS MARKET FOR MEDIUM, BY REGION, 2022-2032 ($MILLION)
- TABLE 09. COMPOSITE INSULATORS MARKET FOR HIGH, BY REGION, 2022-2032 ($MILLION)
- TABLE 10. GLOBAL COMPOSITE INSULATORS MARKET, BY APPLICATION, 2022-2032 ($MILLION)
- TABLE 11. COMPOSITE INSULATORS MARKET FOR CABLES, BY REGION, 2022-2032 ($MILLION)
- TABLE 12. COMPOSITE INSULATORS MARKET FOR SWITCHGEARS, BY REGION, 2022-2032 ($MILLION)
- TABLE 13. COMPOSITE INSULATORS MARKET FOR TRANSFORMERS, BY REGION, 2022-2032 ($MILLION)
- TABLE 14. COMPOSITE INSULATORS MARKET FOR BUSBARS, BY REGION, 2022-2032 ($MILLION)
- TABLE 15. COMPOSITE INSULATORS MARKET FOR OTHERS, BY REGION, 2022-2032 ($MILLION)
- TABLE 16. GLOBAL COMPOSITE INSULATORS MARKET, BY END USE, 2022-2032 ($MILLION)
- TABLE 17. COMPOSITE INSULATORS MARKET FOR UTILITIES, BY REGION, 2022-2032 ($MILLION)
- TABLE 18. COMPOSITE INSULATORS MARKET FOR INDUSTRIES, BY REGION, 2022-2032 ($MILLION)
- TABLE 19. COMPOSITE INSULATORS MARKET FOR OTHERS, BY REGION, 2022-2032 ($MILLION)
- TABLE 20. COMPOSITE INSULATORS MARKET, BY REGION, 2022-2032 ($MILLION)
- TABLE 21. NORTH AMERICA COMPOSITE INSULATORS MARKET, BY PRODUCT, 2022-2032 ($MILLION)
- TABLE 22. NORTH AMERICA COMPOSITE INSULATORS MARKET, BY VOLTAGE, 2022-2032 ($MILLION)
- TABLE 23. NORTH AMERICA COMPOSITE INSULATORS MARKET, BY APPLICATION, 2022-2032 ($MILLION)
- TABLE 24. NORTH AMERICA COMPOSITE INSULATORS MARKET, BY END USE, 2022-2032 ($MILLION)
- TABLE 25. NORTH AMERICA COMPOSITE INSULATORS MARKET, BY COUNTRY, 2022-2032 ($MILLION)
- TABLE 26. U.S. COMPOSITE INSULATORS MARKET, BY PRODUCT, 2022-2032 ($MILLION)
- TABLE 27. U.S. COMPOSITE INSULATORS MARKET, BY VOLTAGE, 2022-2032 ($MILLION)
- TABLE 28. U.S. COMPOSITE INSULATORS MARKET, BY APPLICATION, 2022-2032 ($MILLION)
- TABLE 29. U.S. COMPOSITE INSULATORS MARKET, BY END USE, 2022-2032 ($MILLION)
- TABLE 30. CANADA COMPOSITE INSULATORS MARKET, BY PRODUCT, 2022-2032 ($MILLION)
- TABLE 31. CANADA COMPOSITE INSULATORS MARKET, BY VOLTAGE, 2022-2032 ($MILLION)
- TABLE 32. CANADA COMPOSITE INSULATORS MARKET, BY APPLICATION, 2022-2032 ($MILLION)
- TABLE 33. CANADA COMPOSITE INSULATORS MARKET, BY END USE, 2022-2032 ($MILLION)
- TABLE 34. MEXICO COMPOSITE INSULATORS MARKET, BY PRODUCT, 2022-2032 ($MILLION)
- TABLE 35. MEXICO COMPOSITE INSULATORS MARKET, BY VOLTAGE, 2022-2032 ($MILLION)
- TABLE 36. MEXICO COMPOSITE INSULATORS MARKET, BY APPLICATION, 2022-2032 ($MILLION)
- TABLE 37. MEXICO COMPOSITE INSULATORS MARKET, BY END USE, 2022-2032 ($MILLION)
- TABLE 38. EUROPE COMPOSITE INSULATORS MARKET, BY PRODUCT, 2022-2032 ($MILLION)
- TABLE 39. EUROPE COMPOSITE INSULATORS MARKET, BY VOLTAGE, 2022-2032 ($MILLION)
- TABLE 40. EUROPE COMPOSITE INSULATORS MARKET, BY APPLICATION, 2022-2032 ($MILLION)
- TABLE 41. EUROPE COMPOSITE INSULATORS MARKET, BY END USE, 2022-2032 ($MILLION)
- TABLE 42. EUROPE COMPOSITE INSULATORS MARKET, BY COUNTRY, 2022-2032 ($MILLION)
- TABLE 43. GERMANY COMPOSITE INSULATORS MARKET, BY PRODUCT, 2022-2032 ($MILLION)
- TABLE 44. GERMANY COMPOSITE INSULATORS MARKET, BY VOLTAGE, 2022-2032 ($MILLION)
- TABLE 45. GERMANY COMPOSITE INSULATORS MARKET, BY APPLICATION, 2022-2032 ($MILLION)
- TABLE 46. GERMANY COMPOSITE INSULATORS MARKET, BY END USE, 2022-2032 ($MILLION)
- TABLE 47. FRANCE COMPOSITE INSULATORS MARKET, BY PRODUCT, 2022-2032 ($MILLION)
- TABLE 48. FRANCE COMPOSITE INSULATORS MARKET, BY VOLTAGE, 2022-2032 ($MILLION)
- TABLE 49. FRANCE COMPOSITE INSULATORS MARKET, BY APPLICATION, 2022-2032 ($MILLION)
- TABLE 50. FRANCE COMPOSITE INSULATORS MARKET, BY END USE, 2022-2032 ($MILLION)
- TABLE 51. UK COMPOSITE INSULATORS MARKET, BY PRODUCT, 2022-2032 ($MILLION)
- TABLE 52. UK COMPOSITE INSULATORS MARKET, BY VOLTAGE, 2022-2032 ($MILLION)
- TABLE 53. UK COMPOSITE INSULATORS MARKET, BY APPLICATION, 2022-2032 ($MILLION)
- TABLE 54. UK COMPOSITE INSULATORS MARKET, BY END USE, 2022-2032 ($MILLION)
- TABLE 55. ITALY COMPOSITE INSULATORS MARKET, BY PRODUCT, 2022-2032 ($MILLION)
- TABLE 56. ITALY COMPOSITE INSULATORS MARKET, BY VOLTAGE, 2022-2032 ($MILLION)
- TABLE 57. ITALY COMPOSITE INSULATORS MARKET, BY APPLICATION, 2022-2032 ($MILLION)
- TABLE 58. ITALY COMPOSITE INSULATORS MARKET, BY END USE, 2022-2032 ($MILLION)
- TABLE 59. SPAIN COMPOSITE INSULATORS MARKET, BY PRODUCT, 2022-2032 ($MILLION)
- TABLE 60. SPAIN COMPOSITE INSULATORS MARKET, BY VOLTAGE, 2022-2032 ($MILLION)
- TABLE 61. SPAIN COMPOSITE INSULATORS MARKET, BY APPLICATION, 2022-2032 ($MILLION)
- TABLE 62. SPAIN COMPOSITE INSULATORS MARKET, BY END USE, 2022-2032 ($MILLION)
- TABLE 63. REST OF EUROPE COMPOSITE INSULATORS MARKET, BY PRODUCT, 2022-2032 ($MILLION)
- TABLE 64. REST OF EUROPE COMPOSITE INSULATORS MARKET, BY VOLTAGE, 2022-2032 ($MILLION)
- TABLE 65. REST OF EUROPE COMPOSITE INSULATORS MARKET, BY APPLICATION, 2022-2032 ($MILLION)
- TABLE 66. REST OF EUROPE COMPOSITE INSULATORS MARKET, BY END USE, 2022-2032 ($MILLION)
- TABLE 67. ASIA-PACIFIC COMPOSITE INSULATORS MARKET, BY PRODUCT, 2022-2032 ($MILLION)
- TABLE 68. ASIA-PACIFIC COMPOSITE INSULATORS MARKET, BY VOLTAGE, 2022-2032 ($MILLION)
- TABLE 69. ASIA-PACIFIC COMPOSITE INSULATORS MARKET, BY APPLICATION, 2022-2032 ($MILLION)
- TABLE 70. ASIA-PACIFIC COMPOSITE INSULATORS MARKET, BY END USE, 2022-2032 ($MILLION)
- TABLE 71. ASIA-PACIFIC COMPOSITE INSULATORS MARKET, BY COUNTRY, 2022-2032 ($MILLION)
- TABLE 72. CHINA COMPOSITE INSULATORS MARKET, BY PRODUCT, 2022-2032 ($MILLION)
- TABLE 73. CHINA COMPOSITE INSULATORS MARKET, BY VOLTAGE, 2022-2032 ($MILLION)
- TABLE 74. CHINA COMPOSITE INSULATORS MARKET, BY APPLICATION, 2022-2032 ($MILLION)
- TABLE 75. CHINA COMPOSITE INSULATORS MARKET, BY END USE, 2022-2032 ($MILLION)
- TABLE 76. JAPAN COMPOSITE INSULATORS MARKET, BY PRODUCT, 2022-2032 ($MILLION)
- TABLE 77. JAPAN COMPOSITE INSULATORS MARKET, BY VOLTAGE, 2022-2032 ($MILLION)
- TABLE 78. JAPAN COMPOSITE INSULATORS MARKET, BY APPLICATION, 2022-2032 ($MILLION)
- TABLE 79. JAPAN COMPOSITE INSULATORS MARKET, BY END USE, 2022-2032 ($MILLION)
- TABLE 80. INDIA COMPOSITE INSULATORS MARKET, BY PRODUCT, 2022-2032 ($MILLION)
- TABLE 81. INDIA COMPOSITE INSULATORS MARKET, BY VOLTAGE, 2022-2032 ($MILLION)
- TABLE 82. INDIA COMPOSITE INSULATORS MARKET, BY APPLICATION, 2022-2032 ($MILLION)
- TABLE 83. INDIA COMPOSITE INSULATORS MARKET, BY END USE, 2022-2032 ($MILLION)
- TABLE 84. SOUTH KOREA COMPOSITE INSULATORS MARKET, BY PRODUCT, 2022-2032 ($MILLION)
- TABLE 85. SOUTH KOREA COMPOSITE INSULATORS MARKET, BY VOLTAGE, 2022-2032 ($MILLION)
- TABLE 86. SOUTH KOREA COMPOSITE INSULATORS MARKET, BY APPLICATION, 2022-2032 ($MILLION)
- TABLE 87. SOUTH KOREA COMPOSITE INSULATORS MARKET, BY END USE, 2022-2032 ($MILLION)
- TABLE 88. REST OF ASIA-PACIFIC COMPOSITE INSULATORS MARKET, BY PRODUCT, 2022-2032 ($MILLION)
- TABLE 89. REST OF ASIA-PACIFIC COMPOSITE INSULATORS MARKET, BY VOLTAGE, 2022-2032 ($MILLION)
- TABLE 90. REST OF ASIA-PACIFIC COMPOSITE INSULATORS MARKET, BY APPLICATION, 2022-2032 ($MILLION)
- TABLE 91. REST OF ASIA-PACIFIC COMPOSITE INSULATORS MARKET, BY END USE, 2022-2032 ($MILLION)
- TABLE 92. LAMEA COMPOSITE INSULATORS MARKET, BY PRODUCT, 2022-2032 ($MILLION)
- TABLE 93. LAMEA COMPOSITE INSULATORS MARKET, BY VOLTAGE, 2022-2032 ($MILLION)
- TABLE 94. LAMEA COMPOSITE INSULATORS MARKET, BY APPLICATION, 2022-2032 ($MILLION)
- TABLE 95. LAMEA COMPOSITE INSULATORS MARKET, BY END USE, 2022-2032 ($MILLION)
- TABLE 96. LAMEA COMPOSITE INSULATORS MARKET, BY COUNTRY, 2022-2032 ($MILLION)
- TABLE 97. BRAZIL COMPOSITE INSULATORS MARKET, BY PRODUCT, 2022-2032 ($MILLION)
- TABLE 98. BRAZIL COMPOSITE INSULATORS MARKET, BY VOLTAGE, 2022-2032 ($MILLION)
- TABLE 99. BRAZIL COMPOSITE INSULATORS MARKET, BY APPLICATION, 2022-2032 ($MILLION)
- TABLE 100. BRAZIL COMPOSITE INSULATORS MARKET, BY END USE, 2022-2032 ($MILLION)
- TABLE 101. SAUDI ARABIA COMPOSITE INSULATORS MARKET, BY PRODUCT, 2022-2032 ($MILLION)
- TABLE 102. SAUDI ARABIA COMPOSITE INSULATORS MARKET, BY VOLTAGE, 2022-2032 ($MILLION)
- TABLE 103. SAUDI ARABIA COMPOSITE INSULATORS MARKET, BY APPLICATION, 2022-2032 ($MILLION)
- TABLE 104. SAUDI ARABIA COMPOSITE INSULATORS MARKET, BY END USE, 2022-2032 ($MILLION)
- TABLE 105. SOUTH AFRICA COMPOSITE INSULATORS MARKET, BY PRODUCT, 2022-2032 ($MILLION)
- TABLE 106. SOUTH AFRICA COMPOSITE INSULATORS MARKET, BY VOLTAGE, 2022-2032 ($MILLION)
- TABLE 107. SOUTH AFRICA COMPOSITE INSULATORS MARKET, BY APPLICATION, 2022-2032 ($MILLION)
- TABLE 108. SOUTH AFRICA COMPOSITE INSULATORS MARKET, BY END USE, 2022-2032 ($MILLION)
- TABLE 109. REST OF LAMEA COMPOSITE INSULATORS MARKET, BY PRODUCT, 2022-2032 ($MILLION)
- TABLE 110. REST OF LAMEA COMPOSITE INSULATORS MARKET, BY VOLTAGE, 2022-2032 ($MILLION)
- TABLE 111. REST OF LAMEA COMPOSITE INSULATORS MARKET, BY APPLICATION, 2022-2032 ($MILLION)
- TABLE 112. REST OF LAMEA COMPOSITE INSULATORS MARKET, BY END USE, 2022-2032 ($MILLION)
- TABLE 113. ABB LTD.: KEY EXECUTIVES
- TABLE 114. ABB LTD.: COMPANY SNAPSHOT
- TABLE 115. ABB LTD.: PRODUCT SEGMENTS
- TABLE 116. ABB LTD.: SERVICE SEGMENTS
- TABLE 117. ABB LTD.: PRODUCT PORTFOLIO
- TABLE 118. ABB LTD.: KEY STRATERGIES
- TABLE 119. SIEMENS AG: KEY EXECUTIVES
- TABLE 120. SIEMENS AG: COMPANY SNAPSHOT
- TABLE 121. SIEMENS AG: PRODUCT SEGMENTS
- TABLE 122. SIEMENS AG: SERVICE SEGMENTS
- TABLE 123. SIEMENS AG: PRODUCT PORTFOLIO
- TABLE 124. SIEMENS AG: KEY STRATERGIES
- TABLE 125. LAPP INSULATORS GMBH: KEY EXECUTIVES
- TABLE 126. LAPP INSULATORS GMBH: COMPANY SNAPSHOT
- TABLE 127. LAPP INSULATORS GMBH: PRODUCT SEGMENTS
- TABLE 128. LAPP INSULATORS GMBH: SERVICE SEGMENTS
- TABLE 129. LAPP INSULATORS GMBH: PRODUCT PORTFOLIO
- TABLE 130. LAPP INSULATORS GMBH: KEY STRATERGIES
- TABLE 131. GENERAL ELECTRIC: KEY EXECUTIVES
- TABLE 132. GENERAL ELECTRIC: COMPANY SNAPSHOT
- TABLE 133. GENERAL ELECTRIC: PRODUCT SEGMENTS
- TABLE 134. GENERAL ELECTRIC: SERVICE SEGMENTS
- TABLE 135. GENERAL ELECTRIC: PRODUCT PORTFOLIO
- TABLE 136. GENERAL ELECTRIC: KEY STRATERGIES
- TABLE 137. ZHEJIANG ZHENCHAO PETROCHEMICAL MACHINERY CO., LTD.: KEY EXECUTIVES
- TABLE 138. ZHEJIANG ZHENCHAO PETROCHEMICAL MACHINERY CO., LTD.: COMPANY SNAPSHOT
- TABLE 139. ZHEJIANG ZHENCHAO PETROCHEMICAL MACHINERY CO., LTD.: PRODUCT SEGMENTS
- TABLE 140. ZHEJIANG ZHENCHAO PETROCHEMICAL MACHINERY CO., LTD.: SERVICE SEGMENTS
- TABLE 141. ZHEJIANG ZHENCHAO PETROCHEMICAL MACHINERY CO., LTD.: PRODUCT PORTFOLIO
- TABLE 142. ZHEJIANG ZHENCHAO PETROCHEMICAL MACHINERY CO., LTD.: KEY STRATERGIES
- TABLE 143. ADITYA BIRLA INSULATORS: KEY EXECUTIVES
- TABLE 144. ADITYA BIRLA INSULATORS: COMPANY SNAPSHOT
- TABLE 145. ADITYA BIRLA INSULATORS: PRODUCT SEGMENTS
- TABLE 146. ADITYA BIRLA INSULATORS: SERVICE SEGMENTS
- TABLE 147. ADITYA BIRLA INSULATORS: PRODUCT PORTFOLIO
- TABLE 148. ADITYA BIRLA INSULATORS: KEY STRATERGIES
- TABLE 149. SEVES GROUP: KEY EXECUTIVES
- TABLE 150. SEVES GROUP: COMPANY SNAPSHOT
- TABLE 151. SEVES GROUP: PRODUCT SEGMENTS
- TABLE 152. SEVES GROUP: SERVICE SEGMENTS
- TABLE 153. SEVES GROUP: PRODUCT PORTFOLIO
- TABLE 154. SEVES GROUP: KEY STRATERGIES
- TABLE 155. TE CONNECTIVITY LTD.: KEY EXECUTIVES
- TABLE 156. TE CONNECTIVITY LTD.: COMPANY SNAPSHOT
- TABLE 157. TE CONNECTIVITY LTD.: PRODUCT SEGMENTS
- TABLE 158. TE CONNECTIVITY LTD.: SERVICE SEGMENTS
- TABLE 159. TE CONNECTIVITY LTD.: PRODUCT PORTFOLIO
- TABLE 160. TE CONNECTIVITY LTD.: KEY STRATERGIES
- TABLE 161. HUBBELL INC.: KEY EXECUTIVES
- TABLE 162. HUBBELL INC.: COMPANY SNAPSHOT
- TABLE 163. HUBBELL INC.: PRODUCT SEGMENTS
- TABLE 164. HUBBELL INC.: SERVICE SEGMENTS
- TABLE 165. HUBBELL INC.: PRODUCT PORTFOLIO
- TABLE 166. HUBBELL INC.: KEY STRATERGIES
- TABLE 167. VICTOR INSULATORS, INC.: KEY EXECUTIVES
- TABLE 168. VICTOR INSULATORS, INC.: COMPANY SNAPSHOT
- TABLE 169. VICTOR INSULATORS, INC.: PRODUCT SEGMENTS
- TABLE 170. VICTOR INSULATORS, INC.: SERVICE SEGMENTS
- TABLE 171. VICTOR INSULATORS, INC.: PRODUCT PORTFOLIO
- TABLE 172. VICTOR INSULATORS, INC.: KEY STRATERGIES
LIST OF FIGURES
- FIGURE 01. COMPOSITE INSULATORS MARKET, 2022-2032
- FIGURE 02. SEGMENTATION OF COMPOSITE INSULATORS MARKET,2022-2032
- FIGURE 03. TOP IMPACTING FACTORS IN COMPOSITE INSULATORS MARKET
- FIGURE 04. TOP INVESTMENT POCKETS IN COMPOSITE INSULATORS MARKET (2023-2032)
- FIGURE 05. BARGAINING POWER OF SUPPLIERS
- FIGURE 06. BARGAINING POWER OF BUYERS
- FIGURE 07. THREAT OF SUBSTITUTION
- FIGURE 08. THREAT OF SUBSTITUTION
- FIGURE 09. COMPETITIVE RIVALRY
- FIGURE 10. GLOBAL COMPOSITE INSULATORS MARKET:DRIVERS, RESTRAINTS AND OPPORTUNITIES
- FIGURE 11. IMPACT OF KEY REGULATION: COMPOSITE INSULATORS MARKET
- FIGURE 12. PATENT ANALYSIS BY COMPANY
- FIGURE 13. PATENT ANALYSIS BY COUNTRY
- FIGURE 14. COMPOSITE INSULATORS MARKET, BY PRODUCT, 2022 AND 2032(%)
- FIGURE 15. COMPARATIVE SHARE ANALYSIS OF COMPOSITE INSULATORS MARKET FOR PIN, BY COUNTRY 2022 AND 2032(%)
- FIGURE 16. COMPARATIVE SHARE ANALYSIS OF COMPOSITE INSULATORS MARKET FOR SUSPENSION, BY COUNTRY 2022 AND 2032(%)
- FIGURE 17. COMPARATIVE SHARE ANALYSIS OF COMPOSITE INSULATORS MARKET FOR SHACKLE, BY COUNTRY 2022 AND 2032(%)
- FIGURE 18. COMPARATIVE SHARE ANALYSIS OF COMPOSITE INSULATORS MARKET FOR OTHERS, BY COUNTRY 2022 AND 2032(%)
- FIGURE 19. COMPOSITE INSULATORS MARKET, BY VOLTAGE, 2022 AND 2032(%)
- FIGURE 20. COMPARATIVE SHARE ANALYSIS OF COMPOSITE INSULATORS MARKET FOR LOW, BY COUNTRY 2022 AND 2032(%)
- FIGURE 21. COMPARATIVE SHARE ANALYSIS OF COMPOSITE INSULATORS MARKET FOR MEDIUM, BY COUNTRY 2022 AND 2032(%)
- FIGURE 22. COMPARATIVE SHARE ANALYSIS OF COMPOSITE INSULATORS MARKET FOR HIGH, BY COUNTRY 2022 AND 2032(%)
- FIGURE 23. COMPOSITE INSULATORS MARKET, BY APPLICATION, 2022 AND 2032(%)
- FIGURE 24. COMPARATIVE SHARE ANALYSIS OF COMPOSITE INSULATORS MARKET FOR CABLES, BY COUNTRY 2022 AND 2032(%)
- FIGURE 25. COMPARATIVE SHARE ANALYSIS OF COMPOSITE INSULATORS MARKET FOR SWITCHGEARS, BY COUNTRY 2022 AND 2032(%)
- FIGURE 26. COMPARATIVE SHARE ANALYSIS OF COMPOSITE INSULATORS MARKET FOR TRANSFORMERS, BY COUNTRY 2022 AND 2032(%)
- FIGURE 27. COMPARATIVE SHARE ANALYSIS OF COMPOSITE INSULATORS MARKET FOR BUSBARS, BY COUNTRY 2022 AND 2032(%)
- FIGURE 28. COMPARATIVE SHARE ANALYSIS OF COMPOSITE INSULATORS MARKET FOR OTHERS, BY COUNTRY 2022 AND 2032(%)
- FIGURE 29. COMPOSITE INSULATORS MARKET, BY END USE, 2022 AND 2032(%)
- FIGURE 30. COMPARATIVE SHARE ANALYSIS OF COMPOSITE INSULATORS MARKET FOR UTILITIES, BY COUNTRY 2022 AND 2032(%)
- FIGURE 31. COMPARATIVE SHARE ANALYSIS OF COMPOSITE INSULATORS MARKET FOR INDUSTRIES, BY COUNTRY 2022 AND 2032(%)
- FIGURE 32. COMPARATIVE SHARE ANALYSIS OF COMPOSITE INSULATORS MARKET FOR OTHERS, BY COUNTRY 2022 AND 2032(%)
- FIGURE 33. COMPOSITE INSULATORS MARKET BY REGION, 2022 AND 2032(%)
- FIGURE 34. U.S. COMPOSITE INSULATORS MARKET, 2022-2032 ($MILLION)
- FIGURE 35. CANADA COMPOSITE INSULATORS MARKET, 2022-2032 ($MILLION)
- FIGURE 36. MEXICO COMPOSITE INSULATORS MARKET, 2022-2032 ($MILLION)
- FIGURE 37. GERMANY COMPOSITE INSULATORS MARKET, 2022-2032 ($MILLION)
- FIGURE 38. FRANCE COMPOSITE INSULATORS MARKET, 2022-2032 ($MILLION)
- FIGURE 39. UK COMPOSITE INSULATORS MARKET, 2022-2032 ($MILLION)
- FIGURE 40. ITALY COMPOSITE INSULATORS MARKET, 2022-2032 ($MILLION)
- FIGURE 41. SPAIN COMPOSITE INSULATORS MARKET, 2022-2032 ($MILLION)
- FIGURE 42. REST OF EUROPE COMPOSITE INSULATORS MARKET, 2022-2032 ($MILLION)
- FIGURE 43. CHINA COMPOSITE INSULATORS MARKET, 2022-2032 ($MILLION)
- FIGURE 44. JAPAN COMPOSITE INSULATORS MARKET, 2022-2032 ($MILLION)
- FIGURE 45. INDIA COMPOSITE INSULATORS MARKET, 2022-2032 ($MILLION)
- FIGURE 46. SOUTH KOREA COMPOSITE INSULATORS MARKET, 2022-2032 ($MILLION)
- FIGURE 47. REST OF ASIA-PACIFIC COMPOSITE INSULATORS MARKET, 2022-2032 ($MILLION)
- FIGURE 48. BRAZIL COMPOSITE INSULATORS MARKET, 2022-2032 ($MILLION)
- FIGURE 49. SAUDI ARABIA COMPOSITE INSULATORS MARKET, 2022-2032 ($MILLION)
- FIGURE 50. SOUTH AFRICA COMPOSITE INSULATORS MARKET, 2022-2032 ($MILLION)
- FIGURE 51. REST OF LAMEA COMPOSITE INSULATORS MARKET, 2022-2032 ($MILLION)
- FIGURE 52. TOP WINNING STRATEGIES, BY YEAR
- FIGURE 53. TOP WINNING STRATEGIES, BY DEVELOPMENT
- FIGURE 54. TOP WINNING STRATEGIES, BY COMPANY
- FIGURE 55. PRODUCT MAPPING OF TOP 10 PLAYERS
- FIGURE 56. COMPETITIVE DASHBOARD
- FIGURE 57. COMPETITIVE HEATMAP: COMPOSITE INSULATORS MARKET
- FIGURE 58. TOP PLAYER POSITIONING, 2022

