
PUBLISHER: Allied Market Research | PRODUCT CODE: 1447191

PUBLISHER: Allied Market Research | PRODUCT CODE: 1447191
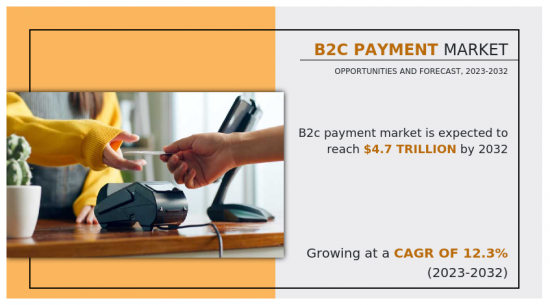
B2C Payment Market By Type, By Industry Vertical : Global Opportunity Analysis and Industry Forecast, 2023-2032
B2C Payment Market by Type (Cards, Digital Wallet, and Others), Industry Vertical (BFSI, Healthcare, Hospitality & Tourism, Hospitality & Tourism, Transportation & Logistics, Retail & E-commerce, Energy & utilities, and Others): Global Opportunity Analysis and Industry Forecast, 2023-2032
Business-to-consumer or B2C refers selling products and services straight to customers who will personally use them. Most companies that sell directly to buyers are called B2C businesses. The B2C payment market is an essential component of the overall payment ecosystem, particularly in the context of e-commerce, where consumers make purchases from online retailers.
Moreover, the B2C payments domain is experiencing a widening ambit to accommodate flexible options for evolving consumer expectations and merchant requirements. This covers solutions such as account to account bank transfers, mobile payment applications, wearable contactless modes, modern cryptocurrency platforms etc. Each format aims to offer differentiated advantages around cost, security, speed, convenience, and accessibility parameters hence attracting target user base. Instant payment schemes facilitate bank account-to-account transfers in real-time with round-the-clock availability. Bank transfers are now perceived as more convenient options. Mainstream adoption of cryptocurrency payments by brand name merchants such as Microsoft, AT&T, and others is driving increased retail usage of crypto coins.
However, lack of standardization and limited merchant acceptance outside niche categories hinders growth currently. As more money goes into upgrading real-time payments, token tools, and clearing up rules for new companies, people will likely start using these new, fast services more quickly over time. Developments around central bank digital currencies also promise to boost innovation significantly. Overall, the alternate payments segment provides apt competition to cards and wallets to power the next generation B2C transactions ecosystem.
Rise in healthcare costs clubbed with increasing consumption of telemedicine services, wearable diagnosis devices and others are steering patients towards transparent payment tools for expenditure tracking and savings. Adoption of payment apps integrated electronic health records that allow confidential medical data exchange along with insurance claims facilitation offers convenience. Technologies such as tokenization and biometrics also mitigate risks for patients and providers. Personalized financing options for treatment packages augments addressable user base within healthcare payments market. Surge in high-deductible health plans and co-pays/co-insurance costs shift more payment responsibility to patients. Digital payment options enhance patient experience and loyalty.
Telehealth adoption expanding care access and enabling virtual care delivery is coupled with rising usage of digital payment methods for remote consultations. In addition, payment capabilities are being incorporated into platforms for patient communication, medical billing systems, and healthcare facility information technology infrastructure. This allows collection of patient financial obligations through digital methods.
The B2C payment market is segmented by type, industry vertical, and region. In terms of type, the market is fragmented into cards, digital wallet, and others. Depending on industry vertical, it is segmented into BFSI, healthcare, hospitality & tourism, transportation & logistics, retail & e-commerce, energy & utilities, and others. Region-wise, it is analyzed across North America, Europe, Asia-Pacific, Latin America, and Middle East & Africa.
The key players profiled in the B2C payment market analysis are MasterCard Incorporated, The American Express Company, Visa Inc., Apple Pay, PayPal Payments Private Limited, Capital One Financial Corporation, The Bank of America Corporation, Payoneer Inc., Stripe, and Due Inc. These players have adopted various strategies to increase their market penetration and strengthen their position in the industry.
Key Benefits For Stakeholders
- This report provides a quantitative analysis of the market segments, current trends, estimations, and dynamics of the b2c payment market analysis from 2022 to 2032 to identify the prevailing b2c payment market opportunities.
- The market research is offered along with information related to key drivers, restraints, and opportunities.
- Porter's five forces analysis highlights the potency of buyers and suppliers to enable stakeholders make profit-oriented business decisions and strengthen their supplier-buyer network.
- In-depth analysis of the b2c payment market segmentation assists to determine the prevailing market opportunities.
- Major countries in each region are mapped according to their revenue contribution to the global market.
- Market player positioning facilitates benchmarking and provides a clear understanding of the present position of the market players.
- The report includes the analysis of the regional as well as global b2c payment market trends, key players, market segments, application areas, and market growth strategies.
Additional benefits you will get with this purchase are:
- Quarterly Update and* (only available with a corporate license, on listed price)
- 5 additional Company Profile of client Choice pre- or Post-purchase, as a free update.
- Free Upcoming Version on the Purchase of Five and Enterprise User License.
- 16 analyst hours of support* (post-purchase, if you find additional data requirements upon review of the report, you may receive support amounting to 16 analyst hours to solve questions, and post-sale queries)
- 15% Free Customization* (in case the scope or segment of the report does not match your requirements, 15% is equivalent to 3 working days of free work, applicable once)
- Free data Pack on the Five and Enterprise User License. (Excel version of the report)
- Free Updated report if the report is 6-12 months old or older.
- 24-hour priority response*
- Free Industry updates and white papers.
Possible Customization with this report (with additional cost and timeline, please talk to the sales executive to know more)
- Additional company profiles with specific to client's interest
- Expanded list for Company Profiles
- SWOT Analysis
Key Market Segments
By Type
- Cards
- Digital Wallet
- Others
By Industry Vertical
- BFSI
- Healthcare
- Hospitality and Tourism
- Transportation and Logistics
- Retail and E-commerce
- Energy and utilities
- Others
By Region
- North America
- U.S.
- Canada
- Europe
- UK
- Germany
- France
- Italy
- Spain
- Rest of Europe
- Asia-Pacific
- China
- Japan
- India
- Australia
- South Korea
- Rest of Asia-Pacific
- Latin America
- Brazil
- Argentina
- Rest of Latin America
- Middle East and Africa
- Gcc Countries
- South Africa
- Rest of Middle East And Africa
Key Market Players:
- Mastercard Incorporated.
- American Express Company
- Visa Inc.
- Apple Inc.
- PayPal
- Capital One Financial Corporation.
- BANK OF AMERICA CORPORATION
- Payoneer Inc.
- Stripe
- Due Inc.
TABLE OF CONTENTS
CHAPTER 1: INTRODUCTION
- 1.1. Report description
- 1.2. Key market segments
- 1.3. Key benefits to the stakeholders
- 1.4. Research methodology
- 1.4.1. Primary research
- 1.4.2. Secondary research
- 1.4.3. Analyst tools and models
CHAPTER 2: EXECUTIVE SUMMARY
- 2.1. CXO Perspective
CHAPTER 3: MARKET OVERVIEW
- 3.1. Market definition and scope
- 3.2. Key findings
- 3.2.1. Top impacting factors
- 3.2.2. Top investment pockets
- 3.3. Porter's five forces analysis
- 3.4. Market dynamics
- 3.4.1. Drivers
- 3.4.2. Restraints
- 3.4.3. Opportunities
CHAPTER 4: B2C PAYMENT MARKET, BY TYPE
- 4.1. Overview
- 4.1.1. Market size and forecast
- 4.2. Cards
- 4.2.1. Key market trends, growth factors and opportunities
- 4.2.2. Market size and forecast, by region
- 4.2.3. Market share analysis by country
- 4.3. Digital Wallet
- 4.3.1. Key market trends, growth factors and opportunities
- 4.3.2. Market size and forecast, by region
- 4.3.3. Market share analysis by country
- 4.4. Others
- 4.4.1. Key market trends, growth factors and opportunities
- 4.4.2. Market size and forecast, by region
- 4.4.3. Market share analysis by country
CHAPTER 5: B2C PAYMENT MARKET, BY INDUSTRY VERTICAL
- 5.1. Overview
- 5.1.1. Market size and forecast
- 5.2. BFSI
- 5.2.1. Key market trends, growth factors and opportunities
- 5.2.2. Market size and forecast, by region
- 5.2.3. Market share analysis by country
- 5.3. Healthcare
- 5.3.1. Key market trends, growth factors and opportunities
- 5.3.2. Market size and forecast, by region
- 5.3.3. Market share analysis by country
- 5.4. Hospitality and Tourism
- 5.4.1. Key market trends, growth factors and opportunities
- 5.4.2. Market size and forecast, by region
- 5.4.3. Market share analysis by country
- 5.5. Transportation and Logistics
- 5.5.1. Key market trends, growth factors and opportunities
- 5.5.2. Market size and forecast, by region
- 5.5.3. Market share analysis by country
- 5.6. Retail and E-commerce
- 5.6.1. Key market trends, growth factors and opportunities
- 5.6.2. Market size and forecast, by region
- 5.6.3. Market share analysis by country
- 5.7. Energy and utilities
- 5.7.1. Key market trends, growth factors and opportunities
- 5.7.2. Market size and forecast, by region
- 5.7.3. Market share analysis by country
- 5.8. Others
- 5.8.1. Key market trends, growth factors and opportunities
- 5.8.2. Market size and forecast, by region
- 5.8.3. Market share analysis by country
CHAPTER 6: B2C PAYMENT MARKET, BY REGION
- 6.1. Overview
- 6.1.1. Market size and forecast By Region
- 6.2. North America
- 6.2.1. Key market trends, growth factors and opportunities
- 6.2.2. Market size and forecast, by Type
- 6.2.3. Market size and forecast, by Industry Vertical
- 6.2.4. Market size and forecast, by country
- 6.2.4.1. U.S.
- 6.2.4.1.1. Market size and forecast, by Type
- 6.2.4.1.2. Market size and forecast, by Industry Vertical
- 6.2.4.2. Canada
- 6.2.4.2.1. Market size and forecast, by Type
- 6.2.4.2.2. Market size and forecast, by Industry Vertical
- 6.3. Europe
- 6.3.1. Key market trends, growth factors and opportunities
- 6.3.2. Market size and forecast, by Type
- 6.3.3. Market size and forecast, by Industry Vertical
- 6.3.4. Market size and forecast, by country
- 6.3.4.1. UK
- 6.3.4.1.1. Market size and forecast, by Type
- 6.3.4.1.2. Market size and forecast, by Industry Vertical
- 6.3.4.2. Germany
- 6.3.4.2.1. Market size and forecast, by Type
- 6.3.4.2.2. Market size and forecast, by Industry Vertical
- 6.3.4.3. France
- 6.3.4.3.1. Market size and forecast, by Type
- 6.3.4.3.2. Market size and forecast, by Industry Vertical
- 6.3.4.4. Italy
- 6.3.4.4.1. Market size and forecast, by Type
- 6.3.4.4.2. Market size and forecast, by Industry Vertical
- 6.3.4.5. Spain
- 6.3.4.5.1. Market size and forecast, by Type
- 6.3.4.5.2. Market size and forecast, by Industry Vertical
- 6.3.4.6. Rest of Europe
- 6.3.4.6.1. Market size and forecast, by Type
- 6.3.4.6.2. Market size and forecast, by Industry Vertical
- 6.4. Asia-Pacific
- 6.4.1. Key market trends, growth factors and opportunities
- 6.4.2. Market size and forecast, by Type
- 6.4.3. Market size and forecast, by Industry Vertical
- 6.4.4. Market size and forecast, by country
- 6.4.4.1. China
- 6.4.4.1.1. Market size and forecast, by Type
- 6.4.4.1.2. Market size and forecast, by Industry Vertical
- 6.4.4.2. Japan
- 6.4.4.2.1. Market size and forecast, by Type
- 6.4.4.2.2. Market size and forecast, by Industry Vertical
- 6.4.4.3. India
- 6.4.4.3.1. Market size and forecast, by Type
- 6.4.4.3.2. Market size and forecast, by Industry Vertical
- 6.4.4.4. Australia
- 6.4.4.4.1. Market size and forecast, by Type
- 6.4.4.4.2. Market size and forecast, by Industry Vertical
- 6.4.4.5. South Korea
- 6.4.4.5.1. Market size and forecast, by Type
- 6.4.4.5.2. Market size and forecast, by Industry Vertical
- 6.4.4.6. Rest of Asia-Pacific
- 6.4.4.6.1. Market size and forecast, by Type
- 6.4.4.6.2. Market size and forecast, by Industry Vertical
- 6.5. Latin America
- 6.5.1. Key market trends, growth factors and opportunities
- 6.5.2. Market size and forecast, by Type
- 6.5.3. Market size and forecast, by Industry Vertical
- 6.5.4. Market size and forecast, by country
- 6.5.4.1. Brazil
- 6.5.4.1.1. Market size and forecast, by Type
- 6.5.4.1.2. Market size and forecast, by Industry Vertical
- 6.5.4.2. Argentina
- 6.5.4.2.1. Market size and forecast, by Type
- 6.5.4.2.2. Market size and forecast, by Industry Vertical
- 6.5.4.3. Rest of Latin America
- 6.5.4.3.1. Market size and forecast, by Type
- 6.5.4.3.2. Market size and forecast, by Industry Vertical
- 6.6. Middle East and Africa
- 6.6.1. Key market trends, growth factors and opportunities
- 6.6.2. Market size and forecast, by Type
- 6.6.3. Market size and forecast, by Industry Vertical
- 6.6.4. Market size and forecast, by country
- 6.6.4.1. Gcc Countries
- 6.6.4.1.1. Market size and forecast, by Type
- 6.6.4.1.2. Market size and forecast, by Industry Vertical
- 6.6.4.2. South Africa
- 6.6.4.2.1. Market size and forecast, by Type
- 6.6.4.2.2. Market size and forecast, by Industry Vertical
- 6.6.4.3. Rest of Middle East And Africa
- 6.6.4.3.1. Market size and forecast, by Type
- 6.6.4.3.2. Market size and forecast, by Industry Vertical
CHAPTER 7: COMPETITIVE LANDSCAPE
- 7.1. Introduction
- 7.2. Top winning strategies
- 7.3. Product mapping of top 10 player
- 7.4. Competitive dashboard
- 7.5. Competitive heatmap
- 7.6. Top player positioning, 2022
CHAPTER 8: COMPANY PROFILES
- 8.1. Mastercard Incorporated.
- 8.1.1. Company overview
- 8.1.2. Key executives
- 8.1.3. Company snapshot
- 8.1.4. Operating business segments
- 8.1.5. Product portfolio
- 8.1.6. Business performance
- 8.1.7. Key strategic moves and developments
- 8.2. American Express Company
- 8.2.1. Company overview
- 8.2.2. Key executives
- 8.2.3. Company snapshot
- 8.2.4. Operating business segments
- 8.2.5. Product portfolio
- 8.2.6. Business performance
- 8.2.7. Key strategic moves and developments
- 8.3. Visa Inc.
- 8.3.1. Company overview
- 8.3.2. Key executives
- 8.3.3. Company snapshot
- 8.3.4. Operating business segments
- 8.3.5. Product portfolio
- 8.3.6. Business performance
- 8.3.7. Key strategic moves and developments
- 8.4. Apple Inc.
- 8.4.1. Company overview
- 8.4.2. Key executives
- 8.4.3. Company snapshot
- 8.4.4. Operating business segments
- 8.4.5. Product portfolio
- 8.4.6. Business performance
- 8.4.7. Key strategic moves and developments
- 8.5. PayPal
- 8.5.1. Company overview
- 8.5.2. Key executives
- 8.5.3. Company snapshot
- 8.5.4. Operating business segments
- 8.5.5. Product portfolio
- 8.5.6. Business performance
- 8.5.7. Key strategic moves and developments
- 8.6. Capital One Financial Corporation.
- 8.6.1. Company overview
- 8.6.2. Key executives
- 8.6.3. Company snapshot
- 8.6.4. Operating business segments
- 8.6.5. Product portfolio
- 8.6.6. Business performance
- 8.6.7. Key strategic moves and developments
- 8.7. BANK OF AMERICA CORPORATION
- 8.7.1. Company overview
- 8.7.2. Key executives
- 8.7.3. Company snapshot
- 8.7.4. Operating business segments
- 8.7.5. Product portfolio
- 8.7.6. Business performance
- 8.7.7. Key strategic moves and developments
- 8.8. Payoneer Inc.
- 8.8.1. Company overview
- 8.8.2. Key executives
- 8.8.3. Company snapshot
- 8.8.4. Operating business segments
- 8.8.5. Product portfolio
- 8.8.6. Business performance
- 8.8.7. Key strategic moves and developments
- 8.9. Stripe
- 8.9.1. Company overview
- 8.9.2. Key executives
- 8.9.3. Company snapshot
- 8.9.4. Operating business segments
- 8.9.5. Product portfolio
- 8.9.6. Business performance
- 8.9.7. Key strategic moves and developments
- 8.10. Due Inc.
- 8.10.1. Company overview
- 8.10.2. Key executives
- 8.10.3. Company snapshot
- 8.10.4. Operating business segments
- 8.10.5. Product portfolio
- 8.10.6. Business performance
- 8.10.7. Key strategic moves and developments
LIST OF TABLES
- TABLE 01. GLOBAL B2C PAYMENT MARKET, BY TYPE, 2022-2032 ($BILLION)
- TABLE 02. B2C PAYMENT MARKET FOR CARDS, BY REGION, 2022-2032 ($BILLION)
- TABLE 03. B2C PAYMENT MARKET FOR DIGITAL WALLET, BY REGION, 2022-2032 ($BILLION)
- TABLE 04. B2C PAYMENT MARKET FOR OTHERS, BY REGION, 2022-2032 ($BILLION)
- TABLE 05. GLOBAL B2C PAYMENT MARKET, BY INDUSTRY VERTICAL, 2022-2032 ($BILLION)
- TABLE 06. B2C PAYMENT MARKET FOR BFSI, BY REGION, 2022-2032 ($BILLION)
- TABLE 07. B2C PAYMENT MARKET FOR HEALTHCARE, BY REGION, 2022-2032 ($BILLION)
- TABLE 08. B2C PAYMENT MARKET FOR HOSPITALITY AND TOURISM, BY REGION, 2022-2032 ($BILLION)
- TABLE 09. B2C PAYMENT MARKET FOR TRANSPORTATION AND LOGISTICS, BY REGION, 2022-2032 ($BILLION)
- TABLE 10. B2C PAYMENT MARKET FOR RETAIL AND E-COMMERCE, BY REGION, 2022-2032 ($BILLION)
- TABLE 11. B2C PAYMENT MARKET FOR ENERGY AND UTILITIES, BY REGION, 2022-2032 ($BILLION)
- TABLE 12. B2C PAYMENT MARKET FOR OTHERS, BY REGION, 2022-2032 ($BILLION)
- TABLE 13. B2C PAYMENT MARKET, BY REGION, 2022-2032 ($BILLION)
- TABLE 14. NORTH AMERICA B2C PAYMENT MARKET, BY TYPE, 2022-2032 ($BILLION)
- TABLE 15. NORTH AMERICA B2C PAYMENT MARKET, BY INDUSTRY VERTICAL, 2022-2032 ($BILLION)
- TABLE 16. NORTH AMERICA B2C PAYMENT MARKET, BY COUNTRY, 2022-2032 ($BILLION)
- TABLE 17. U.S. B2C PAYMENT MARKET, BY TYPE, 2022-2032 ($BILLION)
- TABLE 18. U.S. B2C PAYMENT MARKET, BY INDUSTRY VERTICAL, 2022-2032 ($BILLION)
- TABLE 19. CANADA B2C PAYMENT MARKET, BY TYPE, 2022-2032 ($BILLION)
- TABLE 20. CANADA B2C PAYMENT MARKET, BY INDUSTRY VERTICAL, 2022-2032 ($BILLION)
- TABLE 21. EUROPE B2C PAYMENT MARKET, BY TYPE, 2022-2032 ($BILLION)
- TABLE 22. EUROPE B2C PAYMENT MARKET, BY INDUSTRY VERTICAL, 2022-2032 ($BILLION)
- TABLE 23. EUROPE B2C PAYMENT MARKET, BY COUNTRY, 2022-2032 ($BILLION)
- TABLE 24. UK B2C PAYMENT MARKET, BY TYPE, 2022-2032 ($BILLION)
- TABLE 25. UK B2C PAYMENT MARKET, BY INDUSTRY VERTICAL, 2022-2032 ($BILLION)
- TABLE 26. GERMANY B2C PAYMENT MARKET, BY TYPE, 2022-2032 ($BILLION)
- TABLE 27. GERMANY B2C PAYMENT MARKET, BY INDUSTRY VERTICAL, 2022-2032 ($BILLION)
- TABLE 28. FRANCE B2C PAYMENT MARKET, BY TYPE, 2022-2032 ($BILLION)
- TABLE 29. FRANCE B2C PAYMENT MARKET, BY INDUSTRY VERTICAL, 2022-2032 ($BILLION)
- TABLE 30. ITALY B2C PAYMENT MARKET, BY TYPE, 2022-2032 ($BILLION)
- TABLE 31. ITALY B2C PAYMENT MARKET, BY INDUSTRY VERTICAL, 2022-2032 ($BILLION)
- TABLE 32. SPAIN B2C PAYMENT MARKET, BY TYPE, 2022-2032 ($BILLION)
- TABLE 33. SPAIN B2C PAYMENT MARKET, BY INDUSTRY VERTICAL, 2022-2032 ($BILLION)
- TABLE 34. REST OF EUROPE B2C PAYMENT MARKET, BY TYPE, 2022-2032 ($BILLION)
- TABLE 35. REST OF EUROPE B2C PAYMENT MARKET, BY INDUSTRY VERTICAL, 2022-2032 ($BILLION)
- TABLE 36. ASIA-PACIFIC B2C PAYMENT MARKET, BY TYPE, 2022-2032 ($BILLION)
- TABLE 37. ASIA-PACIFIC B2C PAYMENT MARKET, BY INDUSTRY VERTICAL, 2022-2032 ($BILLION)
- TABLE 38. ASIA-PACIFIC B2C PAYMENT MARKET, BY COUNTRY, 2022-2032 ($BILLION)
- TABLE 39. CHINA B2C PAYMENT MARKET, BY TYPE, 2022-2032 ($BILLION)
- TABLE 40. CHINA B2C PAYMENT MARKET, BY INDUSTRY VERTICAL, 2022-2032 ($BILLION)
- TABLE 41. JAPAN B2C PAYMENT MARKET, BY TYPE, 2022-2032 ($BILLION)
- TABLE 42. JAPAN B2C PAYMENT MARKET, BY INDUSTRY VERTICAL, 2022-2032 ($BILLION)
- TABLE 43. INDIA B2C PAYMENT MARKET, BY TYPE, 2022-2032 ($BILLION)
- TABLE 44. INDIA B2C PAYMENT MARKET, BY INDUSTRY VERTICAL, 2022-2032 ($BILLION)
- TABLE 45. AUSTRALIA B2C PAYMENT MARKET, BY TYPE, 2022-2032 ($BILLION)
- TABLE 46. AUSTRALIA B2C PAYMENT MARKET, BY INDUSTRY VERTICAL, 2022-2032 ($BILLION)
- TABLE 47. SOUTH KOREA B2C PAYMENT MARKET, BY TYPE, 2022-2032 ($BILLION)
- TABLE 48. SOUTH KOREA B2C PAYMENT MARKET, BY INDUSTRY VERTICAL, 2022-2032 ($BILLION)
- TABLE 49. REST OF ASIA-PACIFIC B2C PAYMENT MARKET, BY TYPE, 2022-2032 ($BILLION)
- TABLE 50. REST OF ASIA-PACIFIC B2C PAYMENT MARKET, BY INDUSTRY VERTICAL, 2022-2032 ($BILLION)
- TABLE 51. LATIN AMERICA B2C PAYMENT MARKET, BY TYPE, 2022-2032 ($BILLION)
- TABLE 52. LATIN AMERICA B2C PAYMENT MARKET, BY INDUSTRY VERTICAL, 2022-2032 ($BILLION)
- TABLE 53. LATIN AMERICA B2C PAYMENT MARKET, BY COUNTRY, 2022-2032 ($BILLION)
- TABLE 54. BRAZIL B2C PAYMENT MARKET, BY TYPE, 2022-2032 ($BILLION)
- TABLE 55. BRAZIL B2C PAYMENT MARKET, BY INDUSTRY VERTICAL, 2022-2032 ($BILLION)
- TABLE 56. ARGENTINA B2C PAYMENT MARKET, BY TYPE, 2022-2032 ($BILLION)
- TABLE 57. ARGENTINA B2C PAYMENT MARKET, BY INDUSTRY VERTICAL, 2022-2032 ($BILLION)
- TABLE 58. REST OF LATIN AMERICA B2C PAYMENT MARKET, BY TYPE, 2022-2032 ($BILLION)
- TABLE 59. REST OF LATIN AMERICA B2C PAYMENT MARKET, BY INDUSTRY VERTICAL, 2022-2032 ($BILLION)
- TABLE 60. MIDDLE EAST AND AFRICA B2C PAYMENT MARKET, BY TYPE, 2022-2032 ($BILLION)
- TABLE 61. MIDDLE EAST AND AFRICA B2C PAYMENT MARKET, BY INDUSTRY VERTICAL, 2022-2032 ($BILLION)
- TABLE 62. MIDDLE EAST AND AFRICA B2C PAYMENT MARKET, BY COUNTRY, 2022-2032 ($BILLION)
- TABLE 63. GCC COUNTRIES B2C PAYMENT MARKET, BY TYPE, 2022-2032 ($BILLION)
- TABLE 64. GCC COUNTRIES B2C PAYMENT MARKET, BY INDUSTRY VERTICAL, 2022-2032 ($BILLION)
- TABLE 65. SOUTH AFRICA B2C PAYMENT MARKET, BY TYPE, 2022-2032 ($BILLION)
- TABLE 66. SOUTH AFRICA B2C PAYMENT MARKET, BY INDUSTRY VERTICAL, 2022-2032 ($BILLION)
- TABLE 67. REST OF MIDDLE EAST AND AFRICA B2C PAYMENT MARKET, BY TYPE, 2022-2032 ($BILLION)
- TABLE 68. REST OF MIDDLE EAST AND AFRICA B2C PAYMENT MARKET, BY INDUSTRY VERTICAL, 2022-2032 ($BILLION)
- TABLE 69. MASTERCARD INCORPORATED.: KEY EXECUTIVES
- TABLE 70. MASTERCARD INCORPORATED.: COMPANY SNAPSHOT
- TABLE 71. MASTERCARD INCORPORATED.: PRODUCT SEGMENTS
- TABLE 72. MASTERCARD INCORPORATED.: SERVICE SEGMENTS
- TABLE 73. MASTERCARD INCORPORATED.: PRODUCT PORTFOLIO
- TABLE 74. MASTERCARD INCORPORATED.: KEY STRATERGIES
- TABLE 75. AMERICAN EXPRESS COMPANY: KEY EXECUTIVES
- TABLE 76. AMERICAN EXPRESS COMPANY: COMPANY SNAPSHOT
- TABLE 77. AMERICAN EXPRESS COMPANY: PRODUCT SEGMENTS
- TABLE 78. AMERICAN EXPRESS COMPANY: SERVICE SEGMENTS
- TABLE 79. AMERICAN EXPRESS COMPANY: PRODUCT PORTFOLIO
- TABLE 80. AMERICAN EXPRESS COMPANY: KEY STRATERGIES
- TABLE 81. VISA INC.: KEY EXECUTIVES
- TABLE 82. VISA INC.: COMPANY SNAPSHOT
- TABLE 83. VISA INC.: PRODUCT SEGMENTS
- TABLE 84. VISA INC.: SERVICE SEGMENTS
- TABLE 85. VISA INC.: PRODUCT PORTFOLIO
- TABLE 86. VISA INC.: KEY STRATERGIES
- TABLE 87. APPLE INC.: KEY EXECUTIVES
- TABLE 88. APPLE INC.: COMPANY SNAPSHOT
- TABLE 89. APPLE INC.: PRODUCT SEGMENTS
- TABLE 90. APPLE INC.: SERVICE SEGMENTS
- TABLE 91. APPLE INC.: PRODUCT PORTFOLIO
- TABLE 92. APPLE INC.: KEY STRATERGIES
- TABLE 93. PAYPAL: KEY EXECUTIVES
- TABLE 94. PAYPAL: COMPANY SNAPSHOT
- TABLE 95. PAYPAL: PRODUCT SEGMENTS
- TABLE 96. PAYPAL: SERVICE SEGMENTS
- TABLE 97. PAYPAL: PRODUCT PORTFOLIO
- TABLE 98. PAYPAL: KEY STRATERGIES
- TABLE 99. CAPITAL ONE FINANCIAL CORPORATION.: KEY EXECUTIVES
- TABLE 100. CAPITAL ONE FINANCIAL CORPORATION.: COMPANY SNAPSHOT
- TABLE 101. CAPITAL ONE FINANCIAL CORPORATION.: PRODUCT SEGMENTS
- TABLE 102. CAPITAL ONE FINANCIAL CORPORATION.: SERVICE SEGMENTS
- TABLE 103. CAPITAL ONE FINANCIAL CORPORATION.: PRODUCT PORTFOLIO
- TABLE 104. CAPITAL ONE FINANCIAL CORPORATION.: KEY STRATERGIES
- TABLE 105. BANK OF AMERICA CORPORATION: KEY EXECUTIVES
- TABLE 106. BANK OF AMERICA CORPORATION: COMPANY SNAPSHOT
- TABLE 107. BANK OF AMERICA CORPORATION: PRODUCT SEGMENTS
- TABLE 108. BANK OF AMERICA CORPORATION: SERVICE SEGMENTS
- TABLE 109. BANK OF AMERICA CORPORATION: PRODUCT PORTFOLIO
- TABLE 110. BANK OF AMERICA CORPORATION: KEY STRATERGIES
- TABLE 111. PAYONEER INC.: KEY EXECUTIVES
- TABLE 112. PAYONEER INC.: COMPANY SNAPSHOT
- TABLE 113. PAYONEER INC.: PRODUCT SEGMENTS
- TABLE 114. PAYONEER INC.: SERVICE SEGMENTS
- TABLE 115. PAYONEER INC.: PRODUCT PORTFOLIO
- TABLE 116. PAYONEER INC.: KEY STRATERGIES
- TABLE 117. STRIPE: KEY EXECUTIVES
- TABLE 118. STRIPE: COMPANY SNAPSHOT
- TABLE 119. STRIPE: PRODUCT SEGMENTS
- TABLE 120. STRIPE: SERVICE SEGMENTS
- TABLE 121. STRIPE: PRODUCT PORTFOLIO
- TABLE 122. STRIPE: KEY STRATERGIES
- TABLE 123. DUE INC.: KEY EXECUTIVES
- TABLE 124. DUE INC.: COMPANY SNAPSHOT
- TABLE 125. DUE INC.: PRODUCT SEGMENTS
- TABLE 126. DUE INC.: SERVICE SEGMENTS
- TABLE 127. DUE INC.: PRODUCT PORTFOLIO
- TABLE 128. DUE INC.: KEY STRATERGIES
LIST OF FIGURES
- FIGURE 01. B2C PAYMENT MARKET, 2022-2032
- FIGURE 02. SEGMENTATION OF B2C PAYMENT MARKET,2022-2032
- FIGURE 03. TOP IMPACTING FACTORS IN B2C PAYMENT MARKET
- FIGURE 04. TOP INVESTMENT POCKETS IN B2C PAYMENT MARKET (2023-2032)
- FIGURE 05. BARGAINING POWER OF SUPPLIERS
- FIGURE 06. BARGAINING POWER OF BUYERS
- FIGURE 07. THREAT OF SUBSTITUTION
- FIGURE 08. THREAT OF SUBSTITUTION
- FIGURE 09. COMPETITIVE RIVALRY
- FIGURE 10. GLOBAL B2C PAYMENT MARKET:DRIVERS, RESTRAINTS AND OPPORTUNITIES
- FIGURE 11. B2C PAYMENT MARKET, BY TYPE, 2022 AND 2032(%)
- FIGURE 12. COMPARATIVE SHARE ANALYSIS OF B2C PAYMENT MARKET FOR CARDS, BY COUNTRY 2022 AND 2032(%)
- FIGURE 13. COMPARATIVE SHARE ANALYSIS OF B2C PAYMENT MARKET FOR DIGITAL WALLET, BY COUNTRY 2022 AND 2032(%)
- FIGURE 14. COMPARATIVE SHARE ANALYSIS OF B2C PAYMENT MARKET FOR OTHERS, BY COUNTRY 2022 AND 2032(%)
- FIGURE 15. B2C PAYMENT MARKET, BY INDUSTRY VERTICAL, 2022 AND 2032(%)
- FIGURE 16. COMPARATIVE SHARE ANALYSIS OF B2C PAYMENT MARKET FOR BFSI, BY COUNTRY 2022 AND 2032(%)
- FIGURE 17. COMPARATIVE SHARE ANALYSIS OF B2C PAYMENT MARKET FOR HEALTHCARE, BY COUNTRY 2022 AND 2032(%)
- FIGURE 18. COMPARATIVE SHARE ANALYSIS OF B2C PAYMENT MARKET FOR HOSPITALITY AND TOURISM, BY COUNTRY 2022 AND 2032(%)
- FIGURE 19. COMPARATIVE SHARE ANALYSIS OF B2C PAYMENT MARKET FOR TRANSPORTATION AND LOGISTICS, BY COUNTRY 2022 AND 2032(%)
- FIGURE 20. COMPARATIVE SHARE ANALYSIS OF B2C PAYMENT MARKET FOR RETAIL AND E-COMMERCE, BY COUNTRY 2022 AND 2032(%)
- FIGURE 21. COMPARATIVE SHARE ANALYSIS OF B2C PAYMENT MARKET FOR ENERGY AND UTILITIES, BY COUNTRY 2022 AND 2032(%)
- FIGURE 22. COMPARATIVE SHARE ANALYSIS OF B2C PAYMENT MARKET FOR OTHERS, BY COUNTRY 2022 AND 2032(%)
- FIGURE 23. B2C PAYMENT MARKET BY REGION, 2022 AND 2032(%)
- FIGURE 24. U.S. B2C PAYMENT MARKET, 2022-2032 ($BILLION)
- FIGURE 25. CANADA B2C PAYMENT MARKET, 2022-2032 ($BILLION)
- FIGURE 26. UK B2C PAYMENT MARKET, 2022-2032 ($BILLION)
- FIGURE 27. GERMANY B2C PAYMENT MARKET, 2022-2032 ($BILLION)
- FIGURE 28. FRANCE B2C PAYMENT MARKET, 2022-2032 ($BILLION)
- FIGURE 29. ITALY B2C PAYMENT MARKET, 2022-2032 ($BILLION)
- FIGURE 30. SPAIN B2C PAYMENT MARKET, 2022-2032 ($BILLION)
- FIGURE 31. REST OF EUROPE B2C PAYMENT MARKET, 2022-2032 ($BILLION)
- FIGURE 32. CHINA B2C PAYMENT MARKET, 2022-2032 ($BILLION)
- FIGURE 33. JAPAN B2C PAYMENT MARKET, 2022-2032 ($BILLION)
- FIGURE 34. INDIA B2C PAYMENT MARKET, 2022-2032 ($BILLION)
- FIGURE 35. AUSTRALIA B2C PAYMENT MARKET, 2022-2032 ($BILLION)
- FIGURE 36. SOUTH KOREA B2C PAYMENT MARKET, 2022-2032 ($BILLION)
- FIGURE 37. REST OF ASIA-PACIFIC B2C PAYMENT MARKET, 2022-2032 ($BILLION)
- FIGURE 38. BRAZIL B2C PAYMENT MARKET, 2022-2032 ($BILLION)
- FIGURE 39. ARGENTINA B2C PAYMENT MARKET, 2022-2032 ($BILLION)
- FIGURE 40. REST OF LATIN AMERICA B2C PAYMENT MARKET, 2022-2032 ($BILLION)
- FIGURE 41. GCC COUNTRIES B2C PAYMENT MARKET, 2022-2032 ($BILLION)
- FIGURE 42. SOUTH AFRICA B2C PAYMENT MARKET, 2022-2032 ($BILLION)
- FIGURE 43. REST OF MIDDLE EAST AND AFRICA B2C PAYMENT MARKET, 2022-2032 ($BILLION)
- FIGURE 44. TOP WINNING STRATEGIES, BY YEAR
- FIGURE 45. TOP WINNING STRATEGIES, BY DEVELOPMENT
- FIGURE 46. TOP WINNING STRATEGIES, BY COMPANY
- FIGURE 47. PRODUCT MAPPING OF TOP 10 PLAYERS
- FIGURE 48. COMPETITIVE DASHBOARD
- FIGURE 49. COMPETITIVE HEATMAP: B2C PAYMENT MARKET
- FIGURE 50. TOP PLAYER POSITIONING, 2022

