
PUBLISHER: Allied Market Research | PRODUCT CODE: 1472237

PUBLISHER: Allied Market Research | PRODUCT CODE: 1472237
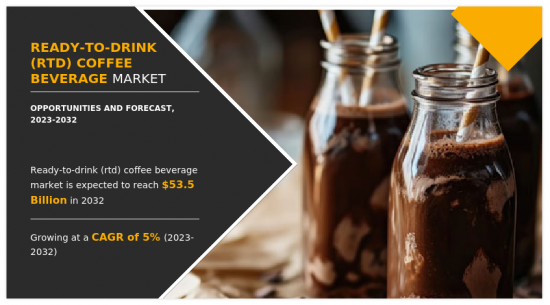
Ready-to-drink Coffee Beverage Market By Product Type, By Cream Content, By Packaging, By Distribution Channel : Global Opportunity Analysis and Industry Forecast, 2023-2032
The global ready-to-drink coffee market was valued at $33,032.50 million in 2022, and is projected to reach $53,542.90 million by 2032, registering a CAGR of 5.1% from 2023 to 2032.
Ready-to-drink (RTD) coffee is a pre-packaged and instantly consumable beverage, which eliminates the need for brewing or additional preparation. RTD coffee is available in various flavors and formulations, that combines brewed coffee with additives such as milk, sweeteners, and flavorings. As the coffee is packed in bottles, cans, and tetra packs, ready-to-drink coffee provides a convenient and portable option for coffee enthusiasts seeking a quick and hassle-free coffee experience without the time constraints of traditional brewing methods.
The cold consumption nature of ready-to-drink coffee has played a significant role in surging market demand, particularly with the growing popularity of cold brew variants. Cold coffee beverages are appealing to consumers for various reasons, including their refreshing and smooth flavor profile, lower acidity compared to hot coffee, and suitability for consumption in warmer weather. The rise in demand for cold brew ready-to-drink coffee can be attributed to the consumer preference for chilled and ready-to-consume options, aligning with modern lifestyles that prioritize convenience and immediacy.
The rise of cold coffee variants has also developed the need for innovation within the ready-to-drink coffee market. Manufacturers have started introducing new and unique cold brew flavors, experimenting with different brewing techniques, and incorporating novel ingredients to cater to diverse consumer tastes. This innovation has created a dynamic market landscape, capturing the interest of consumers seeking novel and exciting experiences. Additionally, the longer shelf life of cold brew ready-to-drink coffee, compared to traditional hot coffee beverages, contributes to its market appeal, allowing for convenient storage and consumption over an extended period. As a result, the cold coffee nature of ready-to-drink coffee has become a key driver, shaping consumer preferences, and boosting the overall market demand for ready-to-drink coffee as a versatile and refreshing beverage choice in the fast-paced and ever-evolving beverage industry.
However, dependency on coffee bean prices poses a significant restraint on the ready-to-drink coffee market as fluctuations in the cost of coffee beans directly impact production expenses. Coffee bean prices are subject to various factors, including weather conditions, geopolitical events, and supply chain disruptions. When coffee bean prices rise, manufacturers may face increased production costs, potentially leading to higher retail prices for ready-to-drink coffee products. The increase in price of the product is anticipated to make ready-to-drink coffee less affordable for price-sensitive consumers, resulting in a decline in market demand, especially during economic downturns and periods of financial uncertainty.
The volatility in coffee bean prices can create challenges for long-term planning and budgeting within the ready-to-drink coffee industry. Manufacturers may find it difficult to predict and manage production costs, affecting profit margins and overall business sustainability. In addition, the dependency on coffee bean prices makes the ready-to-drink coffee market vulnerable to external factors beyond the industry's control, making it essential for businesses to implement strategic risk management practices. Thus, the increase in level of uncertainty is anticipated to discourage investment and expansion initiatives within the ready-to-drink coffee sector, limiting the growth potential of the market and potentially hindering innovation in product development.
Premiumization has created significant opportunities in the ready-to-drink (RTD) coffee market by appealing to consumers seeking refined coffee experiences. As consumers increasingly prioritize quality, uniqueness, and superior taste, there is a growing demand for premium RTD coffee products that go beyond basic offerings. As a result, market players have started introducing high-quality, specialty blends, and unique flavor profiles that stand out from standard options, offering a more refined and indulgent coffee-drinking experience.
Moreover, the premiumization trend extends beyond the coffee itself to include upscale packaging, branding, and marketing strategies. Premium RTD coffee products often feature aesthetically pleasing and innovative packaging, enhancing the overall perceived value. Premium brands may invest in premium marketing campaigns, emphasizing the nature of their products and the quality of the ingredients used. As consumers are willing to pay a premium for a superior and distinctive product, the premiumization trend drives revenue growth for RTD coffee manufacturers and increases the overall perception of RTD coffee as a desirable beverage choice.
The ready-to-drink coffee market is analyzed on the basis of product type, cream content, packaging, distribution channel, and region. By product type, the market is segmented into cold brew and others. By cream content, the market is divided into dairy-based and plant based. Depending on packaging, it is classified into bottles, cans, and tetra packs. By distribution channel, the market is divided into supermarkets/hypermarkets, departmental stores, convenience stores, online sales channel, and others. Region-wise, the market is analyzed across North America (the U.S., Canada, and Mexico), Europe (Germany, the UK, France, Italy, Spain, and the rest of Europe), Asia-Pacific (China, India, Japan, South Korea, Australia, ASEAN, and the rest of Asia-Pacific), Latin America (Brazil, Colombia, Argentina, and the rest of Latin America), and Middle East and Africa (GCC, South Africa, North Africa, and the rest of MEA).
The major players operating in the global ready-to-drink coffee market are Nestle SA, The Coca-Cola Company, Starbucks Corporation, illycaffe S.p.A., Danone SA, Lotte Chilsung Beverage Co., Califia Farms, LLC, La Colombe Coffee Roasters, Suntory Beverage & Food Limited, and Gujarat Co-Operative Milk Marketing Federation.
Key Benefits For Stakeholders
- This report provides a quantitative analysis of the market segments, current trends, estimations, and dynamics of the ready-to-drink (rtd) coffee beverage market analysis from 2022 to 2032 to identify the prevailing ready-to-drink (rtd) coffee beverage market opportunities.
- The market research is offered along with information related to key drivers, restraints, and opportunities.
- Porter's five forces analysis highlights the potency of buyers and suppliers to enable stakeholders make profit-oriented business decisions and strengthen their supplier-buyer network.
- In-depth analysis of the ready-to-drink (rtd) coffee beverage market segmentation assists to determine the prevailing market opportunities.
- Major countries in each region are mapped according to their revenue contribution to the global market.
- Market player positioning facilitates benchmarking and provides a clear understanding of the present position of the market players.
- The report includes the analysis of the regional as well as global ready-to-drink (rtd) coffee beverage market trends, key players, market segments, application areas, and market growth strategies.
Additional benefits you will get with this purchase are:
- Quarterly Update and* (only available with a corporate license, on listed price)
- 5 additional Company Profile of client Choice pre- or Post-purchase, as a free update.
- Free Upcoming Version on the Purchase of Five and Enterprise User License.
- 16 analyst hours of support* (post-purchase, if you find additional data requirements upon review of the report, you may receive support amounting to 16 analyst hours to solve questions, and post-sale queries)
- 15% Free Customization* (in case the scope or segment of the report does not match your requirements, 15% is equivalent to 3 working days of free work, applicable once)
- Free data Pack on the Five and Enterprise User License. (Excel version of the report)
- Free Updated report if the report is 6-12 months old or older.
- 24-hour priority response*
- Free Industry updates and white papers.
Possible Customization with this report (with additional cost and timeline, please talk to the sales executive to know more)
- Product Life Cycles
- Supply Chain Analysis & Vendor Margins
- Consumer Preference and Product Specifications
- Regulatory Guidelines
- Additional company profiles with specific to client's interest
- Additional country or region analysis- market size and forecast
- Expanded list for Company Profiles
- Historic market data
- Import Export Analysis/Data
- Key player details (including location, contact details, supplier/vendor network etc. in excel format)
- Market share analysis of players at global/region/country level
- SWOT Analysis
Key Market Segments
By Product Type
- Cold Brew
- Others
By Cream Content
- Dairy-based
- Plant-based
By Packaging
- Bottles
- Cans
- Tetra Packs
By Distribution Channel
- Supermarkets-Hypermarkets
- Departmental Stores
- Convenience Stores
- Online Sales Channel
- Others
By Region
- North America
- U.S.
- Canada
- Mexico
- Europe
- Germany
- UK
- France
- Italy
- Spain
- Rest of Europe
- Asia-Pacific
- China
- India
- Japan
- South Korea
- Australia
- Asean
- Rest of Asia-Pacific
- Latin America
- Brazil
- Colombia
- Argentina
- Rest of Latin America
- Middle East and Africa
- Gcc
- South Africa
- Rest of Middle East And Africa
Key Market Players:
- Nestle SA
- The Coca-Cola Company
- Starbucks Corporation
- Illycaffe S.p.A.
- Danone SA
- Lotte Chilsung Beverage Co.
- Califia Farms, LLC
- La Colombe Coffee Roasters
- Suntory Beverage & Food Limited
- Gujarat Co-Operative Milk Marketing Federation
TABLE OF CONTENTS
CHAPTER 1: INTRODUCTION
- 1.1. Report description
- 1.2. Key market segments
- 1.3. Key benefits to the stakeholders
- 1.4. Research methodology
- 1.4.1. Primary research
- 1.4.2. Secondary research
- 1.4.3. Analyst tools and models
CHAPTER 2: EXECUTIVE SUMMARY
- 2.1. CXO perspective
CHAPTER 3: MARKET OVERVIEW
- 3.1. Market definition and scope
- 3.2. Key findings
- 3.2.1. Top impacting factors
- 3.2.2. Top investment pockets
- 3.3. Porter's five forces analysis
- 3.4. Market dynamics
- 3.4.1. Drivers
- 3.4.2. Restraints
- 3.4.3. Opportunities
CHAPTER 4: READY-TO-DRINK (RTD) COFFEE BEVERAGE MARKET, BY PRODUCT TYPE
- 4.1. Overview
- 4.1.1. Market size and forecast
- 4.2. Cold Brew
- 4.2.1. Key market trends, growth factors and opportunities
- 4.2.2. Market size and forecast, by region
- 4.2.3. Market share analysis by country
- 4.3. Others
- 4.3.1. Key market trends, growth factors and opportunities
- 4.3.2. Market size and forecast, by region
- 4.3.3. Market share analysis by country
CHAPTER 5: READY-TO-DRINK (RTD) COFFEE BEVERAGE MARKET, BY CREAM CONTENT
- 5.1. Overview
- 5.1.1. Market size and forecast
- 5.2. Dairy-based
- 5.2.1. Key market trends, growth factors and opportunities
- 5.2.2. Market size and forecast, by region
- 5.2.3. Market share analysis by country
- 5.3. Plant-based
- 5.3.1. Key market trends, growth factors and opportunities
- 5.3.2. Market size and forecast, by region
- 5.3.3. Market share analysis by country
CHAPTER 6: READY-TO-DRINK (RTD) COFFEE BEVERAGE MARKET, BY PACKAGING
- 6.1. Overview
- 6.1.1. Market size and forecast
- 6.2. Bottles
- 6.2.1. Key market trends, growth factors and opportunities
- 6.2.2. Market size and forecast, by region
- 6.2.3. Market share analysis by country
- 6.3. Cans
- 6.3.1. Key market trends, growth factors and opportunities
- 6.3.2. Market size and forecast, by region
- 6.3.3. Market share analysis by country
- 6.4. Tetra Packs
- 6.4.1. Key market trends, growth factors and opportunities
- 6.4.2. Market size and forecast, by region
- 6.4.3. Market share analysis by country
CHAPTER 7: READY-TO-DRINK (RTD) COFFEE BEVERAGE MARKET, BY DISTRIBUTION CHANNEL
- 7.1. Overview
- 7.1.1. Market size and forecast
- 7.2. Supermarkets-Hypermarkets
- 7.2.1. Key market trends, growth factors and opportunities
- 7.2.2. Market size and forecast, by region
- 7.2.3. Market share analysis by country
- 7.3. Departmental Stores
- 7.3.1. Key market trends, growth factors and opportunities
- 7.3.2. Market size and forecast, by region
- 7.3.3. Market share analysis by country
- 7.4. Convenience Stores
- 7.4.1. Key market trends, growth factors and opportunities
- 7.4.2. Market size and forecast, by region
- 7.4.3. Market share analysis by country
- 7.5. Online Sales Channel
- 7.5.1. Key market trends, growth factors and opportunities
- 7.5.2. Market size and forecast, by region
- 7.5.3. Market share analysis by country
- 7.6. Others
- 7.6.1. Key market trends, growth factors and opportunities
- 7.6.2. Market size and forecast, by region
- 7.6.3. Market share analysis by country
CHAPTER 8: READY-TO-DRINK (RTD) COFFEE BEVERAGE MARKET, BY REGION
- 8.1. Overview
- 8.1.1. Market size and forecast By Region
- 8.2. North America
- 8.2.1. Key market trends, growth factors and opportunities
- 8.2.2. Market size and forecast, by Product Type
- 8.2.3. Market size and forecast, by Cream Content
- 8.2.4. Market size and forecast, by Packaging
- 8.2.5. Market size and forecast, by Distribution Channel
- 8.2.6. Market size and forecast, by country
- 8.2.6.1. U.S.
- 8.2.6.1.1. Market size and forecast, by Product Type
- 8.2.6.1.2. Market size and forecast, by Cream Content
- 8.2.6.1.3. Market size and forecast, by Packaging
- 8.2.6.1.4. Market size and forecast, by Distribution Channel
- 8.2.6.2. Canada
- 8.2.6.2.1. Market size and forecast, by Product Type
- 8.2.6.2.2. Market size and forecast, by Cream Content
- 8.2.6.2.3. Market size and forecast, by Packaging
- 8.2.6.2.4. Market size and forecast, by Distribution Channel
- 8.2.6.3. Mexico
- 8.2.6.3.1. Market size and forecast, by Product Type
- 8.2.6.3.2. Market size and forecast, by Cream Content
- 8.2.6.3.3. Market size and forecast, by Packaging
- 8.2.6.3.4. Market size and forecast, by Distribution Channel
- 8.3. Europe
- 8.3.1. Key market trends, growth factors and opportunities
- 8.3.2. Market size and forecast, by Product Type
- 8.3.3. Market size and forecast, by Cream Content
- 8.3.4. Market size and forecast, by Packaging
- 8.3.5. Market size and forecast, by Distribution Channel
- 8.3.6. Market size and forecast, by country
- 8.3.6.1. Germany
- 8.3.6.1.1. Market size and forecast, by Product Type
- 8.3.6.1.2. Market size and forecast, by Cream Content
- 8.3.6.1.3. Market size and forecast, by Packaging
- 8.3.6.1.4. Market size and forecast, by Distribution Channel
- 8.3.6.2. UK
- 8.3.6.2.1. Market size and forecast, by Product Type
- 8.3.6.2.2. Market size and forecast, by Cream Content
- 8.3.6.2.3. Market size and forecast, by Packaging
- 8.3.6.2.4. Market size and forecast, by Distribution Channel
- 8.3.6.3. France
- 8.3.6.3.1. Market size and forecast, by Product Type
- 8.3.6.3.2. Market size and forecast, by Cream Content
- 8.3.6.3.3. Market size and forecast, by Packaging
- 8.3.6.3.4. Market size and forecast, by Distribution Channel
- 8.3.6.4. Italy
- 8.3.6.4.1. Market size and forecast, by Product Type
- 8.3.6.4.2. Market size and forecast, by Cream Content
- 8.3.6.4.3. Market size and forecast, by Packaging
- 8.3.6.4.4. Market size and forecast, by Distribution Channel
- 8.3.6.5. Spain
- 8.3.6.5.1. Market size and forecast, by Product Type
- 8.3.6.5.2. Market size and forecast, by Cream Content
- 8.3.6.5.3. Market size and forecast, by Packaging
- 8.3.6.5.4. Market size and forecast, by Distribution Channel
- 8.3.6.6. Rest of Europe
- 8.3.6.6.1. Market size and forecast, by Product Type
- 8.3.6.6.2. Market size and forecast, by Cream Content
- 8.3.6.6.3. Market size and forecast, by Packaging
- 8.3.6.6.4. Market size and forecast, by Distribution Channel
- 8.4. Asia-Pacific
- 8.4.1. Key market trends, growth factors and opportunities
- 8.4.2. Market size and forecast, by Product Type
- 8.4.3. Market size and forecast, by Cream Content
- 8.4.4. Market size and forecast, by Packaging
- 8.4.5. Market size and forecast, by Distribution Channel
- 8.4.6. Market size and forecast, by country
- 8.4.6.1. China
- 8.4.6.1.1. Market size and forecast, by Product Type
- 8.4.6.1.2. Market size and forecast, by Cream Content
- 8.4.6.1.3. Market size and forecast, by Packaging
- 8.4.6.1.4. Market size and forecast, by Distribution Channel
- 8.4.6.2. India
- 8.4.6.2.1. Market size and forecast, by Product Type
- 8.4.6.2.2. Market size and forecast, by Cream Content
- 8.4.6.2.3. Market size and forecast, by Packaging
- 8.4.6.2.4. Market size and forecast, by Distribution Channel
- 8.4.6.3. Japan
- 8.4.6.3.1. Market size and forecast, by Product Type
- 8.4.6.3.2. Market size and forecast, by Cream Content
- 8.4.6.3.3. Market size and forecast, by Packaging
- 8.4.6.3.4. Market size and forecast, by Distribution Channel
- 8.4.6.4. South Korea
- 8.4.6.4.1. Market size and forecast, by Product Type
- 8.4.6.4.2. Market size and forecast, by Cream Content
- 8.4.6.4.3. Market size and forecast, by Packaging
- 8.4.6.4.4. Market size and forecast, by Distribution Channel
- 8.4.6.5. Australia
- 8.4.6.5.1. Market size and forecast, by Product Type
- 8.4.6.5.2. Market size and forecast, by Cream Content
- 8.4.6.5.3. Market size and forecast, by Packaging
- 8.4.6.5.4. Market size and forecast, by Distribution Channel
- 8.4.6.6. Asean
- 8.4.6.6.1. Market size and forecast, by Product Type
- 8.4.6.6.2. Market size and forecast, by Cream Content
- 8.4.6.6.3. Market size and forecast, by Packaging
- 8.4.6.6.4. Market size and forecast, by Distribution Channel
- 8.4.6.7. Rest of Asia-Pacific
- 8.4.6.7.1. Market size and forecast, by Product Type
- 8.4.6.7.2. Market size and forecast, by Cream Content
- 8.4.6.7.3. Market size and forecast, by Packaging
- 8.4.6.7.4. Market size and forecast, by Distribution Channel
- 8.5. Latin America
- 8.5.1. Key market trends, growth factors and opportunities
- 8.5.2. Market size and forecast, by Product Type
- 8.5.3. Market size and forecast, by Cream Content
- 8.5.4. Market size and forecast, by Packaging
- 8.5.5. Market size and forecast, by Distribution Channel
- 8.5.6. Market size and forecast, by country
- 8.5.6.1. Brazil
- 8.5.6.1.1. Market size and forecast, by Product Type
- 8.5.6.1.2. Market size and forecast, by Cream Content
- 8.5.6.1.3. Market size and forecast, by Packaging
- 8.5.6.1.4. Market size and forecast, by Distribution Channel
- 8.5.6.2. Colombia
- 8.5.6.2.1. Market size and forecast, by Product Type
- 8.5.6.2.2. Market size and forecast, by Cream Content
- 8.5.6.2.3. Market size and forecast, by Packaging
- 8.5.6.2.4. Market size and forecast, by Distribution Channel
- 8.5.6.3. Argentina
- 8.5.6.3.1. Market size and forecast, by Product Type
- 8.5.6.3.2. Market size and forecast, by Cream Content
- 8.5.6.3.3. Market size and forecast, by Packaging
- 8.5.6.3.4. Market size and forecast, by Distribution Channel
- 8.5.6.4. Rest of Latin America
- 8.5.6.4.1. Market size and forecast, by Product Type
- 8.5.6.4.2. Market size and forecast, by Cream Content
- 8.5.6.4.3. Market size and forecast, by Packaging
- 8.5.6.4.4. Market size and forecast, by Distribution Channel
- 8.6. Middle East and Africa
- 8.6.1. Key market trends, growth factors and opportunities
- 8.6.2. Market size and forecast, by Product Type
- 8.6.3. Market size and forecast, by Cream Content
- 8.6.4. Market size and forecast, by Packaging
- 8.6.5. Market size and forecast, by Distribution Channel
- 8.6.6. Market size and forecast, by country
- 8.6.6.1. Gcc
- 8.6.6.1.1. Market size and forecast, by Product Type
- 8.6.6.1.2. Market size and forecast, by Cream Content
- 8.6.6.1.3. Market size and forecast, by Packaging
- 8.6.6.1.4. Market size and forecast, by Distribution Channel
- 8.6.6.2. South Africa
- 8.6.6.2.1. Market size and forecast, by Product Type
- 8.6.6.2.2. Market size and forecast, by Cream Content
- 8.6.6.2.3. Market size and forecast, by Packaging
- 8.6.6.2.4. Market size and forecast, by Distribution Channel
- 8.6.6.3. Rest of Middle East And Africa
- 8.6.6.3.1. Market size and forecast, by Product Type
- 8.6.6.3.2. Market size and forecast, by Cream Content
- 8.6.6.3.3. Market size and forecast, by Packaging
- 8.6.6.3.4. Market size and forecast, by Distribution Channel
CHAPTER 9: COMPETITIVE LANDSCAPE
- 9.1. Introduction
- 9.2. Top winning strategies
- 9.3. Product mapping of top 10 player
- 9.4. Competitive dashboard
- 9.5. Competitive heatmap
- 9.6. Top player positioning, 2022
CHAPTER 10: COMPANY PROFILES
- 10.1. Nestle SA
- 10.1.1. Company overview
- 10.1.2. Key executives
- 10.1.3. Company snapshot
- 10.1.4. Operating business segments
- 10.1.5. Product portfolio
- 10.1.6. Business performance
- 10.1.7. Key strategic moves and developments
- 10.2. The Coca-Cola Company
- 10.2.1. Company overview
- 10.2.2. Key executives
- 10.2.3. Company snapshot
- 10.2.4. Operating business segments
- 10.2.5. Product portfolio
- 10.2.6. Business performance
- 10.2.7. Key strategic moves and developments
- 10.3. Starbucks Corporation
- 10.3.1. Company overview
- 10.3.2. Key executives
- 10.3.3. Company snapshot
- 10.3.4. Operating business segments
- 10.3.5. Product portfolio
- 10.3.6. Business performance
- 10.3.7. Key strategic moves and developments
- 10.4. Illycaffe S.p.A.
- 10.4.1. Company overview
- 10.4.2. Key executives
- 10.4.3. Company snapshot
- 10.4.4. Operating business segments
- 10.4.5. Product portfolio
- 10.4.6. Business performance
- 10.4.7. Key strategic moves and developments
- 10.5. Danone SA
- 10.5.1. Company overview
- 10.5.2. Key executives
- 10.5.3. Company snapshot
- 10.5.4. Operating business segments
- 10.5.5. Product portfolio
- 10.5.6. Business performance
- 10.5.7. Key strategic moves and developments
- 10.6. Lotte Chilsung Beverage Co.
- 10.6.1. Company overview
- 10.6.2. Key executives
- 10.6.3. Company snapshot
- 10.6.4. Operating business segments
- 10.6.5. Product portfolio
- 10.6.6. Business performance
- 10.6.7. Key strategic moves and developments
- 10.7. Califia Farms, LLC
- 10.7.1. Company overview
- 10.7.2. Key executives
- 10.7.3. Company snapshot
- 10.7.4. Operating business segments
- 10.7.5. Product portfolio
- 10.7.6. Business performance
- 10.7.7. Key strategic moves and developments
- 10.8. La Colombe Coffee Roasters
- 10.8.1. Company overview
- 10.8.2. Key executives
- 10.8.3. Company snapshot
- 10.8.4. Operating business segments
- 10.8.5. Product portfolio
- 10.8.6. Business performance
- 10.8.7. Key strategic moves and developments
- 10.9. Suntory Beverage & Food Limited
- 10.9.1. Company overview
- 10.9.2. Key executives
- 10.9.3. Company snapshot
- 10.9.4. Operating business segments
- 10.9.5. Product portfolio
- 10.9.6. Business performance
- 10.9.7. Key strategic moves and developments
- 10.10. Gujarat Co-Operative Milk Marketing Federation
- 10.10.1. Company overview
- 10.10.2. Key executives
- 10.10.3. Company snapshot
- 10.10.4. Operating business segments
- 10.10.5. Product portfolio
- 10.10.6. Business performance
- 10.10.7. Key strategic moves and developments
LIST OF TABLES
- TABLE 01. GLOBAL READY-TO-DRINK (RTD) COFFEE BEVERAGE MARKET, BY PRODUCT TYPE, 2022-2032 ($MILLION)
- TABLE 02. READY-TO-DRINK (RTD) COFFEE BEVERAGE MARKET FOR COLD BREW, BY REGION, 2022-2032 ($MILLION)
- TABLE 03. READY-TO-DRINK (RTD) COFFEE BEVERAGE MARKET FOR OTHERS, BY REGION, 2022-2032 ($MILLION)
- TABLE 04. GLOBAL READY-TO-DRINK (RTD) COFFEE BEVERAGE MARKET, BY CREAM CONTENT, 2022-2032 ($MILLION)
- TABLE 05. READY-TO-DRINK (RTD) COFFEE BEVERAGE MARKET FOR DAIRY-BASED, BY REGION, 2022-2032 ($MILLION)
- TABLE 06. READY-TO-DRINK (RTD) COFFEE BEVERAGE MARKET FOR PLANT-BASED, BY REGION, 2022-2032 ($MILLION)
- TABLE 07. GLOBAL READY-TO-DRINK (RTD) COFFEE BEVERAGE MARKET, BY PACKAGING, 2022-2032 ($MILLION)
- TABLE 08. READY-TO-DRINK (RTD) COFFEE BEVERAGE MARKET FOR BOTTLES, BY REGION, 2022-2032 ($MILLION)
- TABLE 09. READY-TO-DRINK (RTD) COFFEE BEVERAGE MARKET FOR CANS, BY REGION, 2022-2032 ($MILLION)
- TABLE 10. READY-TO-DRINK (RTD) COFFEE BEVERAGE MARKET FOR TETRA PACKS, BY REGION, 2022-2032 ($MILLION)
- TABLE 11. GLOBAL READY-TO-DRINK (RTD) COFFEE BEVERAGE MARKET, BY DISTRIBUTION CHANNEL, 2022-2032 ($MILLION)
- TABLE 12. READY-TO-DRINK (RTD) COFFEE BEVERAGE MARKET FOR SUPERMARKETS-HYPERMARKETS, BY REGION, 2022-2032 ($MILLION)
- TABLE 13. READY-TO-DRINK (RTD) COFFEE BEVERAGE MARKET FOR DEPARTMENTAL STORES, BY REGION, 2022-2032 ($MILLION)
- TABLE 14. READY-TO-DRINK (RTD) COFFEE BEVERAGE MARKET FOR CONVENIENCE STORES, BY REGION, 2022-2032 ($MILLION)
- TABLE 15. READY-TO-DRINK (RTD) COFFEE BEVERAGE MARKET FOR ONLINE SALES CHANNEL, BY REGION, 2022-2032 ($MILLION)
- TABLE 16. READY-TO-DRINK (RTD) COFFEE BEVERAGE MARKET FOR OTHERS, BY REGION, 2022-2032 ($MILLION)
- TABLE 17. READY-TO-DRINK (RTD) COFFEE BEVERAGE MARKET, BY REGION, 2022-2032 ($MILLION)
- TABLE 18. NORTH AMERICA READY-TO-DRINK (RTD) COFFEE BEVERAGE MARKET, BY PRODUCT TYPE, 2022-2032 ($MILLION)
- TABLE 19. NORTH AMERICA READY-TO-DRINK (RTD) COFFEE BEVERAGE MARKET, BY CREAM CONTENT, 2022-2032 ($MILLION)
- TABLE 20. NORTH AMERICA READY-TO-DRINK (RTD) COFFEE BEVERAGE MARKET, BY PACKAGING, 2022-2032 ($MILLION)
- TABLE 21. NORTH AMERICA READY-TO-DRINK (RTD) COFFEE BEVERAGE MARKET, BY DISTRIBUTION CHANNEL, 2022-2032 ($MILLION)
- TABLE 22. NORTH AMERICA READY-TO-DRINK (RTD) COFFEE BEVERAGE MARKET, BY COUNTRY, 2022-2032 ($MILLION)
- TABLE 23. U.S. READY-TO-DRINK (RTD) COFFEE BEVERAGE MARKET, BY PRODUCT TYPE, 2022-2032 ($MILLION)
- TABLE 24. U.S. READY-TO-DRINK (RTD) COFFEE BEVERAGE MARKET, BY CREAM CONTENT, 2022-2032 ($MILLION)
- TABLE 25. U.S. READY-TO-DRINK (RTD) COFFEE BEVERAGE MARKET, BY PACKAGING, 2022-2032 ($MILLION)
- TABLE 26. U.S. READY-TO-DRINK (RTD) COFFEE BEVERAGE MARKET, BY DISTRIBUTION CHANNEL, 2022-2032 ($MILLION)
- TABLE 27. CANADA READY-TO-DRINK (RTD) COFFEE BEVERAGE MARKET, BY PRODUCT TYPE, 2022-2032 ($MILLION)
- TABLE 28. CANADA READY-TO-DRINK (RTD) COFFEE BEVERAGE MARKET, BY CREAM CONTENT, 2022-2032 ($MILLION)
- TABLE 29. CANADA READY-TO-DRINK (RTD) COFFEE BEVERAGE MARKET, BY PACKAGING, 2022-2032 ($MILLION)
- TABLE 30. CANADA READY-TO-DRINK (RTD) COFFEE BEVERAGE MARKET, BY DISTRIBUTION CHANNEL, 2022-2032 ($MILLION)
- TABLE 31. MEXICO READY-TO-DRINK (RTD) COFFEE BEVERAGE MARKET, BY PRODUCT TYPE, 2022-2032 ($MILLION)
- TABLE 32. MEXICO READY-TO-DRINK (RTD) COFFEE BEVERAGE MARKET, BY CREAM CONTENT, 2022-2032 ($MILLION)
- TABLE 33. MEXICO READY-TO-DRINK (RTD) COFFEE BEVERAGE MARKET, BY PACKAGING, 2022-2032 ($MILLION)
- TABLE 34. MEXICO READY-TO-DRINK (RTD) COFFEE BEVERAGE MARKET, BY DISTRIBUTION CHANNEL, 2022-2032 ($MILLION)
- TABLE 35. EUROPE READY-TO-DRINK (RTD) COFFEE BEVERAGE MARKET, BY PRODUCT TYPE, 2022-2032 ($MILLION)
- TABLE 36. EUROPE READY-TO-DRINK (RTD) COFFEE BEVERAGE MARKET, BY CREAM CONTENT, 2022-2032 ($MILLION)
- TABLE 37. EUROPE READY-TO-DRINK (RTD) COFFEE BEVERAGE MARKET, BY PACKAGING, 2022-2032 ($MILLION)
- TABLE 38. EUROPE READY-TO-DRINK (RTD) COFFEE BEVERAGE MARKET, BY DISTRIBUTION CHANNEL, 2022-2032 ($MILLION)
- TABLE 39. EUROPE READY-TO-DRINK (RTD) COFFEE BEVERAGE MARKET, BY COUNTRY, 2022-2032 ($MILLION)
- TABLE 40. GERMANY READY-TO-DRINK (RTD) COFFEE BEVERAGE MARKET, BY PRODUCT TYPE, 2022-2032 ($MILLION)
- TABLE 41. GERMANY READY-TO-DRINK (RTD) COFFEE BEVERAGE MARKET, BY CREAM CONTENT, 2022-2032 ($MILLION)
- TABLE 42. GERMANY READY-TO-DRINK (RTD) COFFEE BEVERAGE MARKET, BY PACKAGING, 2022-2032 ($MILLION)
- TABLE 43. GERMANY READY-TO-DRINK (RTD) COFFEE BEVERAGE MARKET, BY DISTRIBUTION CHANNEL, 2022-2032 ($MILLION)
- TABLE 44. UK READY-TO-DRINK (RTD) COFFEE BEVERAGE MARKET, BY PRODUCT TYPE, 2022-2032 ($MILLION)
- TABLE 45. UK READY-TO-DRINK (RTD) COFFEE BEVERAGE MARKET, BY CREAM CONTENT, 2022-2032 ($MILLION)
- TABLE 46. UK READY-TO-DRINK (RTD) COFFEE BEVERAGE MARKET, BY PACKAGING, 2022-2032 ($MILLION)
- TABLE 47. UK READY-TO-DRINK (RTD) COFFEE BEVERAGE MARKET, BY DISTRIBUTION CHANNEL, 2022-2032 ($MILLION)
- TABLE 48. FRANCE READY-TO-DRINK (RTD) COFFEE BEVERAGE MARKET, BY PRODUCT TYPE, 2022-2032 ($MILLION)
- TABLE 49. FRANCE READY-TO-DRINK (RTD) COFFEE BEVERAGE MARKET, BY CREAM CONTENT, 2022-2032 ($MILLION)
- TABLE 50. FRANCE READY-TO-DRINK (RTD) COFFEE BEVERAGE MARKET, BY PACKAGING, 2022-2032 ($MILLION)
- TABLE 51. FRANCE READY-TO-DRINK (RTD) COFFEE BEVERAGE MARKET, BY DISTRIBUTION CHANNEL, 2022-2032 ($MILLION)
- TABLE 52. ITALY READY-TO-DRINK (RTD) COFFEE BEVERAGE MARKET, BY PRODUCT TYPE, 2022-2032 ($MILLION)
- TABLE 53. ITALY READY-TO-DRINK (RTD) COFFEE BEVERAGE MARKET, BY CREAM CONTENT, 2022-2032 ($MILLION)
- TABLE 54. ITALY READY-TO-DRINK (RTD) COFFEE BEVERAGE MARKET, BY PACKAGING, 2022-2032 ($MILLION)
- TABLE 55. ITALY READY-TO-DRINK (RTD) COFFEE BEVERAGE MARKET, BY DISTRIBUTION CHANNEL, 2022-2032 ($MILLION)
- TABLE 56. SPAIN READY-TO-DRINK (RTD) COFFEE BEVERAGE MARKET, BY PRODUCT TYPE, 2022-2032 ($MILLION)
- TABLE 57. SPAIN READY-TO-DRINK (RTD) COFFEE BEVERAGE MARKET, BY CREAM CONTENT, 2022-2032 ($MILLION)
- TABLE 58. SPAIN READY-TO-DRINK (RTD) COFFEE BEVERAGE MARKET, BY PACKAGING, 2022-2032 ($MILLION)
- TABLE 59. SPAIN READY-TO-DRINK (RTD) COFFEE BEVERAGE MARKET, BY DISTRIBUTION CHANNEL, 2022-2032 ($MILLION)
- TABLE 60. REST OF EUROPE READY-TO-DRINK (RTD) COFFEE BEVERAGE MARKET, BY PRODUCT TYPE, 2022-2032 ($MILLION)
- TABLE 61. REST OF EUROPE READY-TO-DRINK (RTD) COFFEE BEVERAGE MARKET, BY CREAM CONTENT, 2022-2032 ($MILLION)
- TABLE 62. REST OF EUROPE READY-TO-DRINK (RTD) COFFEE BEVERAGE MARKET, BY PACKAGING, 2022-2032 ($MILLION)
- TABLE 63. REST OF EUROPE READY-TO-DRINK (RTD) COFFEE BEVERAGE MARKET, BY DISTRIBUTION CHANNEL, 2022-2032 ($MILLION)
- TABLE 64. ASIA-PACIFIC READY-TO-DRINK (RTD) COFFEE BEVERAGE MARKET, BY PRODUCT TYPE, 2022-2032 ($MILLION)
- TABLE 65. ASIA-PACIFIC READY-TO-DRINK (RTD) COFFEE BEVERAGE MARKET, BY CREAM CONTENT, 2022-2032 ($MILLION)
- TABLE 66. ASIA-PACIFIC READY-TO-DRINK (RTD) COFFEE BEVERAGE MARKET, BY PACKAGING, 2022-2032 ($MILLION)
- TABLE 67. ASIA-PACIFIC READY-TO-DRINK (RTD) COFFEE BEVERAGE MARKET, BY DISTRIBUTION CHANNEL, 2022-2032 ($MILLION)
- TABLE 68. ASIA-PACIFIC READY-TO-DRINK (RTD) COFFEE BEVERAGE MARKET, BY COUNTRY, 2022-2032 ($MILLION)
- TABLE 69. CHINA READY-TO-DRINK (RTD) COFFEE BEVERAGE MARKET, BY PRODUCT TYPE, 2022-2032 ($MILLION)
- TABLE 70. CHINA READY-TO-DRINK (RTD) COFFEE BEVERAGE MARKET, BY CREAM CONTENT, 2022-2032 ($MILLION)
- TABLE 71. CHINA READY-TO-DRINK (RTD) COFFEE BEVERAGE MARKET, BY PACKAGING, 2022-2032 ($MILLION)
- TABLE 72. CHINA READY-TO-DRINK (RTD) COFFEE BEVERAGE MARKET, BY DISTRIBUTION CHANNEL, 2022-2032 ($MILLION)
- TABLE 73. INDIA READY-TO-DRINK (RTD) COFFEE BEVERAGE MARKET, BY PRODUCT TYPE, 2022-2032 ($MILLION)
- TABLE 74. INDIA READY-TO-DRINK (RTD) COFFEE BEVERAGE MARKET, BY CREAM CONTENT, 2022-2032 ($MILLION)
- TABLE 75. INDIA READY-TO-DRINK (RTD) COFFEE BEVERAGE MARKET, BY PACKAGING, 2022-2032 ($MILLION)
- TABLE 76. INDIA READY-TO-DRINK (RTD) COFFEE BEVERAGE MARKET, BY DISTRIBUTION CHANNEL, 2022-2032 ($MILLION)
- TABLE 77. JAPAN READY-TO-DRINK (RTD) COFFEE BEVERAGE MARKET, BY PRODUCT TYPE, 2022-2032 ($MILLION)
- TABLE 78. JAPAN READY-TO-DRINK (RTD) COFFEE BEVERAGE MARKET, BY CREAM CONTENT, 2022-2032 ($MILLION)
- TABLE 79. JAPAN READY-TO-DRINK (RTD) COFFEE BEVERAGE MARKET, BY PACKAGING, 2022-2032 ($MILLION)
- TABLE 80. JAPAN READY-TO-DRINK (RTD) COFFEE BEVERAGE MARKET, BY DISTRIBUTION CHANNEL, 2022-2032 ($MILLION)
- TABLE 81. SOUTH KOREA READY-TO-DRINK (RTD) COFFEE BEVERAGE MARKET, BY PRODUCT TYPE, 2022-2032 ($MILLION)
- TABLE 82. SOUTH KOREA READY-TO-DRINK (RTD) COFFEE BEVERAGE MARKET, BY CREAM CONTENT, 2022-2032 ($MILLION)
- TABLE 83. SOUTH KOREA READY-TO-DRINK (RTD) COFFEE BEVERAGE MARKET, BY PACKAGING, 2022-2032 ($MILLION)
- TABLE 84. SOUTH KOREA READY-TO-DRINK (RTD) COFFEE BEVERAGE MARKET, BY DISTRIBUTION CHANNEL, 2022-2032 ($MILLION)
- TABLE 85. AUSTRALIA READY-TO-DRINK (RTD) COFFEE BEVERAGE MARKET, BY PRODUCT TYPE, 2022-2032 ($MILLION)
- TABLE 86. AUSTRALIA READY-TO-DRINK (RTD) COFFEE BEVERAGE MARKET, BY CREAM CONTENT, 2022-2032 ($MILLION)
- TABLE 87. AUSTRALIA READY-TO-DRINK (RTD) COFFEE BEVERAGE MARKET, BY PACKAGING, 2022-2032 ($MILLION)
- TABLE 88. AUSTRALIA READY-TO-DRINK (RTD) COFFEE BEVERAGE MARKET, BY DISTRIBUTION CHANNEL, 2022-2032 ($MILLION)
- TABLE 89. ASEAN READY-TO-DRINK (RTD) COFFEE BEVERAGE MARKET, BY PRODUCT TYPE, 2022-2032 ($MILLION)
- TABLE 90. ASEAN READY-TO-DRINK (RTD) COFFEE BEVERAGE MARKET, BY CREAM CONTENT, 2022-2032 ($MILLION)
- TABLE 91. ASEAN READY-TO-DRINK (RTD) COFFEE BEVERAGE MARKET, BY PACKAGING, 2022-2032 ($MILLION)
- TABLE 92. ASEAN READY-TO-DRINK (RTD) COFFEE BEVERAGE MARKET, BY DISTRIBUTION CHANNEL, 2022-2032 ($MILLION)
- TABLE 93. REST OF ASIA-PACIFIC READY-TO-DRINK (RTD) COFFEE BEVERAGE MARKET, BY PRODUCT TYPE, 2022-2032 ($MILLION)
- TABLE 94. REST OF ASIA-PACIFIC READY-TO-DRINK (RTD) COFFEE BEVERAGE MARKET, BY CREAM CONTENT, 2022-2032 ($MILLION)
- TABLE 95. REST OF ASIA-PACIFIC READY-TO-DRINK (RTD) COFFEE BEVERAGE MARKET, BY PACKAGING, 2022-2032 ($MILLION)
- TABLE 96. REST OF ASIA-PACIFIC READY-TO-DRINK (RTD) COFFEE BEVERAGE MARKET, BY DISTRIBUTION CHANNEL, 2022-2032 ($MILLION)
- TABLE 97. LATIN AMERICA READY-TO-DRINK (RTD) COFFEE BEVERAGE MARKET, BY PRODUCT TYPE, 2022-2032 ($MILLION)
- TABLE 98. LATIN AMERICA READY-TO-DRINK (RTD) COFFEE BEVERAGE MARKET, BY CREAM CONTENT, 2022-2032 ($MILLION)
- TABLE 99. LATIN AMERICA READY-TO-DRINK (RTD) COFFEE BEVERAGE MARKET, BY PACKAGING, 2022-2032 ($MILLION)
- TABLE 100. LATIN AMERICA READY-TO-DRINK (RTD) COFFEE BEVERAGE MARKET, BY DISTRIBUTION CHANNEL, 2022-2032 ($MILLION)
- TABLE 101. LATIN AMERICA READY-TO-DRINK (RTD) COFFEE BEVERAGE MARKET, BY COUNTRY, 2022-2032 ($MILLION)
- TABLE 102. BRAZIL READY-TO-DRINK (RTD) COFFEE BEVERAGE MARKET, BY PRODUCT TYPE, 2022-2032 ($MILLION)
- TABLE 103. BRAZIL READY-TO-DRINK (RTD) COFFEE BEVERAGE MARKET, BY CREAM CONTENT, 2022-2032 ($MILLION)
- TABLE 104. BRAZIL READY-TO-DRINK (RTD) COFFEE BEVERAGE MARKET, BY PACKAGING, 2022-2032 ($MILLION)
- TABLE 105. BRAZIL READY-TO-DRINK (RTD) COFFEE BEVERAGE MARKET, BY DISTRIBUTION CHANNEL, 2022-2032 ($MILLION)
- TABLE 106. COLOMBIA READY-TO-DRINK (RTD) COFFEE BEVERAGE MARKET, BY PRODUCT TYPE, 2022-2032 ($MILLION)
- TABLE 107. COLOMBIA READY-TO-DRINK (RTD) COFFEE BEVERAGE MARKET, BY CREAM CONTENT, 2022-2032 ($MILLION)
- TABLE 108. COLOMBIA READY-TO-DRINK (RTD) COFFEE BEVERAGE MARKET, BY PACKAGING, 2022-2032 ($MILLION)
- TABLE 109. COLOMBIA READY-TO-DRINK (RTD) COFFEE BEVERAGE MARKET, BY DISTRIBUTION CHANNEL, 2022-2032 ($MILLION)
- TABLE 110. ARGENTINA READY-TO-DRINK (RTD) COFFEE BEVERAGE MARKET, BY PRODUCT TYPE, 2022-2032 ($MILLION)
- TABLE 111. ARGENTINA READY-TO-DRINK (RTD) COFFEE BEVERAGE MARKET, BY CREAM CONTENT, 2022-2032 ($MILLION)
- TABLE 112. ARGENTINA READY-TO-DRINK (RTD) COFFEE BEVERAGE MARKET, BY PACKAGING, 2022-2032 ($MILLION)
- TABLE 113. ARGENTINA READY-TO-DRINK (RTD) COFFEE BEVERAGE MARKET, BY DISTRIBUTION CHANNEL, 2022-2032 ($MILLION)
- TABLE 114. REST OF LATIN AMERICA READY-TO-DRINK (RTD) COFFEE BEVERAGE MARKET, BY PRODUCT TYPE, 2022-2032 ($MILLION)
- TABLE 115. REST OF LATIN AMERICA READY-TO-DRINK (RTD) COFFEE BEVERAGE MARKET, BY CREAM CONTENT, 2022-2032 ($MILLION)
- TABLE 116. REST OF LATIN AMERICA READY-TO-DRINK (RTD) COFFEE BEVERAGE MARKET, BY PACKAGING, 2022-2032 ($MILLION)
- TABLE 117. REST OF LATIN AMERICA READY-TO-DRINK (RTD) COFFEE BEVERAGE MARKET, BY DISTRIBUTION CHANNEL, 2022-2032 ($MILLION)
- TABLE 118. MIDDLE EAST AND AFRICA READY-TO-DRINK (RTD) COFFEE BEVERAGE MARKET, BY PRODUCT TYPE, 2022-2032 ($MILLION)
- TABLE 119. MIDDLE EAST AND AFRICA READY-TO-DRINK (RTD) COFFEE BEVERAGE MARKET, BY CREAM CONTENT, 2022-2032 ($MILLION)
- TABLE 120. MIDDLE EAST AND AFRICA READY-TO-DRINK (RTD) COFFEE BEVERAGE MARKET, BY PACKAGING, 2022-2032 ($MILLION)
- TABLE 121. MIDDLE EAST AND AFRICA READY-TO-DRINK (RTD) COFFEE BEVERAGE MARKET, BY DISTRIBUTION CHANNEL, 2022-2032 ($MILLION)
- TABLE 122. MIDDLE EAST AND AFRICA READY-TO-DRINK (RTD) COFFEE BEVERAGE MARKET, BY COUNTRY, 2022-2032 ($MILLION)
- TABLE 123. GCC READY-TO-DRINK (RTD) COFFEE BEVERAGE MARKET, BY PRODUCT TYPE, 2022-2032 ($MILLION)
- TABLE 124. GCC READY-TO-DRINK (RTD) COFFEE BEVERAGE MARKET, BY CREAM CONTENT, 2022-2032 ($MILLION)
- TABLE 125. GCC READY-TO-DRINK (RTD) COFFEE BEVERAGE MARKET, BY PACKAGING, 2022-2032 ($MILLION)
- TABLE 126. GCC READY-TO-DRINK (RTD) COFFEE BEVERAGE MARKET, BY DISTRIBUTION CHANNEL, 2022-2032 ($MILLION)
- TABLE 127. SOUTH AFRICA READY-TO-DRINK (RTD) COFFEE BEVERAGE MARKET, BY PRODUCT TYPE, 2022-2032 ($MILLION)
- TABLE 128. SOUTH AFRICA READY-TO-DRINK (RTD) COFFEE BEVERAGE MARKET, BY CREAM CONTENT, 2022-2032 ($MILLION)
- TABLE 129. SOUTH AFRICA READY-TO-DRINK (RTD) COFFEE BEVERAGE MARKET, BY PACKAGING, 2022-2032 ($MILLION)
- TABLE 130. SOUTH AFRICA READY-TO-DRINK (RTD) COFFEE BEVERAGE MARKET, BY DISTRIBUTION CHANNEL, 2022-2032 ($MILLION)
- TABLE 131. REST OF MIDDLE EAST AND AFRICA READY-TO-DRINK (RTD) COFFEE BEVERAGE MARKET, BY PRODUCT TYPE, 2022-2032 ($MILLION)
- TABLE 132. REST OF MIDDLE EAST AND AFRICA READY-TO-DRINK (RTD) COFFEE BEVERAGE MARKET, BY CREAM CONTENT, 2022-2032 ($MILLION)
- TABLE 133. REST OF MIDDLE EAST AND AFRICA READY-TO-DRINK (RTD) COFFEE BEVERAGE MARKET, BY PACKAGING, 2022-2032 ($MILLION)
- TABLE 134. REST OF MIDDLE EAST AND AFRICA READY-TO-DRINK (RTD) COFFEE BEVERAGE MARKET, BY DISTRIBUTION CHANNEL, 2022-2032 ($MILLION)
- TABLE 135. NESTLE SA: KEY EXECUTIVES
- TABLE 136. NESTLE SA: COMPANY SNAPSHOT
- TABLE 137. NESTLE SA: PRODUCT SEGMENTS
- TABLE 138. NESTLE SA: SERVICE SEGMENTS
- TABLE 139. NESTLE SA: PRODUCT PORTFOLIO
- TABLE 140. NESTLE SA: KEY STRATERGIES
- TABLE 141. THE COCA-COLA COMPANY: KEY EXECUTIVES
- TABLE 142. THE COCA-COLA COMPANY: COMPANY SNAPSHOT
- TABLE 143. THE COCA-COLA COMPANY: PRODUCT SEGMENTS
- TABLE 144. THE COCA-COLA COMPANY: SERVICE SEGMENTS
- TABLE 145. THE COCA-COLA COMPANY: PRODUCT PORTFOLIO
- TABLE 146. THE COCA-COLA COMPANY: KEY STRATERGIES
- TABLE 147. STARBUCKS CORPORATION: KEY EXECUTIVES
- TABLE 148. STARBUCKS CORPORATION: COMPANY SNAPSHOT
- TABLE 149. STARBUCKS CORPORATION: PRODUCT SEGMENTS
- TABLE 150. STARBUCKS CORPORATION: SERVICE SEGMENTS
- TABLE 151. STARBUCKS CORPORATION: PRODUCT PORTFOLIO
- TABLE 152. STARBUCKS CORPORATION: KEY STRATERGIES
- TABLE 153. ILLYCAFFE S.P.A.: KEY EXECUTIVES
- TABLE 154. ILLYCAFFE S.P.A.: COMPANY SNAPSHOT
- TABLE 155. ILLYCAFFE S.P.A.: PRODUCT SEGMENTS
- TABLE 156. ILLYCAFFE S.P.A.: SERVICE SEGMENTS
- TABLE 157. ILLYCAFFE S.P.A.: PRODUCT PORTFOLIO
- TABLE 158. ILLYCAFFE S.P.A.: KEY STRATERGIES
- TABLE 159. DANONE SA: KEY EXECUTIVES
- TABLE 160. DANONE SA: COMPANY SNAPSHOT
- TABLE 161. DANONE SA: PRODUCT SEGMENTS
- TABLE 162. DANONE SA: SERVICE SEGMENTS
- TABLE 163. DANONE SA: PRODUCT PORTFOLIO
- TABLE 164. DANONE SA: KEY STRATERGIES
- TABLE 165. LOTTE CHILSUNG BEVERAGE CO.: KEY EXECUTIVES
- TABLE 166. LOTTE CHILSUNG BEVERAGE CO.: COMPANY SNAPSHOT
- TABLE 167. LOTTE CHILSUNG BEVERAGE CO.: PRODUCT SEGMENTS
- TABLE 168. LOTTE CHILSUNG BEVERAGE CO.: SERVICE SEGMENTS
- TABLE 169. LOTTE CHILSUNG BEVERAGE CO.: PRODUCT PORTFOLIO
- TABLE 170. LOTTE CHILSUNG BEVERAGE CO.: KEY STRATERGIES
- TABLE 171. CALIFIA FARMS, LLC: KEY EXECUTIVES
- TABLE 172. CALIFIA FARMS, LLC: COMPANY SNAPSHOT
- TABLE 173. CALIFIA FARMS, LLC: PRODUCT SEGMENTS
- TABLE 174. CALIFIA FARMS, LLC: SERVICE SEGMENTS
- TABLE 175. CALIFIA FARMS, LLC: PRODUCT PORTFOLIO
- TABLE 176. CALIFIA FARMS, LLC: KEY STRATERGIES
- TABLE 177. LA COLOMBE COFFEE ROASTERS: KEY EXECUTIVES
- TABLE 178. LA COLOMBE COFFEE ROASTERS: COMPANY SNAPSHOT
- TABLE 179. LA COLOMBE COFFEE ROASTERS: PRODUCT SEGMENTS
- TABLE 180. LA COLOMBE COFFEE ROASTERS: SERVICE SEGMENTS
- TABLE 181. LA COLOMBE COFFEE ROASTERS: PRODUCT PORTFOLIO
- TABLE 182. LA COLOMBE COFFEE ROASTERS: KEY STRATERGIES
- TABLE 183. SUNTORY BEVERAGE & FOOD LIMITED: KEY EXECUTIVES
- TABLE 184. SUNTORY BEVERAGE & FOOD LIMITED: COMPANY SNAPSHOT
- TABLE 185. SUNTORY BEVERAGE & FOOD LIMITED: PRODUCT SEGMENTS
- TABLE 186. SUNTORY BEVERAGE & FOOD LIMITED: SERVICE SEGMENTS
- TABLE 187. SUNTORY BEVERAGE & FOOD LIMITED: PRODUCT PORTFOLIO
- TABLE 188. SUNTORY BEVERAGE & FOOD LIMITED: KEY STRATERGIES
- TABLE 189. GUJARAT CO-OPERATIVE MILK MARKETING FEDERATION: KEY EXECUTIVES
- TABLE 190. GUJARAT CO-OPERATIVE MILK MARKETING FEDERATION: COMPANY SNAPSHOT
- TABLE 191. GUJARAT CO-OPERATIVE MILK MARKETING FEDERATION: PRODUCT SEGMENTS
- TABLE 192. GUJARAT CO-OPERATIVE MILK MARKETING FEDERATION: SERVICE SEGMENTS
- TABLE 193. GUJARAT CO-OPERATIVE MILK MARKETING FEDERATION: PRODUCT PORTFOLIO
- TABLE 194. GUJARAT CO-OPERATIVE MILK MARKETING FEDERATION: KEY STRATERGIES
LIST OF FIGURES
- FIGURE 01. READY-TO-DRINK (RTD) COFFEE BEVERAGE MARKET, 2022-2032
- FIGURE 02. SEGMENTATION OF READY-TO-DRINK (RTD) COFFEE BEVERAGE MARKET,2022-2032
- FIGURE 03. TOP IMPACTING FACTORS IN READY-TO-DRINK (RTD) COFFEE BEVERAGE MARKET
- FIGURE 04. TOP INVESTMENT POCKETS IN READY-TO-DRINK (RTD) COFFEE BEVERAGE MARKET (2023-2032)
- FIGURE 05. BARGAINING POWER OF SUPPLIERS
- FIGURE 06. BARGAINING POWER OF BUYERS
- FIGURE 07. THREAT OF SUBSTITUTION
- FIGURE 08. THREAT OF SUBSTITUTION
- FIGURE 09. COMPETITIVE RIVALRY
- FIGURE 10. GLOBAL READY-TO-DRINK (RTD) COFFEE BEVERAGE MARKET:DRIVERS, RESTRAINTS AND OPPORTUNITIES
- FIGURE 11. READY-TO-DRINK (RTD) COFFEE BEVERAGE MARKET, BY PRODUCT TYPE, 2022 AND 2032(%)
- FIGURE 12. COMPARATIVE SHARE ANALYSIS OF READY-TO-DRINK (RTD) COFFEE BEVERAGE MARKET FOR COLD BREW, BY COUNTRY 2022 AND 2032(%)
- FIGURE 13. COMPARATIVE SHARE ANALYSIS OF READY-TO-DRINK (RTD) COFFEE BEVERAGE MARKET FOR OTHERS, BY COUNTRY 2022 AND 2032(%)
- FIGURE 14. READY-TO-DRINK (RTD) COFFEE BEVERAGE MARKET, BY CREAM CONTENT, 2022 AND 2032(%)
- FIGURE 15. COMPARATIVE SHARE ANALYSIS OF READY-TO-DRINK (RTD) COFFEE BEVERAGE MARKET FOR DAIRY-BASED, BY COUNTRY 2022 AND 2032(%)
- FIGURE 16. COMPARATIVE SHARE ANALYSIS OF READY-TO-DRINK (RTD) COFFEE BEVERAGE MARKET FOR PLANT-BASED, BY COUNTRY 2022 AND 2032(%)
- FIGURE 17. READY-TO-DRINK (RTD) COFFEE BEVERAGE MARKET, BY PACKAGING, 2022 AND 2032(%)
- FIGURE 18. COMPARATIVE SHARE ANALYSIS OF READY-TO-DRINK (RTD) COFFEE BEVERAGE MARKET FOR BOTTLES, BY COUNTRY 2022 AND 2032(%)
- FIGURE 19. COMPARATIVE SHARE ANALYSIS OF READY-TO-DRINK (RTD) COFFEE BEVERAGE MARKET FOR CANS, BY COUNTRY 2022 AND 2032(%)
- FIGURE 20. COMPARATIVE SHARE ANALYSIS OF READY-TO-DRINK (RTD) COFFEE BEVERAGE MARKET FOR TETRA PACKS, BY COUNTRY 2022 AND 2032(%)
- FIGURE 21. READY-TO-DRINK (RTD) COFFEE BEVERAGE MARKET, BY DISTRIBUTION CHANNEL, 2022 AND 2032(%)
- FIGURE 22. COMPARATIVE SHARE ANALYSIS OF READY-TO-DRINK (RTD) COFFEE BEVERAGE MARKET FOR SUPERMARKETS-HYPERMARKETS, BY COUNTRY 2022 AND 2032(%)
- FIGURE 23. COMPARATIVE SHARE ANALYSIS OF READY-TO-DRINK (RTD) COFFEE BEVERAGE MARKET FOR DEPARTMENTAL STORES, BY COUNTRY 2022 AND 2032(%)
- FIGURE 24. COMPARATIVE SHARE ANALYSIS OF READY-TO-DRINK (RTD) COFFEE BEVERAGE MARKET FOR CONVENIENCE STORES, BY COUNTRY 2022 AND 2032(%)
- FIGURE 25. COMPARATIVE SHARE ANALYSIS OF READY-TO-DRINK (RTD) COFFEE BEVERAGE MARKET FOR ONLINE SALES CHANNEL, BY COUNTRY 2022 AND 2032(%)
- FIGURE 26. COMPARATIVE SHARE ANALYSIS OF READY-TO-DRINK (RTD) COFFEE BEVERAGE MARKET FOR OTHERS, BY COUNTRY 2022 AND 2032(%)
- FIGURE 27. READY-TO-DRINK (RTD) COFFEE BEVERAGE MARKET BY REGION, 2022 AND 2032(%)
- FIGURE 28. U.S. READY-TO-DRINK (RTD) COFFEE BEVERAGE MARKET, 2022-2032 ($MILLION)
- FIGURE 29. CANADA READY-TO-DRINK (RTD) COFFEE BEVERAGE MARKET, 2022-2032 ($MILLION)
- FIGURE 30. MEXICO READY-TO-DRINK (RTD) COFFEE BEVERAGE MARKET, 2022-2032 ($MILLION)
- FIGURE 31. GERMANY READY-TO-DRINK (RTD) COFFEE BEVERAGE MARKET, 2022-2032 ($MILLION)
- FIGURE 32. UK READY-TO-DRINK (RTD) COFFEE BEVERAGE MARKET, 2022-2032 ($MILLION)
- FIGURE 33. FRANCE READY-TO-DRINK (RTD) COFFEE BEVERAGE MARKET, 2022-2032 ($MILLION)
- FIGURE 34. ITALY READY-TO-DRINK (RTD) COFFEE BEVERAGE MARKET, 2022-2032 ($MILLION)
- FIGURE 35. SPAIN READY-TO-DRINK (RTD) COFFEE BEVERAGE MARKET, 2022-2032 ($MILLION)
- FIGURE 36. REST OF EUROPE READY-TO-DRINK (RTD) COFFEE BEVERAGE MARKET, 2022-2032 ($MILLION)
- FIGURE 37. CHINA READY-TO-DRINK (RTD) COFFEE BEVERAGE MARKET, 2022-2032 ($MILLION)
- FIGURE 38. INDIA READY-TO-DRINK (RTD) COFFEE BEVERAGE MARKET, 2022-2032 ($MILLION)
- FIGURE 39. JAPAN READY-TO-DRINK (RTD) COFFEE BEVERAGE MARKET, 2022-2032 ($MILLION)
- FIGURE 40. SOUTH KOREA READY-TO-DRINK (RTD) COFFEE BEVERAGE MARKET, 2022-2032 ($MILLION)
- FIGURE 41. AUSTRALIA READY-TO-DRINK (RTD) COFFEE BEVERAGE MARKET, 2022-2032 ($MILLION)
- FIGURE 42. ASEAN READY-TO-DRINK (RTD) COFFEE BEVERAGE MARKET, 2022-2032 ($MILLION)
- FIGURE 43. REST OF ASIA-PACIFIC READY-TO-DRINK (RTD) COFFEE BEVERAGE MARKET, 2022-2032 ($MILLION)
- FIGURE 44. BRAZIL READY-TO-DRINK (RTD) COFFEE BEVERAGE MARKET, 2022-2032 ($MILLION)
- FIGURE 45. COLOMBIA READY-TO-DRINK (RTD) COFFEE BEVERAGE MARKET, 2022-2032 ($MILLION)
- FIGURE 46. ARGENTINA READY-TO-DRINK (RTD) COFFEE BEVERAGE MARKET, 2022-2032 ($MILLION)
- FIGURE 47. REST OF LATIN AMERICA READY-TO-DRINK (RTD) COFFEE BEVERAGE MARKET, 2022-2032 ($MILLION)
- FIGURE 48. GCC READY-TO-DRINK (RTD) COFFEE BEVERAGE MARKET, 2022-2032 ($MILLION)
- FIGURE 49. SOUTH AFRICA READY-TO-DRINK (RTD) COFFEE BEVERAGE MARKET, 2022-2032 ($MILLION)
- FIGURE 50. REST OF MIDDLE EAST AND AFRICA READY-TO-DRINK (RTD) COFFEE BEVERAGE MARKET, 2022-2032 ($MILLION)
- FIGURE 51. TOP WINNING STRATEGIES, BY YEAR
- FIGURE 52. TOP WINNING STRATEGIES, BY DEVELOPMENT
- FIGURE 53. TOP WINNING STRATEGIES, BY COMPANY
- FIGURE 54. PRODUCT MAPPING OF TOP 10 PLAYERS
- FIGURE 55. COMPETITIVE DASHBOARD
- FIGURE 56. COMPETITIVE HEATMAP: READY-TO-DRINK (RTD) COFFEE BEVERAGE MARKET
- FIGURE 57. TOP PLAYER POSITIONING, 2022

