
PUBLISHER: Allied Market Research | PRODUCT CODE: 1472285

PUBLISHER: Allied Market Research | PRODUCT CODE: 1472285
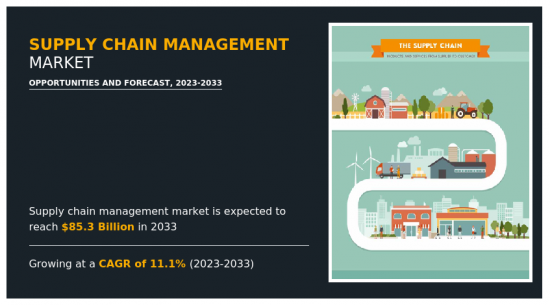
Supply Chain Management Market By Component, By Solution Type, By Deployment Mode, By Enterprise Size, By Industry Vertical : Global Opportunity Analysis and Industry Forecast, 2023-2033
Supply chain management focuses on the development and delivery of goods with higher efficiency and greater speed. Industry players have developed digital SCM systems to improve efficiency in material handling and delivery. The use of supply chain software enables suppliers, manufacturers, logistics providers, and retailers to efficiently manage product creation, order fulfillment, and information tracking. Rise in technological advancements & investments and surge in demand & usage of supply chain management services & software by various enterprises and industries boost the growth of the global supply chain management market. In addition, the increase in adoption of SCM software in healthcare and pharmaceutical companies positively impacts growth of the supply chain management market. However, lack of awareness about supply chain management software and increase in security and privacy concerns among businesses hamper the supply chain management market growth. On the contrary, an upsurge in advanced information and communications technology is expected to offer remunerative opportunities for expansion of the supply chain management market during the forecast period.
Furthermore, rise in technological advancements & investments and surge in demand & usage of supply chain management services & software by various enterprises and industries boost the growth of the global supply chain management market. In addition, the rise in adoption of SCM software in healthcare and pharmaceutical companies positively impacts growth of the supply chain management market. However, lack of awareness about supply chain management software and increase in security and privacy concerns among businesses hamper the supply chain management market growth. On the contrary, an upsurge in advanced information and communications technology is expected to offer remunerative opportunities for expansion of the supply chain management market during the forecast period.
The supply chain management market is segmented on the basis of by component, solution type, deployment model, enterprise size, industry vertical, and region. By component, the market is bifurcated into solution and services. By solution type, it is classified into transportation management system, warehouse management system, supply chain planning, sourcing & procurement software, and manufacturing execution system. By deployment model, the market is divided into on-premise and cloud based. By enterprise size, it is bifurcated into small & medium-sized enterprises (Small and medium-sized enterprise (SMEs)) and large enterprises. Depending on industry vertical, it is fragmented into retail & consumer goods, healthcare & pharmaceuticals, manufacturing, food & beverages, transportation & logistics, automotive, and other. By region, the market is analyzed across North America, Europe, Asia-Pacific, and LAMEA.
The key players that operate in the supply chain management market are IBM Corporation, Blue Yonder Group, Inc., Kinaxis, Manhattan Associates, Inc., Oracle Corporation, SAP SE, Epicor Software Corporation, HighJump, Infor, THE DESCARTES SYSTEMS GROUP INC. These players have adopted various strategies such as collaboration, partnership, and product development to increase their market penetration and strengthen their position in the industry.
Key Benefits For Stakeholders
- This report provides a quantitative analysis of the market segments, current trends, estimations, and dynamics of the supply chain management market analysis from 2022 to 2033 to identify the prevailing supply chain management market opportunities.
- The market research is offered along with information related to key drivers, restraints, and opportunities.
- Porter's five forces analysis highlights the potency of buyers and suppliers to enable stakeholders make profit-oriented business decisions and strengthen their supplier-buyer network.
- In-depth analysis of the supply chain management market segmentation assists to determine the prevailing market opportunities.
- Major countries in each region are mapped according to their revenue contribution to the global market.
- Market player positioning facilitates benchmarking and provides a clear understanding of the present position of the market players.
- The report includes the analysis of the regional as well as global supply chain management market trends, key players, market segments, application areas, and market growth strategies.
Additional benefits you will get with this purchase are:
- Quarterly Update and* (only available with a corporate license, on listed price)
- 5 additional Company Profile of client Choice pre- or Post-purchase, as a free update.
- Free Upcoming Version on the Purchase of Five and Enterprise User License.
- 16 analyst hours of support* (post-purchase, if you find additional data requirements upon review of the report, you may receive support amounting to 16 analyst hours to solve questions, and post-sale queries)
- 15% Free Customization* (in case the scope or segment of the report does not match your requirements, 15% is equivalent to 3 working days of free work, applicable once)
- Free data Pack on the Five and Enterprise User License. (Excel version of the report)
- Free Updated report if the report is 6-12 months old or older.
- 24-hour priority response*
- Free Industry updates and white papers.
Possible Customization with this report (with additional cost and timeline, please talk to the sales executive to know more)
- Investment Opportunities
- New Product Development/ Product Matrix of Key Players
- Additional company profiles with specific to client's interest
- Historic market data
- Key player details (including location, contact details, supplier/vendor network etc. in excel format)
- SWOT Analysis
Key Market Segments
By Industry Vertical
- Retail and consumer goods
- Healthcare and pharmaceuticals
- Manufacturing
- Food and beverages
- Transportation and logistics
- Automotive
- Others
By Component
- Solution
- Service
By Solution Type
- Procurement and sourcing
- Manufacturing execution system
- Transportation management system
- Warehouse management system
- Supply chain planning
By Deployment Mode
- On-premise
- On-Demand/Cloud-Based
By Enterprise Size
- Large Enterprise
- SMEs
By Region
- North America
- U.S.
- Canada
- Europe
- UK
- Germany
- France
- Spain
- Italy
- Rest of Europe
- Asia-Pacific
- China
- Japan
- South Korea
- India
- Australia
- Rest of Asia-Pacific
- LAMEA
- Latin America
- Middle East
- Africa
Key Market Players:
- SAP SE
- korber ag
- THE DESCARTES SYSTEMS GROUP INC
- IBM Corporation
- Kinaxis
- Blue Yonder Group, Inc.
- EPICOR SOFTWARE CORPORATION
- Manhattan Associates, Inc.
- Infor
- Oracle Corporation
TABLE OF CONTENTS
CHAPTER 1: INTRODUCTION
- 1.1. Report description
- 1.2. Key market segments
- 1.3. Key benefits to the stakeholders
- 1.4. Research methodology
- 1.4.1. Primary research
- 1.4.2. Secondary research
- 1.4.3. Analyst tools and models
CHAPTER 2: EXECUTIVE SUMMARY
- 2.1. CXO perspective
CHAPTER 3: MARKET OVERVIEW
- 3.1. Market definition and scope
- 3.2. Key findings
- 3.2.1. Top impacting factors
- 3.2.2. Top investment pockets
- 3.3. Porter's five forces analysis
- 3.3.1. High bargaining power of suppliers
- 3.3.2. Moderate threat of new entrants
- 3.3.3. Moderate threat of substitutes
- 3.3.4. Moderate to high intensity of rivalry
- 3.3.5. Moderate bargaining power of buyers
- 3.4. Market dynamics
- 3.4.1. Drivers
- 3.4.1.1. Rise in technological advancement and investments
- 3.4.1.2. Surge in demand and usage of supply chain management services and software by various enterprises and industries
- 3.4.1.3. Increase in adoption of SCM software in healthcare and pharmaceutical companies
- 3.4.2. Restraints
- 3.4.2.1. Lack of awareness about supply chain management software
- 3.4.2.2. Upsurge in security and privacy concerns among businesses
- 3.4.3. Opportunities
- 3.4.3.1. Increase in advanced information and communications technology
- 3.4.3.2. Increase in growth of e-commerce sector
- 3.4.1. Drivers
CHAPTER 4: SUPPLY CHAIN MANAGEMENT MARKET, BY COMPONENT
- 4.1. Overview
- 4.1.1. Market size and forecast
- 4.2. Solution
- 4.2.1. Key market trends, growth factors and opportunities
- 4.2.2. Market size and forecast, by region
- 4.2.3. Market share analysis by country
- 4.3. Service
- 4.3.1. Key market trends, growth factors and opportunities
- 4.3.2. Market size and forecast, by region
- 4.3.3. Market share analysis by country
CHAPTER 5: SUPPLY CHAIN MANAGEMENT MARKET, BY SOLUTION TYPE
- 5.1. Overview
- 5.1.1. Market size and forecast
- 5.2. Transportation management system
- 5.2.1. Key market trends, growth factors and opportunities
- 5.2.2. Market size and forecast, by region
- 5.2.3. Market share analysis by country
- 5.3. Warehouse management system
- 5.3.1. Key market trends, growth factors and opportunities
- 5.3.2. Market size and forecast, by region
- 5.3.3. Market share analysis by country
- 5.4. Supply chain planning
- 5.4.1. Key market trends, growth factors and opportunities
- 5.4.2. Market size and forecast, by region
- 5.4.3. Market share analysis by country
- 5.5. Procurement and sourcing
- 5.5.1. Key market trends, growth factors and opportunities
- 5.5.2. Market size and forecast, by region
- 5.5.3. Market share analysis by country
- 5.6. Manufacturing execution system
- 5.6.1. Key market trends, growth factors and opportunities
- 5.6.2. Market size and forecast, by region
- 5.6.3. Market share analysis by country
CHAPTER 6: SUPPLY CHAIN MANAGEMENT MARKET, BY DEPLOYMENT MODE
- 6.1. Overview
- 6.1.1. Market size and forecast
- 6.2. On-premise
- 6.2.1. Key market trends, growth factors and opportunities
- 6.2.2. Market size and forecast, by region
- 6.2.3. Market share analysis by country
- 6.3. On-Demand/Cloud-Based
- 6.3.1. Key market trends, growth factors and opportunities
- 6.3.2. Market size and forecast, by region
- 6.3.3. Market share analysis by country
CHAPTER 7: SUPPLY CHAIN MANAGEMENT MARKET, BY ENTERPRISE SIZE
- 7.1. Overview
- 7.1.1. Market size and forecast
- 7.2. Large Enterprise
- 7.2.1. Key market trends, growth factors and opportunities
- 7.2.2. Market size and forecast, by region
- 7.2.3. Market share analysis by country
- 7.3. SMEs
- 7.3.1. Key market trends, growth factors and opportunities
- 7.3.2. Market size and forecast, by region
- 7.3.3. Market share analysis by country
CHAPTER 8: SUPPLY CHAIN MANAGEMENT MARKET, BY INDUSTRY VERTICAL
- 8.1. Overview
- 8.1.1. Market size and forecast
- 8.2. Retail and consumer goods
- 8.2.1. Key market trends, growth factors and opportunities
- 8.2.2. Market size and forecast, by region
- 8.2.3. Market share analysis by country
- 8.3. Healthcare and pharmaceuticals
- 8.3.1. Key market trends, growth factors and opportunities
- 8.3.2. Market size and forecast, by region
- 8.3.3. Market share analysis by country
- 8.4. Manufacturing
- 8.4.1. Key market trends, growth factors and opportunities
- 8.4.2. Market size and forecast, by region
- 8.4.3. Market share analysis by country
- 8.5. Food and beverages
- 8.5.1. Key market trends, growth factors and opportunities
- 8.5.2. Market size and forecast, by region
- 8.5.3. Market share analysis by country
- 8.6. Transportation and logistics
- 8.6.1. Key market trends, growth factors and opportunities
- 8.6.2. Market size and forecast, by region
- 8.6.3. Market share analysis by country
- 8.7. Automotive
- 8.7.1. Key market trends, growth factors and opportunities
- 8.7.2. Market size and forecast, by region
- 8.7.3. Market share analysis by country
- 8.8. Others
- 8.8.1. Key market trends, growth factors and opportunities
- 8.8.2. Market size and forecast, by region
- 8.8.3. Market share analysis by country
CHAPTER 9: SUPPLY CHAIN MANAGEMENT MARKET, BY REGION
- 9.1. Overview
- 9.1.1. Market size and forecast By Region
- 9.2. North America
- 9.2.1. Key market trends, growth factors and opportunities
- 9.2.2. Market size and forecast, by Component
- 9.2.3. Market size and forecast, by Solution Type
- 9.2.4. Market size and forecast, by Deployment Mode
- 9.2.5. Market size and forecast, by Enterprise Size
- 9.2.6. Market size and forecast, by Industry Vertical
- 9.2.7. Market size and forecast, by country
- 9.2.7.1. U.S.
- 9.2.7.1.1. Market size and forecast, by Component
- 9.2.7.1.2. Market size and forecast, by Solution Type
- 9.2.7.1.3. Market size and forecast, by Deployment Mode
- 9.2.7.1.4. Market size and forecast, by Enterprise Size
- 9.2.7.1.5. Market size and forecast, by Industry Vertical
- 9.2.7.2. Canada
- 9.2.7.2.1. Market size and forecast, by Component
- 9.2.7.2.2. Market size and forecast, by Solution Type
- 9.2.7.2.3. Market size and forecast, by Deployment Mode
- 9.2.7.2.4. Market size and forecast, by Enterprise Size
- 9.2.7.2.5. Market size and forecast, by Industry Vertical
- 9.3. Europe
- 9.3.1. Key market trends, growth factors and opportunities
- 9.3.2. Market size and forecast, by Component
- 9.3.3. Market size and forecast, by Solution Type
- 9.3.4. Market size and forecast, by Deployment Mode
- 9.3.5. Market size and forecast, by Enterprise Size
- 9.3.6. Market size and forecast, by Industry Vertical
- 9.3.7. Market size and forecast, by country
- 9.3.7.1. UK
- 9.3.7.1.1. Market size and forecast, by Component
- 9.3.7.1.2. Market size and forecast, by Solution Type
- 9.3.7.1.3. Market size and forecast, by Deployment Mode
- 9.3.7.1.4. Market size and forecast, by Enterprise Size
- 9.3.7.1.5. Market size and forecast, by Industry Vertical
- 9.3.7.2. Germany
- 9.3.7.2.1. Market size and forecast, by Component
- 9.3.7.2.2. Market size and forecast, by Solution Type
- 9.3.7.2.3. Market size and forecast, by Deployment Mode
- 9.3.7.2.4. Market size and forecast, by Enterprise Size
- 9.3.7.2.5. Market size and forecast, by Industry Vertical
- 9.3.7.3. France
- 9.3.7.3.1. Market size and forecast, by Component
- 9.3.7.3.2. Market size and forecast, by Solution Type
- 9.3.7.3.3. Market size and forecast, by Deployment Mode
- 9.3.7.3.4. Market size and forecast, by Enterprise Size
- 9.3.7.3.5. Market size and forecast, by Industry Vertical
- 9.3.7.4. Spain
- 9.3.7.4.1. Market size and forecast, by Component
- 9.3.7.4.2. Market size and forecast, by Solution Type
- 9.3.7.4.3. Market size and forecast, by Deployment Mode
- 9.3.7.4.4. Market size and forecast, by Enterprise Size
- 9.3.7.4.5. Market size and forecast, by Industry Vertical
- 9.3.7.5. Italy
- 9.3.7.5.1. Market size and forecast, by Component
- 9.3.7.5.2. Market size and forecast, by Solution Type
- 9.3.7.5.3. Market size and forecast, by Deployment Mode
- 9.3.7.5.4. Market size and forecast, by Enterprise Size
- 9.3.7.5.5. Market size and forecast, by Industry Vertical
- 9.3.7.6. Rest of Europe
- 9.3.7.6.1. Market size and forecast, by Component
- 9.3.7.6.2. Market size and forecast, by Solution Type
- 9.3.7.6.3. Market size and forecast, by Deployment Mode
- 9.3.7.6.4. Market size and forecast, by Enterprise Size
- 9.3.7.6.5. Market size and forecast, by Industry Vertical
- 9.4. Asia-Pacific
- 9.4.1. Key market trends, growth factors and opportunities
- 9.4.2. Market size and forecast, by Component
- 9.4.3. Market size and forecast, by Solution Type
- 9.4.4. Market size and forecast, by Deployment Mode
- 9.4.5. Market size and forecast, by Enterprise Size
- 9.4.6. Market size and forecast, by Industry Vertical
- 9.4.7. Market size and forecast, by country
- 9.4.7.1. China
- 9.4.7.1.1. Market size and forecast, by Component
- 9.4.7.1.2. Market size and forecast, by Solution Type
- 9.4.7.1.3. Market size and forecast, by Deployment Mode
- 9.4.7.1.4. Market size and forecast, by Enterprise Size
- 9.4.7.1.5. Market size and forecast, by Industry Vertical
- 9.4.7.2. Japan
- 9.4.7.2.1. Market size and forecast, by Component
- 9.4.7.2.2. Market size and forecast, by Solution Type
- 9.4.7.2.3. Market size and forecast, by Deployment Mode
- 9.4.7.2.4. Market size and forecast, by Enterprise Size
- 9.4.7.2.5. Market size and forecast, by Industry Vertical
- 9.4.7.3. South Korea
- 9.4.7.3.1. Market size and forecast, by Component
- 9.4.7.3.2. Market size and forecast, by Solution Type
- 9.4.7.3.3. Market size and forecast, by Deployment Mode
- 9.4.7.3.4. Market size and forecast, by Enterprise Size
- 9.4.7.3.5. Market size and forecast, by Industry Vertical
- 9.4.7.4. India
- 9.4.7.4.1. Market size and forecast, by Component
- 9.4.7.4.2. Market size and forecast, by Solution Type
- 9.4.7.4.3. Market size and forecast, by Deployment Mode
- 9.4.7.4.4. Market size and forecast, by Enterprise Size
- 9.4.7.4.5. Market size and forecast, by Industry Vertical
- 9.4.7.5. Australia
- 9.4.7.5.1. Market size and forecast, by Component
- 9.4.7.5.2. Market size and forecast, by Solution Type
- 9.4.7.5.3. Market size and forecast, by Deployment Mode
- 9.4.7.5.4. Market size and forecast, by Enterprise Size
- 9.4.7.5.5. Market size and forecast, by Industry Vertical
- 9.4.7.6. Rest of Asia-Pacific
- 9.4.7.6.1. Market size and forecast, by Component
- 9.4.7.6.2. Market size and forecast, by Solution Type
- 9.4.7.6.3. Market size and forecast, by Deployment Mode
- 9.4.7.6.4. Market size and forecast, by Enterprise Size
- 9.4.7.6.5. Market size and forecast, by Industry Vertical
- 9.5. LAMEA
- 9.5.1. Key market trends, growth factors and opportunities
- 9.5.2. Market size and forecast, by Component
- 9.5.3. Market size and forecast, by Solution Type
- 9.5.4. Market size and forecast, by Deployment Mode
- 9.5.5. Market size and forecast, by Enterprise Size
- 9.5.6. Market size and forecast, by Industry Vertical
- 9.5.7. Market size and forecast, by country
- 9.5.7.1. Latin America
- 9.5.7.1.1. Market size and forecast, by Component
- 9.5.7.1.2. Market size and forecast, by Solution Type
- 9.5.7.1.3. Market size and forecast, by Deployment Mode
- 9.5.7.1.4. Market size and forecast, by Enterprise Size
- 9.5.7.1.5. Market size and forecast, by Industry Vertical
- 9.5.7.2. Middle East
- 9.5.7.2.1. Market size and forecast, by Component
- 9.5.7.2.2. Market size and forecast, by Solution Type
- 9.5.7.2.3. Market size and forecast, by Deployment Mode
- 9.5.7.2.4. Market size and forecast, by Enterprise Size
- 9.5.7.2.5. Market size and forecast, by Industry Vertical
- 9.5.7.3. Africa
- 9.5.7.3.1. Market size and forecast, by Component
- 9.5.7.3.2. Market size and forecast, by Solution Type
- 9.5.7.3.3. Market size and forecast, by Deployment Mode
- 9.5.7.3.4. Market size and forecast, by Enterprise Size
- 9.5.7.3.5. Market size and forecast, by Industry Vertical
CHAPTER 10: COMPETITIVE LANDSCAPE
- 10.1. Introduction
- 10.2. Top winning strategies
- 10.3. Product mapping of top 10 player
- 10.4. Competitive dashboard
- 10.5. Competitive heatmap
- 10.6. Top player positioning, 2022
CHAPTER 11: COMPANY PROFILES
- 11.1. THE DESCARTES SYSTEMS GROUP INC
- 11.1.1. Company overview
- 11.1.2. Key executives
- 11.1.3. Company snapshot
- 11.1.4. Operating business segments
- 11.1.5. Product portfolio
- 11.1.6. Business performance
- 11.1.7. Key strategic moves and developments
- 11.2. IBM Corporation
- 11.2.1. Company overview
- 11.2.2. Key executives
- 11.2.3. Company snapshot
- 11.2.4. Operating business segments
- 11.2.5. Product portfolio
- 11.2.6. Business performance
- 11.2.7. Key strategic moves and developments
- 11.3. SAP SE
- 11.3.1. Company overview
- 11.3.2. Key executives
- 11.3.3. Company snapshot
- 11.3.4. Operating business segments
- 11.3.5. Product portfolio
- 11.3.6. Business performance
- 11.3.7. Key strategic moves and developments
- 11.4. Kinaxis
- 11.4.1. Company overview
- 11.4.2. Key executives
- 11.4.3. Company snapshot
- 11.4.4. Operating business segments
- 11.4.5. Product portfolio
- 11.4.6. Business performance
- 11.4.7. Key strategic moves and developments
- 11.5. Blue Yonder Group, Inc.
- 11.5.1. Company overview
- 11.5.2. Key executives
- 11.5.3. Company snapshot
- 11.5.4. Operating business segments
- 11.5.5. Product portfolio
- 11.6. EPICOR SOFTWARE CORPORATION
- 11.6.1. Company overview
- 11.6.2. Key executives
- 11.6.3. Company snapshot
- 11.6.4. Operating business segments
- 11.6.5. Product portfolio
- 11.6.6. Key strategic moves and developments
- 11.7. Manhattan Associates, Inc.
- 11.7.1. Company overview
- 11.7.2. Key executives
- 11.7.3. Company snapshot
- 11.7.4. Operating business segments
- 11.7.5. Product portfolio
- 11.7.6. Business performance
- 11.8. Infor
- 11.8.1. Company overview
- 11.8.2. Key executives
- 11.8.3. Company snapshot
- 11.8.4. Operating business segments
- 11.8.5. Product portfolio
- 11.9. Oracle Corporation
- 11.9.1. Company overview
- 11.9.2. Key executives
- 11.9.3. Company snapshot
- 11.9.4. Operating business segments
- 11.9.5. Product portfolio
- 11.9.6. Business performance
- 11.10. korber ag
- 11.10.1. Company overview
- 11.10.2. Key executives
- 11.10.3. Company snapshot
- 11.10.4. Operating business segments
- 11.10.5. Product portfolio
- 11.10.6. Business performance
- 11.10.7. Key strategic moves and developments
LIST OF TABLES
- TABLE 01. GLOBAL SUPPLY CHAIN MANAGEMENT MARKET, BY COMPONENT, 2022-2033 ($MILLION)
- TABLE 02. SUPPLY CHAIN MANAGEMENT MARKET FOR SOLUTION, BY REGION, 2022-2033 ($MILLION)
- TABLE 03. SUPPLY CHAIN MANAGEMENT MARKET FOR SERVICE, BY REGION, 2022-2033 ($MILLION)
- TABLE 04. GLOBAL SUPPLY CHAIN MANAGEMENT MARKET, BY SOLUTION TYPE, 2022-2033 ($MILLION)
- TABLE 05. SUPPLY CHAIN MANAGEMENT MARKET FOR TRANSPORTATION MANAGEMENT SYSTEM, BY REGION, 2022-2033 ($MILLION)
- TABLE 06. SUPPLY CHAIN MANAGEMENT MARKET FOR WAREHOUSE MANAGEMENT SYSTEM, BY REGION, 2022-2033 ($MILLION)
- TABLE 07. SUPPLY CHAIN MANAGEMENT MARKET FOR SUPPLY CHAIN PLANNING, BY REGION, 2022-2033 ($MILLION)
- TABLE 08. SUPPLY CHAIN MANAGEMENT MARKET FOR PROCUREMENT AND SOURCING, BY REGION, 2022-2033 ($MILLION)
- TABLE 09. SUPPLY CHAIN MANAGEMENT MARKET FOR MANUFACTURING EXECUTION SYSTEM, BY REGION, 2022-2033 ($MILLION)
- TABLE 10. GLOBAL SUPPLY CHAIN MANAGEMENT MARKET, BY DEPLOYMENT MODE, 2022-2033 ($MILLION)
- TABLE 11. SUPPLY CHAIN MANAGEMENT MARKET FOR ON-PREMISE, BY REGION, 2022-2033 ($MILLION)
- TABLE 12. SUPPLY CHAIN MANAGEMENT MARKET FOR ON-DEMAND/CLOUD-BASED, BY REGION, 2022-2033 ($MILLION)
- TABLE 13. GLOBAL SUPPLY CHAIN MANAGEMENT MARKET, BY ENTERPRISE SIZE, 2022-2033 ($MILLION)
- TABLE 14. SUPPLY CHAIN MANAGEMENT MARKET FOR LARGE ENTERPRISE, BY REGION, 2022-2033 ($MILLION)
- TABLE 15. SUPPLY CHAIN MANAGEMENT MARKET FOR SMES, BY REGION, 2022-2033 ($MILLION)
- TABLE 16. GLOBAL SUPPLY CHAIN MANAGEMENT MARKET, BY INDUSTRY VERTICAL, 2022-2033 ($MILLION)
- TABLE 17. SUPPLY CHAIN MANAGEMENT MARKET FOR RETAIL AND CONSUMER GOODS, BY REGION, 2022-2033 ($MILLION)
- TABLE 18. SUPPLY CHAIN MANAGEMENT MARKET FOR HEALTHCARE AND PHARMACEUTICALS, BY REGION, 2022-2033 ($MILLION)
- TABLE 19. SUPPLY CHAIN MANAGEMENT MARKET FOR MANUFACTURING, BY REGION, 2022-2033 ($MILLION)
- TABLE 20. SUPPLY CHAIN MANAGEMENT MARKET FOR FOOD AND BEVERAGES, BY REGION, 2022-2033 ($MILLION)
- TABLE 21. SUPPLY CHAIN MANAGEMENT MARKET FOR TRANSPORTATION AND LOGISTICS, BY REGION, 2022-2033 ($MILLION)
- TABLE 22. SUPPLY CHAIN MANAGEMENT MARKET FOR AUTOMOTIVE, BY REGION, 2022-2033 ($MILLION)
- TABLE 23. SUPPLY CHAIN MANAGEMENT MARKET FOR OTHERS, BY REGION, 2022-2033 ($MILLION)
- TABLE 24. SUPPLY CHAIN MANAGEMENT MARKET, BY REGION, 2022-2033 ($MILLION)
- TABLE 25. NORTH AMERICA SUPPLY CHAIN MANAGEMENT MARKET, BY COMPONENT, 2022-2033 ($MILLION)
- TABLE 26. NORTH AMERICA SUPPLY CHAIN MANAGEMENT MARKET, BY SOLUTION TYPE, 2022-2033 ($MILLION)
- TABLE 27. NORTH AMERICA SUPPLY CHAIN MANAGEMENT MARKET, BY DEPLOYMENT MODE, 2022-2033 ($MILLION)
- TABLE 28. NORTH AMERICA SUPPLY CHAIN MANAGEMENT MARKET, BY ENTERPRISE SIZE, 2022-2033 ($MILLION)
- TABLE 29. NORTH AMERICA SUPPLY CHAIN MANAGEMENT MARKET, BY INDUSTRY VERTICAL, 2022-2033 ($MILLION)
- TABLE 30. NORTH AMERICA SUPPLY CHAIN MANAGEMENT MARKET, BY COUNTRY, 2022-2033 ($MILLION)
- TABLE 31. U.S. SUPPLY CHAIN MANAGEMENT MARKET, BY COMPONENT, 2022-2033 ($MILLION)
- TABLE 32. U.S. SUPPLY CHAIN MANAGEMENT MARKET, BY SOLUTION TYPE, 2022-2033 ($MILLION)
- TABLE 33. U.S. SUPPLY CHAIN MANAGEMENT MARKET, BY DEPLOYMENT MODE, 2022-2033 ($MILLION)
- TABLE 34. U.S. SUPPLY CHAIN MANAGEMENT MARKET, BY ENTERPRISE SIZE, 2022-2033 ($MILLION)
- TABLE 35. U.S. SUPPLY CHAIN MANAGEMENT MARKET, BY INDUSTRY VERTICAL, 2022-2033 ($MILLION)
- TABLE 36. CANADA SUPPLY CHAIN MANAGEMENT MARKET, BY COMPONENT, 2022-2033 ($MILLION)
- TABLE 37. CANADA SUPPLY CHAIN MANAGEMENT MARKET, BY SOLUTION TYPE, 2022-2033 ($MILLION)
- TABLE 38. CANADA SUPPLY CHAIN MANAGEMENT MARKET, BY DEPLOYMENT MODE, 2022-2033 ($MILLION)
- TABLE 39. CANADA SUPPLY CHAIN MANAGEMENT MARKET, BY ENTERPRISE SIZE, 2022-2033 ($MILLION)
- TABLE 40. CANADA SUPPLY CHAIN MANAGEMENT MARKET, BY INDUSTRY VERTICAL, 2022-2033 ($MILLION)
- TABLE 41. EUROPE SUPPLY CHAIN MANAGEMENT MARKET, BY COMPONENT, 2022-2033 ($MILLION)
- TABLE 42. EUROPE SUPPLY CHAIN MANAGEMENT MARKET, BY SOLUTION TYPE, 2022-2033 ($MILLION)
- TABLE 43. EUROPE SUPPLY CHAIN MANAGEMENT MARKET, BY DEPLOYMENT MODE, 2022-2033 ($MILLION)
- TABLE 44. EUROPE SUPPLY CHAIN MANAGEMENT MARKET, BY ENTERPRISE SIZE, 2022-2033 ($MILLION)
- TABLE 45. EUROPE SUPPLY CHAIN MANAGEMENT MARKET, BY INDUSTRY VERTICAL, 2022-2033 ($MILLION)
- TABLE 46. EUROPE SUPPLY CHAIN MANAGEMENT MARKET, BY COUNTRY, 2022-2033 ($MILLION)
- TABLE 47. UK SUPPLY CHAIN MANAGEMENT MARKET, BY COMPONENT, 2022-2033 ($MILLION)
- TABLE 48. UK SUPPLY CHAIN MANAGEMENT MARKET, BY SOLUTION TYPE, 2022-2033 ($MILLION)
- TABLE 49. UK SUPPLY CHAIN MANAGEMENT MARKET, BY DEPLOYMENT MODE, 2022-2033 ($MILLION)
- TABLE 50. UK SUPPLY CHAIN MANAGEMENT MARKET, BY ENTERPRISE SIZE, 2022-2033 ($MILLION)
- TABLE 51. UK SUPPLY CHAIN MANAGEMENT MARKET, BY INDUSTRY VERTICAL, 2022-2033 ($MILLION)
- TABLE 52. GERMANY SUPPLY CHAIN MANAGEMENT MARKET, BY COMPONENT, 2022-2033 ($MILLION)
- TABLE 53. GERMANY SUPPLY CHAIN MANAGEMENT MARKET, BY SOLUTION TYPE, 2022-2033 ($MILLION)
- TABLE 54. GERMANY SUPPLY CHAIN MANAGEMENT MARKET, BY DEPLOYMENT MODE, 2022-2033 ($MILLION)
- TABLE 55. GERMANY SUPPLY CHAIN MANAGEMENT MARKET, BY ENTERPRISE SIZE, 2022-2033 ($MILLION)
- TABLE 56. GERMANY SUPPLY CHAIN MANAGEMENT MARKET, BY INDUSTRY VERTICAL, 2022-2033 ($MILLION)
- TABLE 57. FRANCE SUPPLY CHAIN MANAGEMENT MARKET, BY COMPONENT, 2022-2033 ($MILLION)
- TABLE 58. FRANCE SUPPLY CHAIN MANAGEMENT MARKET, BY SOLUTION TYPE, 2022-2033 ($MILLION)
- TABLE 59. FRANCE SUPPLY CHAIN MANAGEMENT MARKET, BY DEPLOYMENT MODE, 2022-2033 ($MILLION)
- TABLE 60. FRANCE SUPPLY CHAIN MANAGEMENT MARKET, BY ENTERPRISE SIZE, 2022-2033 ($MILLION)
- TABLE 61. FRANCE SUPPLY CHAIN MANAGEMENT MARKET, BY INDUSTRY VERTICAL, 2022-2033 ($MILLION)
- TABLE 62. SPAIN SUPPLY CHAIN MANAGEMENT MARKET, BY COMPONENT, 2022-2033 ($MILLION)
- TABLE 63. SPAIN SUPPLY CHAIN MANAGEMENT MARKET, BY SOLUTION TYPE, 2022-2033 ($MILLION)
- TABLE 64. SPAIN SUPPLY CHAIN MANAGEMENT MARKET, BY DEPLOYMENT MODE, 2022-2033 ($MILLION)
- TABLE 65. SPAIN SUPPLY CHAIN MANAGEMENT MARKET, BY ENTERPRISE SIZE, 2022-2033 ($MILLION)
- TABLE 66. SPAIN SUPPLY CHAIN MANAGEMENT MARKET, BY INDUSTRY VERTICAL, 2022-2033 ($MILLION)
- TABLE 67. ITALY SUPPLY CHAIN MANAGEMENT MARKET, BY COMPONENT, 2022-2033 ($MILLION)
- TABLE 68. ITALY SUPPLY CHAIN MANAGEMENT MARKET, BY SOLUTION TYPE, 2022-2033 ($MILLION)
- TABLE 69. ITALY SUPPLY CHAIN MANAGEMENT MARKET, BY DEPLOYMENT MODE, 2022-2033 ($MILLION)
- TABLE 70. ITALY SUPPLY CHAIN MANAGEMENT MARKET, BY ENTERPRISE SIZE, 2022-2033 ($MILLION)
- TABLE 71. ITALY SUPPLY CHAIN MANAGEMENT MARKET, BY INDUSTRY VERTICAL, 2022-2033 ($MILLION)
- TABLE 72. REST OF EUROPE SUPPLY CHAIN MANAGEMENT MARKET, BY COMPONENT, 2022-2033 ($MILLION)
- TABLE 73. REST OF EUROPE SUPPLY CHAIN MANAGEMENT MARKET, BY SOLUTION TYPE, 2022-2033 ($MILLION)
- TABLE 74. REST OF EUROPE SUPPLY CHAIN MANAGEMENT MARKET, BY DEPLOYMENT MODE, 2022-2033 ($MILLION)
- TABLE 75. REST OF EUROPE SUPPLY CHAIN MANAGEMENT MARKET, BY ENTERPRISE SIZE, 2022-2033 ($MILLION)
- TABLE 76. REST OF EUROPE SUPPLY CHAIN MANAGEMENT MARKET, BY INDUSTRY VERTICAL, 2022-2033 ($MILLION)
- TABLE 77. ASIA-PACIFIC SUPPLY CHAIN MANAGEMENT MARKET, BY COMPONENT, 2022-2033 ($MILLION)
- TABLE 78. ASIA-PACIFIC SUPPLY CHAIN MANAGEMENT MARKET, BY SOLUTION TYPE, 2022-2033 ($MILLION)
- TABLE 79. ASIA-PACIFIC SUPPLY CHAIN MANAGEMENT MARKET, BY DEPLOYMENT MODE, 2022-2033 ($MILLION)
- TABLE 80. ASIA-PACIFIC SUPPLY CHAIN MANAGEMENT MARKET, BY ENTERPRISE SIZE, 2022-2033 ($MILLION)
- TABLE 81. ASIA-PACIFIC SUPPLY CHAIN MANAGEMENT MARKET, BY INDUSTRY VERTICAL, 2022-2033 ($MILLION)
- TABLE 82. ASIA-PACIFIC SUPPLY CHAIN MANAGEMENT MARKET, BY COUNTRY, 2022-2033 ($MILLION)
- TABLE 83. CHINA SUPPLY CHAIN MANAGEMENT MARKET, BY COMPONENT, 2022-2033 ($MILLION)
- TABLE 84. CHINA SUPPLY CHAIN MANAGEMENT MARKET, BY SOLUTION TYPE, 2022-2033 ($MILLION)
- TABLE 85. CHINA SUPPLY CHAIN MANAGEMENT MARKET, BY DEPLOYMENT MODE, 2022-2033 ($MILLION)
- TABLE 86. CHINA SUPPLY CHAIN MANAGEMENT MARKET, BY ENTERPRISE SIZE, 2022-2033 ($MILLION)
- TABLE 87. CHINA SUPPLY CHAIN MANAGEMENT MARKET, BY INDUSTRY VERTICAL, 2022-2033 ($MILLION)
- TABLE 88. JAPAN SUPPLY CHAIN MANAGEMENT MARKET, BY COMPONENT, 2022-2033 ($MILLION)
- TABLE 89. JAPAN SUPPLY CHAIN MANAGEMENT MARKET, BY SOLUTION TYPE, 2022-2033 ($MILLION)
- TABLE 90. JAPAN SUPPLY CHAIN MANAGEMENT MARKET, BY DEPLOYMENT MODE, 2022-2033 ($MILLION)
- TABLE 91. JAPAN SUPPLY CHAIN MANAGEMENT MARKET, BY ENTERPRISE SIZE, 2022-2033 ($MILLION)
- TABLE 92. JAPAN SUPPLY CHAIN MANAGEMENT MARKET, BY INDUSTRY VERTICAL, 2022-2033 ($MILLION)
- TABLE 93. SOUTH KOREA SUPPLY CHAIN MANAGEMENT MARKET, BY COMPONENT, 2022-2033 ($MILLION)
- TABLE 94. SOUTH KOREA SUPPLY CHAIN MANAGEMENT MARKET, BY SOLUTION TYPE, 2022-2033 ($MILLION)
- TABLE 95. SOUTH KOREA SUPPLY CHAIN MANAGEMENT MARKET, BY DEPLOYMENT MODE, 2022-2033 ($MILLION)
- TABLE 96. SOUTH KOREA SUPPLY CHAIN MANAGEMENT MARKET, BY ENTERPRISE SIZE, 2022-2033 ($MILLION)
- TABLE 97. SOUTH KOREA SUPPLY CHAIN MANAGEMENT MARKET, BY INDUSTRY VERTICAL, 2022-2033 ($MILLION)
- TABLE 98. INDIA SUPPLY CHAIN MANAGEMENT MARKET, BY COMPONENT, 2022-2033 ($MILLION)
- TABLE 99. INDIA SUPPLY CHAIN MANAGEMENT MARKET, BY SOLUTION TYPE, 2022-2033 ($MILLION)
- TABLE 100. INDIA SUPPLY CHAIN MANAGEMENT MARKET, BY DEPLOYMENT MODE, 2022-2033 ($MILLION)
- TABLE 101. INDIA SUPPLY CHAIN MANAGEMENT MARKET, BY ENTERPRISE SIZE, 2022-2033 ($MILLION)
- TABLE 102. INDIA SUPPLY CHAIN MANAGEMENT MARKET, BY INDUSTRY VERTICAL, 2022-2033 ($MILLION)
- TABLE 103. AUSTRALIA SUPPLY CHAIN MANAGEMENT MARKET, BY COMPONENT, 2022-2033 ($MILLION)
- TABLE 104. AUSTRALIA SUPPLY CHAIN MANAGEMENT MARKET, BY SOLUTION TYPE, 2022-2033 ($MILLION)
- TABLE 105. AUSTRALIA SUPPLY CHAIN MANAGEMENT MARKET, BY DEPLOYMENT MODE, 2022-2033 ($MILLION)
- TABLE 106. AUSTRALIA SUPPLY CHAIN MANAGEMENT MARKET, BY ENTERPRISE SIZE, 2022-2033 ($MILLION)
- TABLE 107. AUSTRALIA SUPPLY CHAIN MANAGEMENT MARKET, BY INDUSTRY VERTICAL, 2022-2033 ($MILLION)
- TABLE 108. REST OF ASIA-PACIFIC SUPPLY CHAIN MANAGEMENT MARKET, BY COMPONENT, 2022-2033 ($MILLION)
- TABLE 109. REST OF ASIA-PACIFIC SUPPLY CHAIN MANAGEMENT MARKET, BY SOLUTION TYPE, 2022-2033 ($MILLION)
- TABLE 110. REST OF ASIA-PACIFIC SUPPLY CHAIN MANAGEMENT MARKET, BY DEPLOYMENT MODE, 2022-2033 ($MILLION)
- TABLE 111. REST OF ASIA-PACIFIC SUPPLY CHAIN MANAGEMENT MARKET, BY ENTERPRISE SIZE, 2022-2033 ($MILLION)
- TABLE 112. REST OF ASIA-PACIFIC SUPPLY CHAIN MANAGEMENT MARKET, BY INDUSTRY VERTICAL, 2022-2033 ($MILLION)
- TABLE 113. LAMEA SUPPLY CHAIN MANAGEMENT MARKET, BY COMPONENT, 2022-2033 ($MILLION)
- TABLE 114. LAMEA SUPPLY CHAIN MANAGEMENT MARKET, BY SOLUTION TYPE, 2022-2033 ($MILLION)
- TABLE 115. LAMEA SUPPLY CHAIN MANAGEMENT MARKET, BY DEPLOYMENT MODE, 2022-2033 ($MILLION)
- TABLE 116. LAMEA SUPPLY CHAIN MANAGEMENT MARKET, BY ENTERPRISE SIZE, 2022-2033 ($MILLION)
- TABLE 117. LAMEA SUPPLY CHAIN MANAGEMENT MARKET, BY INDUSTRY VERTICAL, 2022-2033 ($MILLION)
- TABLE 118. LAMEA SUPPLY CHAIN MANAGEMENT MARKET, BY COUNTRY, 2022-2033 ($MILLION)
- TABLE 119. LATIN AMERICA SUPPLY CHAIN MANAGEMENT MARKET, BY COMPONENT, 2022-2033 ($MILLION)
- TABLE 120. LATIN AMERICA SUPPLY CHAIN MANAGEMENT MARKET, BY SOLUTION TYPE, 2022-2033 ($MILLION)
- TABLE 121. LATIN AMERICA SUPPLY CHAIN MANAGEMENT MARKET, BY DEPLOYMENT MODE, 2022-2033 ($MILLION)
- TABLE 122. LATIN AMERICA SUPPLY CHAIN MANAGEMENT MARKET, BY ENTERPRISE SIZE, 2022-2033 ($MILLION)
- TABLE 123. LATIN AMERICA SUPPLY CHAIN MANAGEMENT MARKET, BY INDUSTRY VERTICAL, 2022-2033 ($MILLION)
- TABLE 124. MIDDLE EAST SUPPLY CHAIN MANAGEMENT MARKET, BY COMPONENT, 2022-2033 ($MILLION)
- TABLE 125. MIDDLE EAST SUPPLY CHAIN MANAGEMENT MARKET, BY SOLUTION TYPE, 2022-2033 ($MILLION)
- TABLE 126. MIDDLE EAST SUPPLY CHAIN MANAGEMENT MARKET, BY DEPLOYMENT MODE, 2022-2033 ($MILLION)
- TABLE 127. MIDDLE EAST SUPPLY CHAIN MANAGEMENT MARKET, BY ENTERPRISE SIZE, 2022-2033 ($MILLION)
- TABLE 128. MIDDLE EAST SUPPLY CHAIN MANAGEMENT MARKET, BY INDUSTRY VERTICAL, 2022-2033 ($MILLION)
- TABLE 129. AFRICA SUPPLY CHAIN MANAGEMENT MARKET, BY COMPONENT, 2022-2033 ($MILLION)
- TABLE 130. AFRICA SUPPLY CHAIN MANAGEMENT MARKET, BY SOLUTION TYPE, 2022-2033 ($MILLION)
- TABLE 131. AFRICA SUPPLY CHAIN MANAGEMENT MARKET, BY DEPLOYMENT MODE, 2022-2033 ($MILLION)
- TABLE 132. AFRICA SUPPLY CHAIN MANAGEMENT MARKET, BY ENTERPRISE SIZE, 2022-2033 ($MILLION)
- TABLE 133. AFRICA SUPPLY CHAIN MANAGEMENT MARKET, BY INDUSTRY VERTICAL, 2022-2033 ($MILLION)
- TABLE 134. THE DESCARTES SYSTEMS GROUP INC: KEY EXECUTIVES
- TABLE 135. THE DESCARTES SYSTEMS GROUP INC: COMPANY SNAPSHOT
- TABLE 136. THE DESCARTES SYSTEMS GROUP INC: PRODUCT SEGMENTS
- TABLE 137. THE DESCARTES SYSTEMS GROUP INC: PRODUCT PORTFOLIO
- TABLE 138. THE DESCARTES SYSTEMS GROUP INC: KEY STRATERGIES
- TABLE 139. IBM CORPORATION: KEY EXECUTIVES
- TABLE 140. IBM CORPORATION: COMPANY SNAPSHOT
- TABLE 141. IBM CORPORATION: SERVICE SEGMENTS
- TABLE 142. IBM CORPORATION: PRODUCT PORTFOLIO
- TABLE 143. IBM CORPORATION: KEY STRATERGIES
- TABLE 144. SAP SE: KEY EXECUTIVES
- TABLE 145. SAP SE: COMPANY SNAPSHOT
- TABLE 146. SAP SE: SERVICE SEGMENTS
- TABLE 147. SAP SE: PRODUCT PORTFOLIO
- TABLE 148. SAP SE: KEY STRATERGIES
- TABLE 149. KINAXIS: KEY EXECUTIVES
- TABLE 150. KINAXIS: COMPANY SNAPSHOT
- TABLE 151. KINAXIS: PRODUCT SEGMENTS
- TABLE 152. KINAXIS: PRODUCT PORTFOLIO
- TABLE 153. KINAXIS: KEY STRATERGIES
- TABLE 154. BLUE YONDER GROUP, INC.: KEY EXECUTIVES
- TABLE 155. BLUE YONDER GROUP, INC.: COMPANY SNAPSHOT
- TABLE 156. BLUE YONDER GROUP, INC.: SERVICE SEGMENTS
- TABLE 157. BLUE YONDER GROUP, INC.: PRODUCT PORTFOLIO
- TABLE 158. EPICOR SOFTWARE CORPORATION: KEY EXECUTIVES
- TABLE 159. EPICOR SOFTWARE CORPORATION: COMPANY SNAPSHOT
- TABLE 160. EPICOR SOFTWARE CORPORATION: PRODUCT SEGMENTS
- TABLE 161. EPICOR SOFTWARE CORPORATION: PRODUCT PORTFOLIO
- TABLE 162. EPICOR SOFTWARE CORPORATION: KEY STRATERGIES
- TABLE 163. MANHATTAN ASSOCIATES, INC.: KEY EXECUTIVES
- TABLE 164. MANHATTAN ASSOCIATES, INC.: COMPANY SNAPSHOT
- TABLE 165. MANHATTAN ASSOCIATES, INC.: SERVICE SEGMENTS
- TABLE 166. MANHATTAN ASSOCIATES, INC.: PRODUCT PORTFOLIO
- TABLE 167. INFOR: KEY EXECUTIVES
- TABLE 168. INFOR: COMPANY SNAPSHOT
- TABLE 169. INFOR: PRODUCT SEGMENTS
- TABLE 170. INFOR: PRODUCT PORTFOLIO
- TABLE 171. ORACLE CORPORATION: KEY EXECUTIVES
- TABLE 172. ORACLE CORPORATION: COMPANY SNAPSHOT
- TABLE 173. ORACLE CORPORATION: SERVICE SEGMENTS
- TABLE 174. ORACLE CORPORATION: PRODUCT PORTFOLIO
- TABLE 175. KORBER AG: KEY EXECUTIVES
- TABLE 176. KORBER AG: COMPANY SNAPSHOT
- TABLE 177. KORBER AG: PRODUCT SEGMENTS
- TABLE 178. KORBER AG: PRODUCT PORTFOLIO
- TABLE 179. KORBER AG: KEY STRATERGIES
LIST OF FIGURES
- FIGURE 01. SUPPLY CHAIN MANAGEMENT MARKET, 2022-2033
- FIGURE 02. SEGMENTATION OF SUPPLY CHAIN MANAGEMENT MARKET,2022-2033
- FIGURE 03. TOP IMPACTING FACTORS IN SUPPLY CHAIN MANAGEMENT MARKET (2022 TO 2032)
- FIGURE 04. TOP INVESTMENT POCKETS IN SUPPLY CHAIN MANAGEMENT MARKET (2023-2033)
- FIGURE 05. HIGH BARGAINING POWER OF SUPPLIERS
- FIGURE 06. MODERATE THREAT OF NEW ENTRANTS
- FIGURE 07. MODERATE THREAT OF SUBSTITUTES
- FIGURE 08. MODERATE TO HIGH INTENSITY OF RIVALRY
- FIGURE 09. MODERATE BARGAINING POWER OF BUYERS
- FIGURE 10. GLOBAL SUPPLY CHAIN MANAGEMENT MARKET:DRIVERS, RESTRAINTS AND OPPORTUNITIES
- FIGURE 11. SUPPLY CHAIN MANAGEMENT MARKET, BY COMPONENT, 2022 AND 2033(%)
- FIGURE 12. COMPARATIVE SHARE ANALYSIS OF SUPPLY CHAIN MANAGEMENT MARKET FOR SOLUTION, BY COUNTRY 2022 AND 2033(%)
- FIGURE 13. COMPARATIVE SHARE ANALYSIS OF SUPPLY CHAIN MANAGEMENT MARKET FOR SERVICE, BY COUNTRY 2022 AND 2033(%)
- FIGURE 14. SUPPLY CHAIN MANAGEMENT MARKET, BY SOLUTION TYPE, 2022 AND 2033(%)
- FIGURE 15. COMPARATIVE SHARE ANALYSIS OF SUPPLY CHAIN MANAGEMENT MARKET FOR TRANSPORTATION MANAGEMENT SYSTEM, BY COUNTRY 2022 AND 2033(%)
- FIGURE 16. COMPARATIVE SHARE ANALYSIS OF SUPPLY CHAIN MANAGEMENT MARKET FOR WAREHOUSE MANAGEMENT SYSTEM, BY COUNTRY 2022 AND 2033(%)
- FIGURE 17. COMPARATIVE SHARE ANALYSIS OF SUPPLY CHAIN MANAGEMENT MARKET FOR SUPPLY CHAIN PLANNING, BY COUNTRY 2022 AND 2033(%)
- FIGURE 18. COMPARATIVE SHARE ANALYSIS OF SUPPLY CHAIN MANAGEMENT MARKET FOR PROCUREMENT AND SOURCING, BY COUNTRY 2022 AND 2033(%)
- FIGURE 19. COMPARATIVE SHARE ANALYSIS OF SUPPLY CHAIN MANAGEMENT MARKET FOR MANUFACTURING EXECUTION SYSTEM, BY COUNTRY 2022 AND 2033(%)
- FIGURE 20. SUPPLY CHAIN MANAGEMENT MARKET, BY DEPLOYMENT MODE, 2022 AND 2033(%)
- FIGURE 21. COMPARATIVE SHARE ANALYSIS OF SUPPLY CHAIN MANAGEMENT MARKET FOR ON-PREMISE, BY COUNTRY 2022 AND 2033(%)
- FIGURE 22. COMPARATIVE SHARE ANALYSIS OF SUPPLY CHAIN MANAGEMENT MARKET FOR ON-DEMAND/CLOUD-BASED, BY COUNTRY 2022 AND 2033(%)
- FIGURE 23. SUPPLY CHAIN MANAGEMENT MARKET, BY ENTERPRISE SIZE, 2022 AND 2033(%)
- FIGURE 24. COMPARATIVE SHARE ANALYSIS OF SUPPLY CHAIN MANAGEMENT MARKET FOR LARGE ENTERPRISE, BY COUNTRY 2022 AND 2033(%)
- FIGURE 25. COMPARATIVE SHARE ANALYSIS OF SUPPLY CHAIN MANAGEMENT MARKET FOR SMES, BY COUNTRY 2022 AND 2033(%)
- FIGURE 26. SUPPLY CHAIN MANAGEMENT MARKET, BY INDUSTRY VERTICAL, 2022 AND 2033(%)
- FIGURE 27. COMPARATIVE SHARE ANALYSIS OF SUPPLY CHAIN MANAGEMENT MARKET FOR RETAIL AND CONSUMER GOODS, BY COUNTRY 2022 AND 2033(%)
- FIGURE 28. COMPARATIVE SHARE ANALYSIS OF SUPPLY CHAIN MANAGEMENT MARKET FOR HEALTHCARE AND PHARMACEUTICALS, BY COUNTRY 2022 AND 2033(%)
- FIGURE 29. COMPARATIVE SHARE ANALYSIS OF SUPPLY CHAIN MANAGEMENT MARKET FOR MANUFACTURING, BY COUNTRY 2022 AND 2033(%)
- FIGURE 30. COMPARATIVE SHARE ANALYSIS OF SUPPLY CHAIN MANAGEMENT MARKET FOR FOOD AND BEVERAGES, BY COUNTRY 2022 AND 2033(%)
- FIGURE 31. COMPARATIVE SHARE ANALYSIS OF SUPPLY CHAIN MANAGEMENT MARKET FOR TRANSPORTATION AND LOGISTICS, BY COUNTRY 2022 AND 2033(%)
- FIGURE 32. COMPARATIVE SHARE ANALYSIS OF SUPPLY CHAIN MANAGEMENT MARKET FOR AUTOMOTIVE, BY COUNTRY 2022 AND 2033(%)
- FIGURE 33. COMPARATIVE SHARE ANALYSIS OF SUPPLY CHAIN MANAGEMENT MARKET FOR OTHERS, BY COUNTRY 2022 AND 2033(%)
- FIGURE 34. SUPPLY CHAIN MANAGEMENT MARKET BY REGION, 2022 AND 2033(%)
- FIGURE 35. U.S. SUPPLY CHAIN MANAGEMENT MARKET, 2022-2033 ($MILLION)
- FIGURE 36. CANADA SUPPLY CHAIN MANAGEMENT MARKET, 2022-2033 ($MILLION)
- FIGURE 37. UK SUPPLY CHAIN MANAGEMENT MARKET, 2022-2033 ($MILLION)
- FIGURE 38. GERMANY SUPPLY CHAIN MANAGEMENT MARKET, 2022-2033 ($MILLION)
- FIGURE 39. FRANCE SUPPLY CHAIN MANAGEMENT MARKET, 2022-2033 ($MILLION)
- FIGURE 40. SPAIN SUPPLY CHAIN MANAGEMENT MARKET, 2022-2033 ($MILLION)
- FIGURE 41. ITALY SUPPLY CHAIN MANAGEMENT MARKET, 2022-2033 ($MILLION)
- FIGURE 42. REST OF EUROPE SUPPLY CHAIN MANAGEMENT MARKET, 2022-2033 ($MILLION)
- FIGURE 43. CHINA SUPPLY CHAIN MANAGEMENT MARKET, 2022-2033 ($MILLION)
- FIGURE 44. JAPAN SUPPLY CHAIN MANAGEMENT MARKET, 2022-2033 ($MILLION)
- FIGURE 45. SOUTH KOREA SUPPLY CHAIN MANAGEMENT MARKET, 2022-2033 ($MILLION)
- FIGURE 46. INDIA SUPPLY CHAIN MANAGEMENT MARKET, 2022-2033 ($MILLION)
- FIGURE 47. AUSTRALIA SUPPLY CHAIN MANAGEMENT MARKET, 2022-2033 ($MILLION)
- FIGURE 48. REST OF ASIA-PACIFIC SUPPLY CHAIN MANAGEMENT MARKET, 2022-2033 ($MILLION)
- FIGURE 49. LATIN AMERICA SUPPLY CHAIN MANAGEMENT MARKET, 2022-2033 ($MILLION)
- FIGURE 50. MIDDLE EAST SUPPLY CHAIN MANAGEMENT MARKET, 2022-2033 ($MILLION)
- FIGURE 51. AFRICA SUPPLY CHAIN MANAGEMENT MARKET, 2022-2033 ($MILLION)
- FIGURE 52. TOP WINNING STRATEGIES, BY YEAR (2020-2023)
- FIGURE 53. TOP WINNING STRATEGIES, BY DEVELOPMENT (2020-2023)
- FIGURE 54. TOP WINNING STRATEGIES, BY COMPANY (2020-2023)
- FIGURE 55. PRODUCT MAPPING OF TOP 10 PLAYERS
- FIGURE 56. COMPETITIVE DASHBOARD
- FIGURE 57. COMPETITIVE HEATMAP: SUPPLY CHAIN MANAGEMENT MARKET
- FIGURE 58. TOP PLAYER POSITIONING, 2022
- FIGURE 59. THE DESCARTES SYSTEMS GROUP INC: NET REVENUE, 2021-2023 ($MILLION)
- FIGURE 60. THE DESCARTES SYSTEMS GROUP INC: RESEARCH & DEVELOPMENT EXPENDITURE, 2021-2023 ($MILLION)
- FIGURE 61. THE DESCARTES SYSTEMS GROUP INC: REVENUE SHARE BY SEGMENT, 2023 (%)
- FIGURE 62. THE DESCARTES SYSTEMS GROUP INC: REVENUE SHARE BY REGION, 2022 (%)
- FIGURE 63. IBM CORPORATION: NET REVENUE, 2020-2022 ($MILLION)
- FIGURE 64. IBM CORPORATION: RESEARCH & DEVELOPMENT EXPENDITURE, 2020-2022 ($MILLION)
- FIGURE 65. IBM CORPORATION: REVENUE SHARE BY SEGMENT, 2022 (%)
- FIGURE 66. IBM CORPORATION: REVENUE SHARE BY REGION, 2021 (%)
- FIGURE 67. SAP SE: NET REVENUE, 2020-2022 ($MILLION)
- FIGURE 68. SAP SE: RESEARCH & DEVELOPMENT EXPENDITURE, 2020-2022 ($MILLION)
- FIGURE 69. SAP SE: REVENUE SHARE BY SEGMENT, 2022 (%)
- FIGURE 70. SAP SE: REVENUE SHARE BY REGION, 2022 (%)
- FIGURE 71. KINAXIS: NET REVENUE, 2020-2022 ($MILLION)
- FIGURE 72. KINAXIS: RESEARCH & DEVELOPMENT EXPENDITURE, 2020-2022 ($MILLION)
- FIGURE 73. KINAXIS: REVENUE SHARE BY REGION, 2022 (%)
- FIGURE 74. KINAXIS: REVENUE SHARE BY SEGMENT, 2022 (%)
- FIGURE 75. MANHATTAN ASSOCIATES, INC.: NET REVENUE, 2019-2021 ($MILLION)
- FIGURE 76. MANHATTAN ASSOCIATES, INC.: RESEARCH & DEVELOPMENT EXPENDITURE, 2019-2021
- FIGURE 77. MANHATTAN ASSOCIATES, INC.: REVENUE SHARE BY REGION, 2021 (%)
- FIGURE 78. MANHATTAN ASSOCIATES, INC.: REVENUE SHARE BY SEGMENT, 2021 (%)
- FIGURE 79. ORACLE CORPORATION: NET REVENUE, 2021-2023 ($MILLION)
- FIGURE 80. ORACLE CORPORATION: RESEARCH & DEVELOPMENT EXPENDITURE, 2021-2023 ($MILLION)
- FIGURE 81. ORACLE CORPORATION: REVENUE SHARE BY SEGMENT, 2023 (%)
- FIGURE 82. ORACLE CORPORATION: REVENUE SHARE BY REGION, 2023 (%)
- FIGURE 83. KORBER AG: NET REVENUE, 2020-2022 ($MILLION)

