
PUBLISHER: Allied Market Research | PRODUCT CODE: 1472295

PUBLISHER: Allied Market Research | PRODUCT CODE: 1472295
Polyacrylic Acid Market By Type, By Application, By End-Use Industry : Global Opportunity Analysis and Industry Forecast, 2023-2032
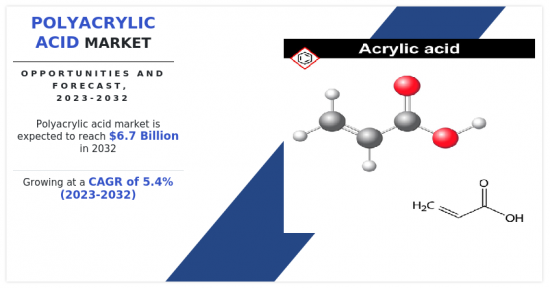
The global polyacrylic acid market was valued at $4 billion in 2022, and is projected to reach $6.7 billion by 2032, growing at a CAGR of 5.4% from 2023 to 2032.
Introduction
Polyacrylic acid is a synthetic polymer with the chemical formula (C3H4O2)n, where "n" represents the number of repeating units in the polymer chain. It belongs to the class of acrylic polymers and is characterized by its high molecular weight. Polyacrylic acid is derived from acrylic acid through polymerization processes. It is a versatile polymer known for its water-absorbing and adhesive properties.
Polyacrylic acid has a wide range of applications across various industries. One of its significant uses is in water treatment, where it functions as a scale inhibitor, helping to prevent the formation of scale deposits in pipelines, boilers, and other water-handling equipment. In addition, it is employed in the production of superabsorbent polymers, which find applications in diapers, agriculture, and other absorbent products.
In the field of coatings and adhesives, polyacrylic acid is utilized for its binding and film-forming properties. It is found in products such as paints, adhesives, and sealants. The polymer's ability to form transparent films makes it useful in applications where clarity is important. For instance, polyacrylic acid is majorly applicable in food packaging due to its superior hardness and barrier quality. Known for its biocompatibility, it is suitable for use in some medical and pharmaceutical applications. It is important to note that the specific properties and applications of polyacrylic acid vary on the basis of factors such as its molecular weight and the conditions of its synthesis.
Market Dynamics
The paint and coatings industry has experienced rapid expansion globally, driven by urbanization, infrastructure development, and the automotive sector's growth. Polyacrylic acid is utilized in paints and coatings formulations as a thickener, rheology modifier, and dispersant. It helps improve the application properties, film formation, and adhesion of coatings, thereby enhancing their performance and durability. As emerging economies witness significant infrastructural development and the automotive industry continues to expand, the demand for paints and coatings is expected to soar. Consequently, the market for PAA in this industry is poised for substantial growth.
The price of raw materials used in PAA production, such as acrylic acid, is subject to volatility due to factors such as fluctuations in crude oil prices, supply chain disruptions, and geopolitical tensions. Price volatility affects overall production costs of PAA, influencing pricing strategies and profit margins for manufacturers. Managing raw material costs and exploring alternative sourcing strategies have become crucial to mitigate the impact of price fluctuations in the PAA market.
Furthermore, increase in demand for soil conditioners and water retention agents presents another favorable opportunity for the PAA market. PAA-based formulations are used in agriculture as soil conditioners and water retention agents to improve soil structure, water retention capacity, and nutrient availability. With the global emphasis on sustainable agricultural practices and water conservation, there is a growing need for effective solutions to enhance crop yield and optimize water usage. PAA's ability to improve soil quality and water retention makes it well-suited for addressing these challenges, positioning it as a promising option for sustainable agriculture practices.
Segments Overview
The poly acrylic acid market is segmented into type, application, end-use industry, and region. On the basis of type, the market is bifurcated into synthetic and bio-based. Depending on application, it is segregated into thickeners, dispersant, scale inhibitor, emulsifiers, binders, and others (conditioners and clarifying agents). By end-use industry, it is fragmented into construction, paints & coatings, pulp & paper, adhesives & sealants, water treatment, pharmaceutical, cosmetic, and others (textile and consumer goods). On the basis of region, the market is analyzed across North America, Europe, Asia-Pacific, and LAMEA.
The major players operating in polyacrylic acid market include Acuro Organics Limited, Evonik Industries AG, Sumitomo Seika Chemicals, Dow, Maxwell Additives Pvt, Ltd, Nippon Shokubai Co. Ltd, Ashland Inc., Lubrizol Corporation, BASF SE, and Arkema.
Key Market Trends
- On the basis of type, the synthetic segment registered the highest accounting for more than four-fifths of the market share and is projected to maintain the same during the forecast period.
- On the basis of application, scale inhibitor segment registered the highest market share accounting for nearly one-fourth of the market share in 2022.
- On the basis of end-use industry, water treatment segment held the highest market share accounting for nearly one-fourth of the market share in 2022.
- On the basis of region, Asia-Pacific is expected to dominate the market during the forecast period.
Key Benefits For Stakeholders
- This report provides a quantitative analysis of the market segments, current trends, estimations, and dynamics of the polyacrylic acid market analysis from 2022 to 2032 to identify the prevailing polyacrylic acid market opportunities.
- The market research is offered along with information related to key drivers, restraints, and opportunities.
- Porter's five forces analysis highlights the potency of buyers and suppliers to enable stakeholders make profit-oriented business decisions and strengthen their supplier-buyer network.
- In-depth analysis of the polyacrylic acid market segmentation assists to determine the prevailing market opportunities.
- Major countries in each region are mapped according to their revenue contribution to the global market.
- Market player positioning facilitates benchmarking and provides a clear understanding of the present position of the market players.
- The report includes the analysis of the regional as well as global polyacrylic acid market trends, key players, market segments, application areas, and market growth strategies.
Additional benefits you will get with this purchase are:
- Quarterly Update and* (only available with a corporate license, on listed price)
- 5 additional Company Profile of client Choice pre- or Post-purchase, as a free update.
- Free Upcoming Version on the Purchase of Five and Enterprise User License.
- 16 analyst hours of support* (post-purchase, if you find additional data requirements upon review of the report, you may receive support amounting to 16 analyst hours to solve questions, and post-sale queries)
- 15% Free Customization* (in case the scope or segment of the report does not match your requirements, 15% is equivalent to 3 working days of free work, applicable once)
- Free data Pack on the Five and Enterprise User License. (Excel version of the report)
- Free Updated report if the report is 6-12 months old or older.
- 24-hour priority response*
- Free Industry updates and white papers.
Possible Customization with this report (with additional cost and timeline, please talk to the sales executive to know more)
- Manufacturing Capacity
- Capital Investment breakdown
- Investment Opportunities
- Upcoming/New Entrant by Regions
- Technology Trend Analysis
- Regulatory Guidelines
- Strategic Recommendations
- Additional company profiles with specific to client's interest
- Additional country or region analysis- market size and forecast
- Expanded list for Company Profiles
- Historic market data
- Import Export Analysis/Data
- Volume Market Size and Forecast
Key Market Segments
By Application
- Thickeners
- Dispersant
- Scale Inhibitor
- Emulsifiers
- Binders
- Others
By Type
- Bio-Based
- Synthetic
By End-Use Industry
- Construction
- Paints and Coatings
- Pulp and Paper
- Adhesives and Sealants
- Water Treatment
- Pharmaceuticals
- Cosmetics
- Others
By Region
- North America
- U.S.
- Canada
- Mexico
- Europe
- Germany
- France
- UK
- Spain
- Italy
- Rest of Europe
- Asia-Pacific
- China
- Japan
- India
- South Korea
- Australia
- Rest of Asia-Pacific
- LAMEA
- Brazil
- South Africa
- Saudi Arabia
- Rest of LAMEA
Key Market Players:
- Arkema
- BASF SE
- The Lubrizol Corporation
- Dow Inc.
- Maxwell Additives Pvt. Ltd.
- Nippon Shokubai Co. Ltd.
- Ashland Inc.
- ACURO ORGANICS LIMITED
- Evonik Industries AG
- Sumitomo Seika Chemicals
TABLE OF CONTENTS
CHAPTER 1: INTRODUCTION
- 1.1. Report description
- 1.2. Key market segments
- 1.3. Key benefits to the stakeholders
- 1.4. Research methodology
- 1.4.1. Primary research
- 1.4.2. Secondary research
- 1.4.3. Analyst tools and models
CHAPTER 2: EXECUTIVE SUMMARY
- 2.1. CXO perspective
CHAPTER 3: MARKET OVERVIEW
- 3.1. Market definition and scope
- 3.2. Key findings
- 3.2.1. Top impacting factors
- 3.2.2. Top investment pockets
- 3.3. Porter's five forces analysis
- 3.4. Market dynamics
- 3.4.1. Drivers
- 3.4.2. Restraints
- 3.4.3. Opportunities
- 3.5. Value Chain Analysis
- 3.6. Pricing Analysis
- 3.7. Key Regulation Analysis
- 3.8. Patent Landscape
- 3.9. PESTLE Analysis
- 3.10. Customer Profiles
CHAPTER 4: POLYACRYLIC ACID MARKET, BY TYPE
- 4.1. Overview
- 4.1.1. Market size and forecast
- 4.2. Synthetic
- 4.2.1. Key market trends, growth factors and opportunities
- 4.2.2. Market size and forecast, by region
- 4.2.3. Market share analysis by country
- 4.3. Bio-Based
- 4.3.1. Key market trends, growth factors and opportunities
- 4.3.2. Market size and forecast, by region
- 4.3.3. Market share analysis by country
CHAPTER 5: POLYACRYLIC ACID MARKET, BY APPLICATION
- 5.1. Overview
- 5.1.1. Market size and forecast
- 5.2. Thickeners
- 5.2.1. Key market trends, growth factors and opportunities
- 5.2.2. Market size and forecast, by region
- 5.2.3. Market share analysis by country
- 5.3. Dispersant
- 5.3.1. Key market trends, growth factors and opportunities
- 5.3.2. Market size and forecast, by region
- 5.3.3. Market share analysis by country
- 5.4. Scale Inhibitor
- 5.4.1. Key market trends, growth factors and opportunities
- 5.4.2. Market size and forecast, by region
- 5.4.3. Market share analysis by country
- 5.5. Emulsifiers
- 5.5.1. Key market trends, growth factors and opportunities
- 5.5.2. Market size and forecast, by region
- 5.5.3. Market share analysis by country
- 5.6. Binders
- 5.6.1. Key market trends, growth factors and opportunities
- 5.6.2. Market size and forecast, by region
- 5.6.3. Market share analysis by country
- 5.7. Others
- 5.7.1. Key market trends, growth factors and opportunities
- 5.7.2. Market size and forecast, by region
- 5.7.3. Market share analysis by country
CHAPTER 6: POLYACRYLIC ACID MARKET, BY END-USE INDUSTRY
- 6.1. Overview
- 6.1.1. Market size and forecast
- 6.2. Construction
- 6.2.1. Key market trends, growth factors and opportunities
- 6.2.2. Market size and forecast, by region
- 6.2.3. Market share analysis by country
- 6.3. Paints and Coatings
- 6.3.1. Key market trends, growth factors and opportunities
- 6.3.2. Market size and forecast, by region
- 6.3.3. Market share analysis by country
- 6.4. Pulp and Paper
- 6.4.1. Key market trends, growth factors and opportunities
- 6.4.2. Market size and forecast, by region
- 6.4.3. Market share analysis by country
- 6.5. Adhesives and Sealants
- 6.5.1. Key market trends, growth factors and opportunities
- 6.5.2. Market size and forecast, by region
- 6.5.3. Market share analysis by country
- 6.6. Water Treatment
- 6.6.1. Key market trends, growth factors and opportunities
- 6.6.2. Market size and forecast, by region
- 6.6.3. Market share analysis by country
- 6.7. Pharmaceuticals
- 6.7.1. Key market trends, growth factors and opportunities
- 6.7.2. Market size and forecast, by region
- 6.7.3. Market share analysis by country
- 6.8. Cosmetics
- 6.8.1. Key market trends, growth factors and opportunities
- 6.8.2. Market size and forecast, by region
- 6.8.3. Market share analysis by country
- 6.9. Others
- 6.9.1. Key market trends, growth factors and opportunities
- 6.9.2. Market size and forecast, by region
- 6.9.3. Market share analysis by country
CHAPTER 7: POLYACRYLIC ACID MARKET, BY REGION
- 7.1. Overview
- 7.1.1. Market size and forecast By Region
- 7.2. North America
- 7.2.1. Key market trends, growth factors and opportunities
- 7.2.2. Market size and forecast, by Type
- 7.2.3. Market size and forecast, by Application
- 7.2.4. Market size and forecast, by End-Use Industry
- 7.2.5. Market size and forecast, by country
- 7.2.5.1. U.S.
- 7.2.5.1.1. Market size and forecast, by Type
- 7.2.5.1.2. Market size and forecast, by Application
- 7.2.5.1.3. Market size and forecast, by End-Use Industry
- 7.2.5.2. Canada
- 7.2.5.2.1. Market size and forecast, by Type
- 7.2.5.2.2. Market size and forecast, by Application
- 7.2.5.2.3. Market size and forecast, by End-Use Industry
- 7.2.5.3. Mexico
- 7.2.5.3.1. Market size and forecast, by Type
- 7.2.5.3.2. Market size and forecast, by Application
- 7.2.5.3.3. Market size and forecast, by End-Use Industry
- 7.3. Europe
- 7.3.1. Key market trends, growth factors and opportunities
- 7.3.2. Market size and forecast, by Type
- 7.3.3. Market size and forecast, by Application
- 7.3.4. Market size and forecast, by End-Use Industry
- 7.3.5. Market size and forecast, by country
- 7.3.5.1. Germany
- 7.3.5.1.1. Market size and forecast, by Type
- 7.3.5.1.2. Market size and forecast, by Application
- 7.3.5.1.3. Market size and forecast, by End-Use Industry
- 7.3.5.2. France
- 7.3.5.2.1. Market size and forecast, by Type
- 7.3.5.2.2. Market size and forecast, by Application
- 7.3.5.2.3. Market size and forecast, by End-Use Industry
- 7.3.5.3. UK
- 7.3.5.3.1. Market size and forecast, by Type
- 7.3.5.3.2. Market size and forecast, by Application
- 7.3.5.3.3. Market size and forecast, by End-Use Industry
- 7.3.5.4. Spain
- 7.3.5.4.1. Market size and forecast, by Type
- 7.3.5.4.2. Market size and forecast, by Application
- 7.3.5.4.3. Market size and forecast, by End-Use Industry
- 7.3.5.5. Italy
- 7.3.5.5.1. Market size and forecast, by Type
- 7.3.5.5.2. Market size and forecast, by Application
- 7.3.5.5.3. Market size and forecast, by End-Use Industry
- 7.3.5.6. Rest of Europe
- 7.3.5.6.1. Market size and forecast, by Type
- 7.3.5.6.2. Market size and forecast, by Application
- 7.3.5.6.3. Market size and forecast, by End-Use Industry
- 7.4. Asia-Pacific
- 7.4.1. Key market trends, growth factors and opportunities
- 7.4.2. Market size and forecast, by Type
- 7.4.3. Market size and forecast, by Application
- 7.4.4. Market size and forecast, by End-Use Industry
- 7.4.5. Market size and forecast, by country
- 7.4.5.1. China
- 7.4.5.1.1. Market size and forecast, by Type
- 7.4.5.1.2. Market size and forecast, by Application
- 7.4.5.1.3. Market size and forecast, by End-Use Industry
- 7.4.5.2. Japan
- 7.4.5.2.1. Market size and forecast, by Type
- 7.4.5.2.2. Market size and forecast, by Application
- 7.4.5.2.3. Market size and forecast, by End-Use Industry
- 7.4.5.3. India
- 7.4.5.3.1. Market size and forecast, by Type
- 7.4.5.3.2. Market size and forecast, by Application
- 7.4.5.3.3. Market size and forecast, by End-Use Industry
- 7.4.5.4. South Korea
- 7.4.5.4.1. Market size and forecast, by Type
- 7.4.5.4.2. Market size and forecast, by Application
- 7.4.5.4.3. Market size and forecast, by End-Use Industry
- 7.4.5.5. Australia
- 7.4.5.5.1. Market size and forecast, by Type
- 7.4.5.5.2. Market size and forecast, by Application
- 7.4.5.5.3. Market size and forecast, by End-Use Industry
- 7.4.5.6. Rest of Asia-Pacific
- 7.4.5.6.1. Market size and forecast, by Type
- 7.4.5.6.2. Market size and forecast, by Application
- 7.4.5.6.3. Market size and forecast, by End-Use Industry
- 7.5. LAMEA
- 7.5.1. Key market trends, growth factors and opportunities
- 7.5.2. Market size and forecast, by Type
- 7.5.3. Market size and forecast, by Application
- 7.5.4. Market size and forecast, by End-Use Industry
- 7.5.5. Market size and forecast, by country
- 7.5.5.1. Brazil
- 7.5.5.1.1. Market size and forecast, by Type
- 7.5.5.1.2. Market size and forecast, by Application
- 7.5.5.1.3. Market size and forecast, by End-Use Industry
- 7.5.5.2. South Africa
- 7.5.5.2.1. Market size and forecast, by Type
- 7.5.5.2.2. Market size and forecast, by Application
- 7.5.5.2.3. Market size and forecast, by End-Use Industry
- 7.5.5.3. Saudi Arabia
- 7.5.5.3.1. Market size and forecast, by Type
- 7.5.5.3.2. Market size and forecast, by Application
- 7.5.5.3.3. Market size and forecast, by End-Use Industry
- 7.5.5.4. Rest of LAMEA
- 7.5.5.4.1. Market size and forecast, by Type
- 7.5.5.4.2. Market size and forecast, by Application
- 7.5.5.4.3. Market size and forecast, by End-Use Industry
CHAPTER 8: COMPETITIVE LANDSCAPE
- 8.1. Introduction
- 8.2. Top winning strategies
- 8.3. Product mapping of top 10 player
- 8.4. Competitive dashboard
- 8.5. Competitive heatmap
- 8.6. Top player positioning, 2022
CHAPTER 9: COMPANY PROFILES
- 9.1. Arkema
- 9.1.1. Company overview
- 9.1.2. Key executives
- 9.1.3. Company snapshot
- 9.1.4. Operating business segments
- 9.1.5. Product portfolio
- 9.1.6. Business performance
- 9.1.7. Key strategic moves and developments
- 9.2. BASF SE
- 9.2.1. Company overview
- 9.2.2. Key executives
- 9.2.3. Company snapshot
- 9.2.4. Operating business segments
- 9.2.5. Product portfolio
- 9.2.6. Business performance
- 9.2.7. Key strategic moves and developments
- 9.3. The Lubrizol Corporation
- 9.3.1. Company overview
- 9.3.2. Key executives
- 9.3.3. Company snapshot
- 9.3.4. Operating business segments
- 9.3.5. Product portfolio
- 9.3.6. Business performance
- 9.3.7. Key strategic moves and developments
- 9.4. Dow Inc.
- 9.4.1. Company overview
- 9.4.2. Key executives
- 9.4.3. Company snapshot
- 9.4.4. Operating business segments
- 9.4.5. Product portfolio
- 9.4.6. Business performance
- 9.4.7. Key strategic moves and developments
- 9.5. Maxwell Additives Pvt. Ltd.
- 9.5.1. Company overview
- 9.5.2. Key executives
- 9.5.3. Company snapshot
- 9.5.4. Operating business segments
- 9.5.5. Product portfolio
- 9.5.6. Business performance
- 9.5.7. Key strategic moves and developments
- 9.6. Nippon Shokubai Co. Ltd.
- 9.6.1. Company overview
- 9.6.2. Key executives
- 9.6.3. Company snapshot
- 9.6.4. Operating business segments
- 9.6.5. Product portfolio
- 9.6.6. Business performance
- 9.6.7. Key strategic moves and developments
- 9.7. Ashland Inc.
- 9.7.1. Company overview
- 9.7.2. Key executives
- 9.7.3. Company snapshot
- 9.7.4. Operating business segments
- 9.7.5. Product portfolio
- 9.7.6. Business performance
- 9.7.7. Key strategic moves and developments
- 9.8. ACURO ORGANICS LIMITED
- 9.8.1. Company overview
- 9.8.2. Key executives
- 9.8.3. Company snapshot
- 9.8.4. Operating business segments
- 9.8.5. Product portfolio
- 9.8.6. Business performance
- 9.8.7. Key strategic moves and developments
- 9.9. Evonik Industries AG
- 9.9.1. Company overview
- 9.9.2. Key executives
- 9.9.3. Company snapshot
- 9.9.4. Operating business segments
- 9.9.5. Product portfolio
- 9.9.6. Business performance
- 9.9.7. Key strategic moves and developments
- 9.10. Sumitomo Seika Chemicals
- 9.10.1. Company overview
- 9.10.2. Key executives
- 9.10.3. Company snapshot
- 9.10.4. Operating business segments
- 9.10.5. Product portfolio
- 9.10.6. Business performance
- 9.10.7. Key strategic moves and developments
LIST OF TABLES
- TABLE 01. GLOBAL POLYACRYLIC ACID MARKET, BY TYPE, 2022-2032 ($MILLION)
- TABLE 02. GLOBAL POLYACRYLIC ACID MARKET, BY TYPE, 2022-2032 (KILOTON)
- TABLE 03. POLYACRYLIC ACID MARKET FOR SYNTHETIC, BY REGION, 2022-2032 ($MILLION)
- TABLE 04. POLYACRYLIC ACID MARKET FOR SYNTHETIC, BY REGION, 2022-2032 (KILOTON)
- TABLE 05. POLYACRYLIC ACID MARKET FOR BIO-BASED, BY REGION, 2022-2032 ($MILLION)
- TABLE 06. POLYACRYLIC ACID MARKET FOR BIO-BASED, BY REGION, 2022-2032 (KILOTON)
- TABLE 07. GLOBAL POLYACRYLIC ACID MARKET, BY APPLICATION, 2022-2032 ($MILLION)
- TABLE 08. GLOBAL POLYACRYLIC ACID MARKET, BY APPLICATION, 2022-2032 (KILOTON)
- TABLE 09. POLYACRYLIC ACID MARKET FOR THICKENERS, BY REGION, 2022-2032 ($MILLION)
- TABLE 10. POLYACRYLIC ACID MARKET FOR THICKENERS, BY REGION, 2022-2032 (KILOTON)
- TABLE 11. POLYACRYLIC ACID MARKET FOR DISPERSANT, BY REGION, 2022-2032 ($MILLION)
- TABLE 12. POLYACRYLIC ACID MARKET FOR DISPERSANT, BY REGION, 2022-2032 (KILOTON)
- TABLE 13. POLYACRYLIC ACID MARKET FOR SCALE INHIBITOR, BY REGION, 2022-2032 ($MILLION)
- TABLE 14. POLYACRYLIC ACID MARKET FOR SCALE INHIBITOR, BY REGION, 2022-2032 (KILOTON)
- TABLE 15. POLYACRYLIC ACID MARKET FOR EMULSIFIERS, BY REGION, 2022-2032 ($MILLION)
- TABLE 16. POLYACRYLIC ACID MARKET FOR EMULSIFIERS, BY REGION, 2022-2032 (KILOTON)
- TABLE 17. POLYACRYLIC ACID MARKET FOR BINDERS, BY REGION, 2022-2032 ($MILLION)
- TABLE 18. POLYACRYLIC ACID MARKET FOR BINDERS, BY REGION, 2022-2032 (KILOTON)
- TABLE 19. POLYACRYLIC ACID MARKET FOR OTHERS, BY REGION, 2022-2032 ($MILLION)
- TABLE 20. POLYACRYLIC ACID MARKET FOR OTHERS, BY REGION, 2022-2032 (KILOTON)
- TABLE 21. GLOBAL POLYACRYLIC ACID MARKET, BY END-USE INDUSTRY, 2022-2032 ($MILLION)
- TABLE 22. GLOBAL POLYACRYLIC ACID MARKET, BY END-USE INDUSTRY, 2022-2032 (KILOTON)
- TABLE 23. POLYACRYLIC ACID MARKET FOR CONSTRUCTION, BY REGION, 2022-2032 ($MILLION)
- TABLE 24. POLYACRYLIC ACID MARKET FOR CONSTRUCTION, BY REGION, 2022-2032 (KILOTON)
- TABLE 25. POLYACRYLIC ACID MARKET FOR PAINTS AND COATINGS, BY REGION, 2022-2032 ($MILLION)
- TABLE 26. POLYACRYLIC ACID MARKET FOR PAINTS AND COATINGS, BY REGION, 2022-2032 (KILOTON)
- TABLE 27. POLYACRYLIC ACID MARKET FOR PULP AND PAPER, BY REGION, 2022-2032 ($MILLION)
- TABLE 28. POLYACRYLIC ACID MARKET FOR PULP AND PAPER, BY REGION, 2022-2032 (KILOTON)
- TABLE 29. POLYACRYLIC ACID MARKET FOR ADHESIVES AND SEALANTS, BY REGION, 2022-2032 ($MILLION)
- TABLE 30. POLYACRYLIC ACID MARKET FOR ADHESIVES AND SEALANTS, BY REGION, 2022-2032 (KILOTON)
- TABLE 31. POLYACRYLIC ACID MARKET FOR WATER TREATMENT, BY REGION, 2022-2032 ($MILLION)
- TABLE 32. POLYACRYLIC ACID MARKET FOR WATER TREATMENT, BY REGION, 2022-2032 (KILOTON)
- TABLE 33. POLYACRYLIC ACID MARKET FOR PHARMACEUTICALS, BY REGION, 2022-2032 ($MILLION)
- TABLE 34. POLYACRYLIC ACID MARKET FOR PHARMACEUTICALS, BY REGION, 2022-2032 (KILOTON)
- TABLE 35. POLYACRYLIC ACID MARKET FOR COSMETICS, BY REGION, 2022-2032 ($MILLION)
- TABLE 36. POLYACRYLIC ACID MARKET FOR COSMETICS, BY REGION, 2022-2032 (KILOTON)
- TABLE 37. POLYACRYLIC ACID MARKET FOR OTHERS, BY REGION, 2022-2032 ($MILLION)
- TABLE 38. POLYACRYLIC ACID MARKET FOR OTHERS, BY REGION, 2022-2032 (KILOTON)
- TABLE 39. POLYACRYLIC ACID MARKET, BY REGION, 2022-2032 ($MILLION)
- TABLE 40. POLYACRYLIC ACID MARKET, BY REGION, 2022-2032 (KILOTON)
- TABLE 41. NORTH AMERICA POLYACRYLIC ACID MARKET, BY TYPE, 2022-2032 ($MILLION)
- TABLE 42. NORTH AMERICA POLYACRYLIC ACID MARKET, BY TYPE, 2022-2032 (KILOTON)
- TABLE 43. NORTH AMERICA POLYACRYLIC ACID MARKET, BY APPLICATION, 2022-2032 ($MILLION)
- TABLE 44. NORTH AMERICA POLYACRYLIC ACID MARKET, BY APPLICATION, 2022-2032 (KILOTON)
- TABLE 45. NORTH AMERICA POLYACRYLIC ACID MARKET, BY END-USE INDUSTRY, 2022-2032 ($MILLION)
- TABLE 46. NORTH AMERICA POLYACRYLIC ACID MARKET, BY END-USE INDUSTRY, 2022-2032 (KILOTON)
- TABLE 47. NORTH AMERICA POLYACRYLIC ACID MARKET, BY COUNTRY, 2022-2032 ($MILLION)
- TABLE 48. NORTH AMERICA POLYACRYLIC ACID MARKET, BY COUNTRY, 2022-2032 (KILOTON)
- TABLE 49. U.S. POLYACRYLIC ACID MARKET, BY TYPE, 2022-2032 ($MILLION)
- TABLE 50. U.S. POLYACRYLIC ACID MARKET, BY TYPE, 2022-2032 (KILOTON)
- TABLE 51. U.S. POLYACRYLIC ACID MARKET, BY APPLICATION, 2022-2032 ($MILLION)
- TABLE 52. U.S. POLYACRYLIC ACID MARKET, BY APPLICATION, 2022-2032 (KILOTON)
- TABLE 53. U.S. POLYACRYLIC ACID MARKET, BY END-USE INDUSTRY, 2022-2032 ($MILLION)
- TABLE 54. U.S. POLYACRYLIC ACID MARKET, BY END-USE INDUSTRY, 2022-2032 (KILOTON)
- TABLE 55. CANADA POLYACRYLIC ACID MARKET, BY TYPE, 2022-2032 ($MILLION)
- TABLE 56. CANADA POLYACRYLIC ACID MARKET, BY TYPE, 2022-2032 (KILOTON)
- TABLE 57. CANADA POLYACRYLIC ACID MARKET, BY APPLICATION, 2022-2032 ($MILLION)
- TABLE 58. CANADA POLYACRYLIC ACID MARKET, BY APPLICATION, 2022-2032 (KILOTON)
- TABLE 59. CANADA POLYACRYLIC ACID MARKET, BY END-USE INDUSTRY, 2022-2032 ($MILLION)
- TABLE 60. CANADA POLYACRYLIC ACID MARKET, BY END-USE INDUSTRY, 2022-2032 (KILOTON)
- TABLE 61. MEXICO POLYACRYLIC ACID MARKET, BY TYPE, 2022-2032 ($MILLION)
- TABLE 62. MEXICO POLYACRYLIC ACID MARKET, BY TYPE, 2022-2032 (KILOTON)
- TABLE 63. MEXICO POLYACRYLIC ACID MARKET, BY APPLICATION, 2022-2032 ($MILLION)
- TABLE 64. MEXICO POLYACRYLIC ACID MARKET, BY APPLICATION, 2022-2032 (KILOTON)
- TABLE 65. MEXICO POLYACRYLIC ACID MARKET, BY END-USE INDUSTRY, 2022-2032 ($MILLION)
- TABLE 66. MEXICO POLYACRYLIC ACID MARKET, BY END-USE INDUSTRY, 2022-2032 (KILOTON)
- TABLE 67. EUROPE POLYACRYLIC ACID MARKET, BY TYPE, 2022-2032 ($MILLION)
- TABLE 68. EUROPE POLYACRYLIC ACID MARKET, BY TYPE, 2022-2032 (KILOTON)
- TABLE 69. EUROPE POLYACRYLIC ACID MARKET, BY APPLICATION, 2022-2032 ($MILLION)
- TABLE 70. EUROPE POLYACRYLIC ACID MARKET, BY APPLICATION, 2022-2032 (KILOTON)
- TABLE 71. EUROPE POLYACRYLIC ACID MARKET, BY END-USE INDUSTRY, 2022-2032 ($MILLION)
- TABLE 72. EUROPE POLYACRYLIC ACID MARKET, BY END-USE INDUSTRY, 2022-2032 (KILOTON)
- TABLE 73. EUROPE POLYACRYLIC ACID MARKET, BY COUNTRY, 2022-2032 ($MILLION)
- TABLE 74. EUROPE POLYACRYLIC ACID MARKET, BY COUNTRY, 2022-2032 (KILOTON)
- TABLE 75. GERMANY POLYACRYLIC ACID MARKET, BY TYPE, 2022-2032 ($MILLION)
- TABLE 76. GERMANY POLYACRYLIC ACID MARKET, BY TYPE, 2022-2032 (KILOTON)
- TABLE 77. GERMANY POLYACRYLIC ACID MARKET, BY APPLICATION, 2022-2032 ($MILLION)
- TABLE 78. GERMANY POLYACRYLIC ACID MARKET, BY APPLICATION, 2022-2032 (KILOTON)
- TABLE 79. GERMANY POLYACRYLIC ACID MARKET, BY END-USE INDUSTRY, 2022-2032 ($MILLION)
- TABLE 80. GERMANY POLYACRYLIC ACID MARKET, BY END-USE INDUSTRY, 2022-2032 (KILOTON)
- TABLE 81. FRANCE POLYACRYLIC ACID MARKET, BY TYPE, 2022-2032 ($MILLION)
- TABLE 82. FRANCE POLYACRYLIC ACID MARKET, BY TYPE, 2022-2032 (KILOTON)
- TABLE 83. FRANCE POLYACRYLIC ACID MARKET, BY APPLICATION, 2022-2032 ($MILLION)
- TABLE 84. FRANCE POLYACRYLIC ACID MARKET, BY APPLICATION, 2022-2032 (KILOTON)
- TABLE 85. FRANCE POLYACRYLIC ACID MARKET, BY END-USE INDUSTRY, 2022-2032 ($MILLION)
- TABLE 86. FRANCE POLYACRYLIC ACID MARKET, BY END-USE INDUSTRY, 2022-2032 (KILOTON)
- TABLE 87. UK POLYACRYLIC ACID MARKET, BY TYPE, 2022-2032 ($MILLION)
- TABLE 88. UK POLYACRYLIC ACID MARKET, BY TYPE, 2022-2032 (KILOTON)
- TABLE 89. UK POLYACRYLIC ACID MARKET, BY APPLICATION, 2022-2032 ($MILLION)
- TABLE 90. UK POLYACRYLIC ACID MARKET, BY APPLICATION, 2022-2032 (KILOTON)
- TABLE 91. UK POLYACRYLIC ACID MARKET, BY END-USE INDUSTRY, 2022-2032 ($MILLION)
- TABLE 92. UK POLYACRYLIC ACID MARKET, BY END-USE INDUSTRY, 2022-2032 (KILOTON)
- TABLE 93. SPAIN POLYACRYLIC ACID MARKET, BY TYPE, 2022-2032 ($MILLION)
- TABLE 94. SPAIN POLYACRYLIC ACID MARKET, BY TYPE, 2022-2032 (KILOTON)
- TABLE 95. SPAIN POLYACRYLIC ACID MARKET, BY APPLICATION, 2022-2032 ($MILLION)
- TABLE 96. SPAIN POLYACRYLIC ACID MARKET, BY APPLICATION, 2022-2032 (KILOTON)
- TABLE 97. SPAIN POLYACRYLIC ACID MARKET, BY END-USE INDUSTRY, 2022-2032 ($MILLION)
- TABLE 98. SPAIN POLYACRYLIC ACID MARKET, BY END-USE INDUSTRY, 2022-2032 (KILOTON)
- TABLE 99. ITALY POLYACRYLIC ACID MARKET, BY TYPE, 2022-2032 ($MILLION)
- TABLE 100. ITALY POLYACRYLIC ACID MARKET, BY TYPE, 2022-2032 (KILOTON)
- TABLE 101. ITALY POLYACRYLIC ACID MARKET, BY APPLICATION, 2022-2032 ($MILLION)
- TABLE 102. ITALY POLYACRYLIC ACID MARKET, BY APPLICATION, 2022-2032 (KILOTON)
- TABLE 103. ITALY POLYACRYLIC ACID MARKET, BY END-USE INDUSTRY, 2022-2032 ($MILLION)
- TABLE 104. ITALY POLYACRYLIC ACID MARKET, BY END-USE INDUSTRY, 2022-2032 (KILOTON)
- TABLE 105. REST OF EUROPE POLYACRYLIC ACID MARKET, BY TYPE, 2022-2032 ($MILLION)
- TABLE 106. REST OF EUROPE POLYACRYLIC ACID MARKET, BY TYPE, 2022-2032 (KILOTON)
- TABLE 107. REST OF EUROPE POLYACRYLIC ACID MARKET, BY APPLICATION, 2022-2032 ($MILLION)
- TABLE 108. REST OF EUROPE POLYACRYLIC ACID MARKET, BY APPLICATION, 2022-2032 (KILOTON)
- TABLE 109. REST OF EUROPE POLYACRYLIC ACID MARKET, BY END-USE INDUSTRY, 2022-2032 ($MILLION)
- TABLE 110. REST OF EUROPE POLYACRYLIC ACID MARKET, BY END-USE INDUSTRY, 2022-2032 (KILOTON)
- TABLE 111. ASIA-PACIFIC POLYACRYLIC ACID MARKET, BY TYPE, 2022-2032 ($MILLION)
- TABLE 112. ASIA-PACIFIC POLYACRYLIC ACID MARKET, BY TYPE, 2022-2032 (KILOTON)
- TABLE 113. ASIA-PACIFIC POLYACRYLIC ACID MARKET, BY APPLICATION, 2022-2032 ($MILLION)
- TABLE 114. ASIA-PACIFIC POLYACRYLIC ACID MARKET, BY APPLICATION, 2022-2032 (KILOTON)
- TABLE 115. ASIA-PACIFIC POLYACRYLIC ACID MARKET, BY END-USE INDUSTRY, 2022-2032 ($MILLION)
- TABLE 116. ASIA-PACIFIC POLYACRYLIC ACID MARKET, BY END-USE INDUSTRY, 2022-2032 (KILOTON)
- TABLE 117. ASIA-PACIFIC POLYACRYLIC ACID MARKET, BY COUNTRY, 2022-2032 ($MILLION)
- TABLE 118. ASIA-PACIFIC POLYACRYLIC ACID MARKET, BY COUNTRY, 2022-2032 (KILOTON)
- TABLE 119. CHINA POLYACRYLIC ACID MARKET, BY TYPE, 2022-2032 ($MILLION)
- TABLE 120. CHINA POLYACRYLIC ACID MARKET, BY TYPE, 2022-2032 (KILOTON)
- TABLE 121. CHINA POLYACRYLIC ACID MARKET, BY APPLICATION, 2022-2032 ($MILLION)
- TABLE 122. CHINA POLYACRYLIC ACID MARKET, BY APPLICATION, 2022-2032 (KILOTON)
- TABLE 123. CHINA POLYACRYLIC ACID MARKET, BY END-USE INDUSTRY, 2022-2032 ($MILLION)
- TABLE 124. CHINA POLYACRYLIC ACID MARKET, BY END-USE INDUSTRY, 2022-2032 (KILOTON)
- TABLE 125. JAPAN POLYACRYLIC ACID MARKET, BY TYPE, 2022-2032 ($MILLION)
- TABLE 126. JAPAN POLYACRYLIC ACID MARKET, BY TYPE, 2022-2032 (KILOTON)
- TABLE 127. JAPAN POLYACRYLIC ACID MARKET, BY APPLICATION, 2022-2032 ($MILLION)
- TABLE 128. JAPAN POLYACRYLIC ACID MARKET, BY APPLICATION, 2022-2032 (KILOTON)
- TABLE 129. JAPAN POLYACRYLIC ACID MARKET, BY END-USE INDUSTRY, 2022-2032 ($MILLION)
- TABLE 130. JAPAN POLYACRYLIC ACID MARKET, BY END-USE INDUSTRY, 2022-2032 (KILOTON)
- TABLE 131. INDIA POLYACRYLIC ACID MARKET, BY TYPE, 2022-2032 ($MILLION)
- TABLE 132. INDIA POLYACRYLIC ACID MARKET, BY TYPE, 2022-2032 (KILOTON)
- TABLE 133. INDIA POLYACRYLIC ACID MARKET, BY APPLICATION, 2022-2032 ($MILLION)
- TABLE 134. INDIA POLYACRYLIC ACID MARKET, BY APPLICATION, 2022-2032 (KILOTON)
- TABLE 135. INDIA POLYACRYLIC ACID MARKET, BY END-USE INDUSTRY, 2022-2032 ($MILLION)
- TABLE 136. INDIA POLYACRYLIC ACID MARKET, BY END-USE INDUSTRY, 2022-2032 (KILOTON)
- TABLE 137. SOUTH KOREA POLYACRYLIC ACID MARKET, BY TYPE, 2022-2032 ($MILLION)
- TABLE 138. SOUTH KOREA POLYACRYLIC ACID MARKET, BY TYPE, 2022-2032 (KILOTON)
- TABLE 139. SOUTH KOREA POLYACRYLIC ACID MARKET, BY APPLICATION, 2022-2032 ($MILLION)
- TABLE 140. SOUTH KOREA POLYACRYLIC ACID MARKET, BY APPLICATION, 2022-2032 (KILOTON)
- TABLE 141. SOUTH KOREA POLYACRYLIC ACID MARKET, BY END-USE INDUSTRY, 2022-2032 ($MILLION)
- TABLE 142. SOUTH KOREA POLYACRYLIC ACID MARKET, BY END-USE INDUSTRY, 2022-2032 (KILOTON)
- TABLE 143. AUSTRALIA POLYACRYLIC ACID MARKET, BY TYPE, 2022-2032 ($MILLION)
- TABLE 144. AUSTRALIA POLYACRYLIC ACID MARKET, BY TYPE, 2022-2032 (KILOTON)
- TABLE 145. AUSTRALIA POLYACRYLIC ACID MARKET, BY APPLICATION, 2022-2032 ($MILLION)
- TABLE 146. AUSTRALIA POLYACRYLIC ACID MARKET, BY APPLICATION, 2022-2032 (KILOTON)
- TABLE 147. AUSTRALIA POLYACRYLIC ACID MARKET, BY END-USE INDUSTRY, 2022-2032 ($MILLION)
- TABLE 148. AUSTRALIA POLYACRYLIC ACID MARKET, BY END-USE INDUSTRY, 2022-2032 (KILOTON)
- TABLE 149. REST OF ASIA-PACIFIC POLYACRYLIC ACID MARKET, BY TYPE, 2022-2032 ($MILLION)
- TABLE 150. REST OF ASIA-PACIFIC POLYACRYLIC ACID MARKET, BY TYPE, 2022-2032 (KILOTON)
- TABLE 151. REST OF ASIA-PACIFIC POLYACRYLIC ACID MARKET, BY APPLICATION, 2022-2032 ($MILLION)
- TABLE 152. REST OF ASIA-PACIFIC POLYACRYLIC ACID MARKET, BY APPLICATION, 2022-2032 (KILOTON)
- TABLE 153. REST OF ASIA-PACIFIC POLYACRYLIC ACID MARKET, BY END-USE INDUSTRY, 2022-2032 ($MILLION)
- TABLE 154. REST OF ASIA-PACIFIC POLYACRYLIC ACID MARKET, BY END-USE INDUSTRY, 2022-2032 (KILOTON)
- TABLE 155. LAMEA POLYACRYLIC ACID MARKET, BY TYPE, 2022-2032 ($MILLION)
- TABLE 156. LAMEA POLYACRYLIC ACID MARKET, BY TYPE, 2022-2032 (KILOTON)
- TABLE 157. LAMEA POLYACRYLIC ACID MARKET, BY APPLICATION, 2022-2032 ($MILLION)
- TABLE 158. LAMEA POLYACRYLIC ACID MARKET, BY APPLICATION, 2022-2032 (KILOTON)
- TABLE 159. LAMEA POLYACRYLIC ACID MARKET, BY END-USE INDUSTRY, 2022-2032 ($MILLION)
- TABLE 160. LAMEA POLYACRYLIC ACID MARKET, BY END-USE INDUSTRY, 2022-2032 (KILOTON)
- TABLE 161. LAMEA POLYACRYLIC ACID MARKET, BY COUNTRY, 2022-2032 ($MILLION)
- TABLE 162. LAMEA POLYACRYLIC ACID MARKET, BY COUNTRY, 2022-2032 (KILOTON)
- TABLE 163. BRAZIL POLYACRYLIC ACID MARKET, BY TYPE, 2022-2032 ($MILLION)
- TABLE 164. BRAZIL POLYACRYLIC ACID MARKET, BY TYPE, 2022-2032 (KILOTON)
- TABLE 165. BRAZIL POLYACRYLIC ACID MARKET, BY APPLICATION, 2022-2032 ($MILLION)
- TABLE 166. BRAZIL POLYACRYLIC ACID MARKET, BY APPLICATION, 2022-2032 (KILOTON)
- TABLE 167. BRAZIL POLYACRYLIC ACID MARKET, BY END-USE INDUSTRY, 2022-2032 ($MILLION)
- TABLE 168. BRAZIL POLYACRYLIC ACID MARKET, BY END-USE INDUSTRY, 2022-2032 (KILOTON)
- TABLE 169. SOUTH AFRICA POLYACRYLIC ACID MARKET, BY TYPE, 2022-2032 ($MILLION)
- TABLE 170. SOUTH AFRICA POLYACRYLIC ACID MARKET, BY TYPE, 2022-2032 (KILOTON)
- TABLE 171. SOUTH AFRICA POLYACRYLIC ACID MARKET, BY APPLICATION, 2022-2032 ($MILLION)
- TABLE 172. SOUTH AFRICA POLYACRYLIC ACID MARKET, BY APPLICATION, 2022-2032 (KILOTON)
- TABLE 173. SOUTH AFRICA POLYACRYLIC ACID MARKET, BY END-USE INDUSTRY, 2022-2032 ($MILLION)
- TABLE 174. SOUTH AFRICA POLYACRYLIC ACID MARKET, BY END-USE INDUSTRY, 2022-2032 (KILOTON)
- TABLE 175. SAUDI ARABIA POLYACRYLIC ACID MARKET, BY TYPE, 2022-2032 ($MILLION)
- TABLE 176. SAUDI ARABIA POLYACRYLIC ACID MARKET, BY TYPE, 2022-2032 (KILOTON)
- TABLE 177. SAUDI ARABIA POLYACRYLIC ACID MARKET, BY APPLICATION, 2022-2032 ($MILLION)
- TABLE 178. SAUDI ARABIA POLYACRYLIC ACID MARKET, BY APPLICATION, 2022-2032 (KILOTON)
- TABLE 179. SAUDI ARABIA POLYACRYLIC ACID MARKET, BY END-USE INDUSTRY, 2022-2032 ($MILLION)
- TABLE 180. SAUDI ARABIA POLYACRYLIC ACID MARKET, BY END-USE INDUSTRY, 2022-2032 (KILOTON)
- TABLE 181. REST OF LAMEA POLYACRYLIC ACID MARKET, BY TYPE, 2022-2032 ($MILLION)
- TABLE 182. REST OF LAMEA POLYACRYLIC ACID MARKET, BY TYPE, 2022-2032 (KILOTON)
- TABLE 183. REST OF LAMEA POLYACRYLIC ACID MARKET, BY APPLICATION, 2022-2032 ($MILLION)
- TABLE 184. REST OF LAMEA POLYACRYLIC ACID MARKET, BY APPLICATION, 2022-2032 (KILOTON)
- TABLE 185. REST OF LAMEA POLYACRYLIC ACID MARKET, BY END-USE INDUSTRY, 2022-2032 ($MILLION)
- TABLE 186. REST OF LAMEA POLYACRYLIC ACID MARKET, BY END-USE INDUSTRY, 2022-2032 (KILOTON)
- TABLE 187. ARKEMA: KEY EXECUTIVES
- TABLE 188. ARKEMA: COMPANY SNAPSHOT
- TABLE 189. ARKEMA: PRODUCT SEGMENTS
- TABLE 190. ARKEMA: SERVICE SEGMENTS
- TABLE 191. ARKEMA: PRODUCT PORTFOLIO
- TABLE 192. ARKEMA: KEY STRATERGIES
- TABLE 193. BASF SE: KEY EXECUTIVES
- TABLE 194. BASF SE: COMPANY SNAPSHOT
- TABLE 195. BASF SE: PRODUCT SEGMENTS
- TABLE 196. BASF SE: SERVICE SEGMENTS
- TABLE 197. BASF SE: PRODUCT PORTFOLIO
- TABLE 198. BASF SE: KEY STRATERGIES
- TABLE 199. THE LUBRIZOL CORPORATION: KEY EXECUTIVES
- TABLE 200. THE LUBRIZOL CORPORATION: COMPANY SNAPSHOT
- TABLE 201. THE LUBRIZOL CORPORATION: PRODUCT SEGMENTS
- TABLE 202. THE LUBRIZOL CORPORATION: SERVICE SEGMENTS
- TABLE 203. THE LUBRIZOL CORPORATION: PRODUCT PORTFOLIO
- TABLE 204. THE LUBRIZOL CORPORATION: KEY STRATERGIES
- TABLE 205. DOW INC.: KEY EXECUTIVES
- TABLE 206. DOW INC.: COMPANY SNAPSHOT
- TABLE 207. DOW INC.: PRODUCT SEGMENTS
- TABLE 208. DOW INC.: SERVICE SEGMENTS
- TABLE 209. DOW INC.: PRODUCT PORTFOLIO
- TABLE 210. DOW INC.: KEY STRATERGIES
- TABLE 211. MAXWELL ADDITIVES PVT. LTD.: KEY EXECUTIVES
- TABLE 212. MAXWELL ADDITIVES PVT. LTD.: COMPANY SNAPSHOT
- TABLE 213. MAXWELL ADDITIVES PVT. LTD.: PRODUCT SEGMENTS
- TABLE 214. MAXWELL ADDITIVES PVT. LTD.: SERVICE SEGMENTS
- TABLE 215. MAXWELL ADDITIVES PVT. LTD.: PRODUCT PORTFOLIO
- TABLE 216. MAXWELL ADDITIVES PVT. LTD.: KEY STRATERGIES
- TABLE 217. NIPPON SHOKUBAI CO. LTD.: KEY EXECUTIVES
- TABLE 218. NIPPON SHOKUBAI CO. LTD.: COMPANY SNAPSHOT
- TABLE 219. NIPPON SHOKUBAI CO. LTD.: PRODUCT SEGMENTS
- TABLE 220. NIPPON SHOKUBAI CO. LTD.: SERVICE SEGMENTS
- TABLE 221. NIPPON SHOKUBAI CO. LTD.: PRODUCT PORTFOLIO
- TABLE 222. NIPPON SHOKUBAI CO. LTD.: KEY STRATERGIES
- TABLE 223. ASHLAND INC.: KEY EXECUTIVES
- TABLE 224. ASHLAND INC.: COMPANY SNAPSHOT
- TABLE 225. ASHLAND INC.: PRODUCT SEGMENTS
- TABLE 226. ASHLAND INC.: SERVICE SEGMENTS
- TABLE 227. ASHLAND INC.: PRODUCT PORTFOLIO
- TABLE 228. ASHLAND INC.: KEY STRATERGIES
- TABLE 229. ACURO ORGANICS LIMITED: KEY EXECUTIVES
- TABLE 230. ACURO ORGANICS LIMITED: COMPANY SNAPSHOT
- TABLE 231. ACURO ORGANICS LIMITED: PRODUCT SEGMENTS
- TABLE 232. ACURO ORGANICS LIMITED: SERVICE SEGMENTS
- TABLE 233. ACURO ORGANICS LIMITED: PRODUCT PORTFOLIO
- TABLE 234. ACURO ORGANICS LIMITED: KEY STRATERGIES
- TABLE 235. EVONIK INDUSTRIES AG: KEY EXECUTIVES
- TABLE 236. EVONIK INDUSTRIES AG: COMPANY SNAPSHOT
- TABLE 237. EVONIK INDUSTRIES AG: PRODUCT SEGMENTS
- TABLE 238. EVONIK INDUSTRIES AG: SERVICE SEGMENTS
- TABLE 239. EVONIK INDUSTRIES AG: PRODUCT PORTFOLIO
- TABLE 240. EVONIK INDUSTRIES AG: KEY STRATERGIES
- TABLE 241. SUMITOMO SEIKA CHEMICALS: KEY EXECUTIVES
- TABLE 242. SUMITOMO SEIKA CHEMICALS: COMPANY SNAPSHOT
- TABLE 243. SUMITOMO SEIKA CHEMICALS: PRODUCT SEGMENTS
- TABLE 244. SUMITOMO SEIKA CHEMICALS: SERVICE SEGMENTS
- TABLE 245. SUMITOMO SEIKA CHEMICALS: PRODUCT PORTFOLIO
- TABLE 246. SUMITOMO SEIKA CHEMICALS: KEY STRATERGIES
LIST OF FIGURES
- FIGURE 01. POLYACRYLIC ACID MARKET, 2022-2032
- FIGURE 02. SEGMENTATION OF POLYACRYLIC ACID MARKET,2022-2032
- FIGURE 03. TOP IMPACTING FACTORS IN POLYACRYLIC ACID MARKET
- FIGURE 04. TOP INVESTMENT POCKETS IN POLYACRYLIC ACID MARKET (2023-2032)
- FIGURE 05. BARGAINING POWER OF SUPPLIERS
- FIGURE 06. BARGAINING POWER OF BUYERS
- FIGURE 07. THREAT OF SUBSTITUTION
- FIGURE 08. THREAT OF SUBSTITUTION
- FIGURE 09. COMPETITIVE RIVALRY
- FIGURE 10. GLOBAL POLYACRYLIC ACID MARKET:DRIVERS, RESTRAINTS AND OPPORTUNITIES
- FIGURE 11. PRICING ANALYSIS: POLYACRYLIC ACID MARKET 2022 AND 2032
- FIGURE 12. IMPACT OF KEY REGULATION: POLYACRYLIC ACID MARKET
- FIGURE 13. PATENT ANALYSIS BY COMPANY
- FIGURE 14. PATENT ANALYSIS BY COUNTRY
- FIGURE 15. POLYACRYLIC ACID MARKET, BY TYPE, 2022 AND 2032(%)
- FIGURE 16. COMPARATIVE SHARE ANALYSIS OF POLYACRYLIC ACID MARKET FOR SYNTHETIC, BY COUNTRY 2022 AND 2032(%)
- FIGURE 17. COMPARATIVE SHARE ANALYSIS OF POLYACRYLIC ACID MARKET FOR BIO-BASED, BY COUNTRY 2022 AND 2032(%)
- FIGURE 18. POLYACRYLIC ACID MARKET, BY APPLICATION, 2022 AND 2032(%)
- FIGURE 19. COMPARATIVE SHARE ANALYSIS OF POLYACRYLIC ACID MARKET FOR THICKENERS, BY COUNTRY 2022 AND 2032(%)
- FIGURE 20. COMPARATIVE SHARE ANALYSIS OF POLYACRYLIC ACID MARKET FOR DISPERSANT, BY COUNTRY 2022 AND 2032(%)
- FIGURE 21. COMPARATIVE SHARE ANALYSIS OF POLYACRYLIC ACID MARKET FOR SCALE INHIBITOR, BY COUNTRY 2022 AND 2032(%)
- FIGURE 22. COMPARATIVE SHARE ANALYSIS OF POLYACRYLIC ACID MARKET FOR EMULSIFIERS, BY COUNTRY 2022 AND 2032(%)
- FIGURE 23. COMPARATIVE SHARE ANALYSIS OF POLYACRYLIC ACID MARKET FOR BINDERS, BY COUNTRY 2022 AND 2032(%)
- FIGURE 24. COMPARATIVE SHARE ANALYSIS OF POLYACRYLIC ACID MARKET FOR OTHERS, BY COUNTRY 2022 AND 2032(%)
- FIGURE 25. POLYACRYLIC ACID MARKET, BY END-USE INDUSTRY, 2022 AND 2032(%)
- FIGURE 26. COMPARATIVE SHARE ANALYSIS OF POLYACRYLIC ACID MARKET FOR CONSTRUCTION, BY COUNTRY 2022 AND 2032(%)
- FIGURE 27. COMPARATIVE SHARE ANALYSIS OF POLYACRYLIC ACID MARKET FOR PAINTS AND COATINGS, BY COUNTRY 2022 AND 2032(%)
- FIGURE 28. COMPARATIVE SHARE ANALYSIS OF POLYACRYLIC ACID MARKET FOR PULP AND PAPER, BY COUNTRY 2022 AND 2032(%)
- FIGURE 29. COMPARATIVE SHARE ANALYSIS OF POLYACRYLIC ACID MARKET FOR ADHESIVES AND SEALANTS, BY COUNTRY 2022 AND 2032(%)
- FIGURE 30. COMPARATIVE SHARE ANALYSIS OF POLYACRYLIC ACID MARKET FOR WATER TREATMENT, BY COUNTRY 2022 AND 2032(%)
- FIGURE 31. COMPARATIVE SHARE ANALYSIS OF POLYACRYLIC ACID MARKET FOR PHARMACEUTICALS, BY COUNTRY 2022 AND 2032(%)
- FIGURE 32. COMPARATIVE SHARE ANALYSIS OF POLYACRYLIC ACID MARKET FOR COSMETICS, BY COUNTRY 2022 AND 2032(%)
- FIGURE 33. COMPARATIVE SHARE ANALYSIS OF POLYACRYLIC ACID MARKET FOR OTHERS, BY COUNTRY 2022 AND 2032(%)
- FIGURE 34. POLYACRYLIC ACID MARKET BY REGION, 2022 AND 2032(%)
- FIGURE 35. U.S. POLYACRYLIC ACID MARKET, 2022-2032 ($MILLION)
- FIGURE 36. CANADA POLYACRYLIC ACID MARKET, 2022-2032 ($MILLION)
- FIGURE 37. MEXICO POLYACRYLIC ACID MARKET, 2022-2032 ($MILLION)
- FIGURE 38. GERMANY POLYACRYLIC ACID MARKET, 2022-2032 ($MILLION)
- FIGURE 39. FRANCE POLYACRYLIC ACID MARKET, 2022-2032 ($MILLION)
- FIGURE 40. UK POLYACRYLIC ACID MARKET, 2022-2032 ($MILLION)
- FIGURE 41. SPAIN POLYACRYLIC ACID MARKET, 2022-2032 ($MILLION)
- FIGURE 42. ITALY POLYACRYLIC ACID MARKET, 2022-2032 ($MILLION)
- FIGURE 43. REST OF EUROPE POLYACRYLIC ACID MARKET, 2022-2032 ($MILLION)
- FIGURE 44. CHINA POLYACRYLIC ACID MARKET, 2022-2032 ($MILLION)
- FIGURE 45. JAPAN POLYACRYLIC ACID MARKET, 2022-2032 ($MILLION)
- FIGURE 46. INDIA POLYACRYLIC ACID MARKET, 2022-2032 ($MILLION)
- FIGURE 47. SOUTH KOREA POLYACRYLIC ACID MARKET, 2022-2032 ($MILLION)
- FIGURE 48. AUSTRALIA POLYACRYLIC ACID MARKET, 2022-2032 ($MILLION)
- FIGURE 49. REST OF ASIA-PACIFIC POLYACRYLIC ACID MARKET, 2022-2032 ($MILLION)
- FIGURE 50. BRAZIL POLYACRYLIC ACID MARKET, 2022-2032 ($MILLION)
- FIGURE 51. SOUTH AFRICA POLYACRYLIC ACID MARKET, 2022-2032 ($MILLION)
- FIGURE 52. SAUDI ARABIA POLYACRYLIC ACID MARKET, 2022-2032 ($MILLION)
- FIGURE 53. REST OF LAMEA POLYACRYLIC ACID MARKET, 2022-2032 ($MILLION)
- FIGURE 54. TOP WINNING STRATEGIES, BY YEAR
- FIGURE 55. TOP WINNING STRATEGIES, BY DEVELOPMENT
- FIGURE 56. TOP WINNING STRATEGIES, BY COMPANY
- FIGURE 57. PRODUCT MAPPING OF TOP 10 PLAYERS
- FIGURE 58. COMPETITIVE DASHBOARD
- FIGURE 59. COMPETITIVE HEATMAP: POLYACRYLIC ACID MARKET
- FIGURE 60. TOP PLAYER POSITIONING, 2022

