
PUBLISHER: Allied Market Research | PRODUCT CODE: 1472299

PUBLISHER: Allied Market Research | PRODUCT CODE: 1472299
Biogas Market By Source (Landfill Gas, Livestock Waste, Municipal Waste, Others), By Application (Power Generation, Co-Generation, Buildings, Others): Global Opportunity Analysis and Industry Forecast, 2023-2032
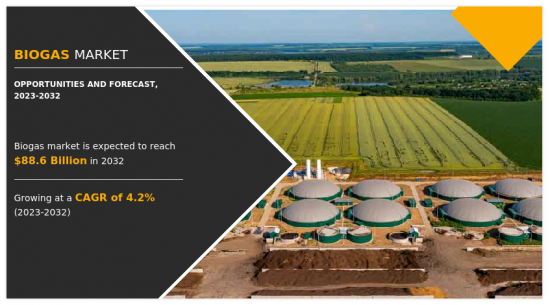
The biogas market was valued at $59.0 billion in 2022, and is estimated to reach $88.6 billion by 2032, growing at a CAGR of 4.2% from 2023 to 2032.
Biogas is a renewable energy source produced through the breakdown of organic matter in the absence of oxygen, a process known as anaerobic digestion. It primarily consists of methane and carbon dioxide, with trace amounts of other gases. Common feedstocks for biogas production include agricultural residues, animal manure, sewage, and food waste. Biogas can be used for electricity generation, heating, and as a vehicle fuel, making it a versatile and environmentally friendly energy source. Its production helps mitigate greenhouse gas emissions by capturing methane, a potent contributor to climate change, and converting organic waste into a valuable energy resource.
Waste management regulations play a crucial role in driving the growth of the biogas market by incentivizing the adoption of sustainable waste management practices. As governments around the globe implement stricter regulations to mitigate environmental pollution and reduce greenhouse gas emissions, there is increasing pressure on industries and municipalities to manage their organic waste more effectively. Biogas technology offers an environmentally friendly solution by converting organic waste materials, such as agricultural residues, food scraps, and sewage, into valuable renewable energy.
With waste management regulations mandating the diversion of organic waste from landfills and the reduction of methane emissions, biogas production becomes an attractive option for compliance. Biogas facilities can effectively treat organic waste, preventing it from decomposing in landfills and releasing methane, a potent greenhouse gas into the atmosphere. Moreover, biogas generation provides a sustainable alternative to fossil fuels, further reducing carbon emissions and contributing to climate change mitigation efforts. Biogas facilities can generate revenue through the sale of renewable energy and by-products, such as organic fertilizers. Therefore, waste management regulations serve as a driving force behind the expansion of the biogas market, fostering sustainable waste management practices and renewable energy production simultaneously.
Land use and feedstock availability constraints pose significant challenges to the growth of the biogas market. The availability of suitable feedstock, such as organic waste and agricultural residues, is essential for biogas production. However, competition for land resources between agriculture, urban development, and conservation efforts can limit the availability of feedstock for biogas projects. In regions with limited agricultural land or strict land-use regulations, sourcing adequate feedstock may be challenging, leading to constraints on biogas production capacity.
Moreover, the quality and quantity of feedstock can vary seasonally, depending on factors such as crop harvesting cycles and waste generation patterns. Inconsistent feedstock availability can impact the reliability and efficiency of biogas plants, affecting their economic viability and overall market growth. In addition, the transportation and logistics involved in collecting and delivering feedstock to biogas facilities can incur additional costs and logistical challenges, particularly in rural areas with dispersed sources of organic waste. Furthermore, competition for feedstock resources from other biomass-based industries, such as biofuels and bioenergy, further exacerbates feedstock availability constraints for biogas production. As demand for biomass increases across multiple sectors, securing a reliable and sustainable supply of feedstock becomes increasingly challenging.
The increasing demand for biogas-based transportation fuels presents lucrative opportunities for the biogas market. As the transportation sector seeks to reduce its carbon footprint and transition towards sustainable alternatives to conventional fossil fuels, biogas emerges as a promising solution. Biogas can be upgraded to biomethane, a high-purity methane gas, which can be used as a renewable transportation fuel in the form of compressed natural gas (CNG) or liquefied natural gas (LNG). Biomethane-powered vehicles offer significant environmental benefits, including lower greenhouse gas emissions and reduced air pollutants compared to gasoline or diesel-powered vehicles.
Moreover, the use of biogas-derived biomethane as a transportation fuel contributes to waste management by utilizing organic waste streams such as agricultural residues, food waste, and municipal solid waste as feedstock. This not only helps divert organic waste from landfills but also provides an additional revenue stream for waste producers through biogas production. In addition, biomethane can help enhance energy security by reducing dependency on imported fossil fuels, thus offering a sustainable and domestically produced alternative fuel source for transportation. Furthermore, incentives and policies promoting the adoption of renewable transportation fuels, along with increasing consumer awareness and acceptance of biomethane-powered vehicles, further drive the demand for biogas-based transportation fuels. As a result, the biogas market stands to benefit from the growing demand for sustainable transportation solutions, offering significant opportunities for investment and market growth.
The biogas market is segmented based on source, end-use industry, and region. As per source, the market is divided into municipal waste, animal waste, agricultural waste, and others. By end-use industry, it is categorized into electricity generation, cogeneration, and others. Region-wise, the market is studied across North America, Europe, Asia-Pacific, and LAMEA.
The major players operating in the global biogas market are Wartsila, EnviTec Biogas AG, Air Liquide USA, Hindustan Petroleum Corporation Limited, India, PlanET Biogas Group, BoxLNG Pvt. Ltd., Bharat Biogas Energy Ltd., Primove Engineering Pvt. Ltd., GAIL Gas Limited, and GPS Renewables Pvt. Ltd. Other players include Green Elephant, IOT, Praj Industries, and SLPP RE.
Key Benefits For Stakeholders
- This report provides a quantitative analysis of the market segments, current trends, estimations, and dynamics of the biogas market analysis from 2022 to 2032 to identify the prevailing biogas market opportunities.
- The market research is offered along with information related to key drivers, restraints, and opportunities.
- Porter's five forces analysis highlights the potency of buyers and suppliers to enable stakeholders make profit-oriented business decisions and strengthen their supplier-buyer network.
- In-depth analysis of the biogas market segmentation assists to determine the prevailing market opportunities.
- Major countries in each region are mapped according to their revenue contribution to the global market.
- Market player positioning facilitates benchmarking and provides a clear understanding of the present position of the market players.
- The report includes the analysis of the regional as well as global biogas market trends, key players, market segments, application areas, and market growth strategies.
Additional benefits you will get with this purchase are:
- Quarterly Update and* (only available with a corporate license, on listed price)
- 5 additional Company Profile of client Choice pre- or Post-purchase, as a free update.
- Free Upcoming Version on the Purchase of Five and Enterprise User License.
- 16 analyst hours of support* (post-purchase, if you find additional data requirements upon review of the report, you may receive support amounting to 16 analyst hours to solve questions, and post-sale queries)
- 15% Free Customization* (in case the scope or segment of the report does not match your requirements, 15% is equivalent to 3 working days of free work, applicable once)
- Free data Pack on the Five and Enterprise User License. (Excel version of the report)
- Free Updated report if the report is 6-12 months old or older.
- 24-hour priority response*
- Free Industry updates and white papers.
Possible Customization with this report (with additional cost and timeline, please talk to the sales executive to know more)
- Additional company profiles with specific to client's interest
- Additional country or region analysis- market size and forecast
- SWOT Analysis
Key Market Segments
By Source
- Landfill Gas
- Livestock Waste
- Municipal Waste
- Others
By Application
- Buildings
- Others
- Power Generation
- Co-Generation
By Region
- North America
- U.S.
- Canada
- Mexico
- Europe
- Germany
- France
- Italy
- UK
- Spain
- Rest of Europe
- Asia-Pacific
- China
- Japan
- India
- South Korea
- Australia
- Rest of Asia-Pacific
- LAMEA
- Brazil
- Saudi Arabia
- South Africa
- Rest of LAMEA
Key Market Players:
- Wartsila
- EnviTec Biogas AG
- Air Liquide
- Hindustan Petroleum Corporation Limited
- PlanET Biogas Group GmbH
- BoxLNG Pvt. Ltd.
- Bharat Biogas Energy Ltd.
- Primove Engineering Pvt. Ltd.
- gail gas limited
- GPS Renewables Pvt. Ltd
TABLE OF CONTENTS
CHAPTER 1: INTRODUCTION
- 1.1. Report description
- 1.2. Key market segments
- 1.3. Key benefits to the stakeholders
- 1.4. Research methodology
- 1.4.1. Primary research
- 1.4.2. Secondary research
- 1.4.3. Analyst tools and models
CHAPTER 2: EXECUTIVE SUMMARY
- 2.1. CXO perspective
CHAPTER 3: MARKET OVERVIEW
- 3.1. Market definition and scope
- 3.2. Key findings
- 3.2.1. Top impacting factors
- 3.2.2. Top investment pockets
- 3.3. Porter's five forces analysis
- 3.4. Market dynamics
- 3.4.1. Drivers
- 3.4.2. Restraints
- 3.4.3. Opportunities
- 3.5. Value Chain Analysis
- 3.6. Key Regulation Analysis
- 3.7. Patent Landscape
CHAPTER 4: BIOGAS MARKET, BY SOURCE
- 4.1. Overview
- 4.1.1. Market size and forecast
- 4.2. Landfill Gas
- 4.2.1. Key market trends, growth factors and opportunities
- 4.2.2. Market size and forecast, by region
- 4.2.3. Market share analysis by country
- 4.3. Livestock Waste
- 4.3.1. Key market trends, growth factors and opportunities
- 4.3.2. Market size and forecast, by region
- 4.3.3. Market share analysis by country
- 4.4. Municipal Waste
- 4.4.1. Key market trends, growth factors and opportunities
- 4.4.2. Market size and forecast, by region
- 4.4.3. Market share analysis by country
- 4.5. Others
- 4.5.1. Key market trends, growth factors and opportunities
- 4.5.2. Market size and forecast, by region
- 4.5.3. Market share analysis by country
CHAPTER 5: BIOGAS MARKET, BY APPLICATION
- 5.1. Overview
- 5.1.1. Market size and forecast
- 5.2. Power Generation
- 5.2.1. Key market trends, growth factors and opportunities
- 5.2.2. Market size and forecast, by region
- 5.2.3. Market share analysis by country
- 5.3. Co-Generation
- 5.3.1. Key market trends, growth factors and opportunities
- 5.3.2. Market size and forecast, by region
- 5.3.3. Market share analysis by country
- 5.4. Buildings
- 5.4.1. Key market trends, growth factors and opportunities
- 5.4.2. Market size and forecast, by region
- 5.4.3. Market share analysis by country
- 5.5. Others
- 5.5.1. Key market trends, growth factors and opportunities
- 5.5.2. Market size and forecast, by region
- 5.5.3. Market share analysis by country
CHAPTER 6: BIOGAS MARKET, BY REGION
- 6.1. Overview
- 6.1.1. Market size and forecast By Region
- 6.2. North America
- 6.2.1. Key market trends, growth factors and opportunities
- 6.2.2. Market size and forecast, by Source
- 6.2.3. Market size and forecast, by Application
- 6.2.4. Market size and forecast, by country
- 6.2.4.1. U.S.
- 6.2.4.1.1. Market size and forecast, by Source
- 6.2.4.1.2. Market size and forecast, by Application
- 6.2.4.2. Canada
- 6.2.4.2.1. Market size and forecast, by Source
- 6.2.4.2.2. Market size and forecast, by Application
- 6.2.4.3. Mexico
- 6.2.4.3.1. Market size and forecast, by Source
- 6.2.4.3.2. Market size and forecast, by Application
- 6.3. Europe
- 6.3.1. Key market trends, growth factors and opportunities
- 6.3.2. Market size and forecast, by Source
- 6.3.3. Market size and forecast, by Application
- 6.3.4. Market size and forecast, by country
- 6.3.4.1. Germany
- 6.3.4.1.1. Market size and forecast, by Source
- 6.3.4.1.2. Market size and forecast, by Application
- 6.3.4.2. France
- 6.3.4.2.1. Market size and forecast, by Source
- 6.3.4.2.2. Market size and forecast, by Application
- 6.3.4.3. Italy
- 6.3.4.3.1. Market size and forecast, by Source
- 6.3.4.3.2. Market size and forecast, by Application
- 6.3.4.4. UK
- 6.3.4.4.1. Market size and forecast, by Source
- 6.3.4.4.2. Market size and forecast, by Application
- 6.3.4.5. Spain
- 6.3.4.5.1. Market size and forecast, by Source
- 6.3.4.5.2. Market size and forecast, by Application
- 6.3.4.6. Rest of Europe
- 6.3.4.6.1. Market size and forecast, by Source
- 6.3.4.6.2. Market size and forecast, by Application
- 6.4. Asia-Pacific
- 6.4.1. Key market trends, growth factors and opportunities
- 6.4.2. Market size and forecast, by Source
- 6.4.3. Market size and forecast, by Application
- 6.4.4. Market size and forecast, by country
- 6.4.4.1. China
- 6.4.4.1.1. Market size and forecast, by Source
- 6.4.4.1.2. Market size and forecast, by Application
- 6.4.4.2. Japan
- 6.4.4.2.1. Market size and forecast, by Source
- 6.4.4.2.2. Market size and forecast, by Application
- 6.4.4.3. India
- 6.4.4.3.1. Market size and forecast, by Source
- 6.4.4.3.2. Market size and forecast, by Application
- 6.4.4.4. South Korea
- 6.4.4.4.1. Market size and forecast, by Source
- 6.4.4.4.2. Market size and forecast, by Application
- 6.4.4.5. Australia
- 6.4.4.5.1. Market size and forecast, by Source
- 6.4.4.5.2. Market size and forecast, by Application
- 6.4.4.6. Rest of Asia-Pacific
- 6.4.4.6.1. Market size and forecast, by Source
- 6.4.4.6.2. Market size and forecast, by Application
- 6.5. LAMEA
- 6.5.1. Key market trends, growth factors and opportunities
- 6.5.2. Market size and forecast, by Source
- 6.5.3. Market size and forecast, by Application
- 6.5.4. Market size and forecast, by country
- 6.5.4.1. Brazil
- 6.5.4.1.1. Market size and forecast, by Source
- 6.5.4.1.2. Market size and forecast, by Application
- 6.5.4.2. Saudi Arabia
- 6.5.4.2.1. Market size and forecast, by Source
- 6.5.4.2.2. Market size and forecast, by Application
- 6.5.4.3. South Africa
- 6.5.4.3.1. Market size and forecast, by Source
- 6.5.4.3.2. Market size and forecast, by Application
- 6.5.4.4. Rest of LAMEA
- 6.5.4.4.1. Market size and forecast, by Source
- 6.5.4.4.2. Market size and forecast, by Application
CHAPTER 7: COMPETITIVE LANDSCAPE
- 7.1. Introduction
- 7.2. Top winning strategies
- 7.3. Product mapping of top 10 player
- 7.4. Competitive dashboard
- 7.5. Competitive heatmap
- 7.6. Top player positioning, 2022
CHAPTER 8: COMPANY PROFILES
- 8.1. Wartsila
- 8.1.1. Company overview
- 8.1.2. Key executives
- 8.1.3. Company snapshot
- 8.1.4. Operating business segments
- 8.1.5. Product portfolio
- 8.1.6. Business performance
- 8.1.7. Key strategic moves and developments
- 8.2. EnviTec Biogas AG
- 8.2.1. Company overview
- 8.2.2. Key executives
- 8.2.3. Company snapshot
- 8.2.4. Operating business segments
- 8.2.5. Product portfolio
- 8.2.6. Business performance
- 8.2.7. Key strategic moves and developments
- 8.3. Air Liquide
- 8.3.1. Company overview
- 8.3.2. Key executives
- 8.3.3. Company snapshot
- 8.3.4. Operating business segments
- 8.3.5. Product portfolio
- 8.3.6. Business performance
- 8.3.7. Key strategic moves and developments
- 8.4. Hindustan Petroleum Corporation Limited
- 8.4.1. Company overview
- 8.4.2. Key executives
- 8.4.3. Company snapshot
- 8.4.4. Operating business segments
- 8.4.5. Product portfolio
- 8.4.6. Business performance
- 8.4.7. Key strategic moves and developments
- 8.5. PlanET Biogas Group GmbH
- 8.5.1. Company overview
- 8.5.2. Key executives
- 8.5.3. Company snapshot
- 8.5.4. Operating business segments
- 8.5.5. Product portfolio
- 8.5.6. Business performance
- 8.5.7. Key strategic moves and developments
- 8.6. BoxLNG Pvt. Ltd.
- 8.6.1. Company overview
- 8.6.2. Key executives
- 8.6.3. Company snapshot
- 8.6.4. Operating business segments
- 8.6.5. Product portfolio
- 8.6.6. Business performance
- 8.6.7. Key strategic moves and developments
- 8.7. Bharat Biogas Energy Ltd.
- 8.7.1. Company overview
- 8.7.2. Key executives
- 8.7.3. Company snapshot
- 8.7.4. Operating business segments
- 8.7.5. Product portfolio
- 8.7.6. Business performance
- 8.7.7. Key strategic moves and developments
- 8.8. Primove Engineering Pvt. Ltd.
- 8.8.1. Company overview
- 8.8.2. Key executives
- 8.8.3. Company snapshot
- 8.8.4. Operating business segments
- 8.8.5. Product portfolio
- 8.8.6. Business performance
- 8.8.7. Key strategic moves and developments
- 8.9. gail gas limited
- 8.9.1. Company overview
- 8.9.2. Key executives
- 8.9.3. Company snapshot
- 8.9.4. Operating business segments
- 8.9.5. Product portfolio
- 8.9.6. Business performance
- 8.9.7. Key strategic moves and developments
- 8.10. GPS Renewables Pvt. Ltd
- 8.10.1. Company overview
- 8.10.2. Key executives
- 8.10.3. Company snapshot
- 8.10.4. Operating business segments
- 8.10.5. Product portfolio
- 8.10.6. Business performance
- 8.10.7. Key strategic moves and developments
LIST OF TABLES
- TABLE 01. GLOBAL BIOGAS MARKET, BY SOURCE, 2022-2032 ($MILLION)
- TABLE 02. BIOGAS MARKET FOR LANDFILL GAS, BY REGION, 2022-2032 ($MILLION)
- TABLE 03. BIOGAS MARKET FOR LIVESTOCK WASTE, BY REGION, 2022-2032 ($MILLION)
- TABLE 04. BIOGAS MARKET FOR MUNICIPAL WASTE, BY REGION, 2022-2032 ($MILLION)
- TABLE 05. BIOGAS MARKET FOR OTHERS, BY REGION, 2022-2032 ($MILLION)
- TABLE 06. GLOBAL BIOGAS MARKET, BY APPLICATION, 2022-2032 ($MILLION)
- TABLE 07. BIOGAS MARKET FOR POWER GENERATION, BY REGION, 2022-2032 ($MILLION)
- TABLE 08. BIOGAS MARKET FOR CO-GENERATION, BY REGION, 2022-2032 ($MILLION)
- TABLE 09. BIOGAS MARKET FOR BUILDINGS, BY REGION, 2022-2032 ($MILLION)
- TABLE 10. BIOGAS MARKET FOR OTHERS, BY REGION, 2022-2032 ($MILLION)
- TABLE 11. BIOGAS MARKET, BY REGION, 2022-2032 ($MILLION)
- TABLE 12. NORTH AMERICA BIOGAS MARKET, BY SOURCE, 2022-2032 ($MILLION)
- TABLE 13. NORTH AMERICA BIOGAS MARKET, BY APPLICATION, 2022-2032 ($MILLION)
- TABLE 14. NORTH AMERICA BIOGAS MARKET, BY COUNTRY, 2022-2032 ($MILLION)
- TABLE 15. U.S. BIOGAS MARKET, BY SOURCE, 2022-2032 ($MILLION)
- TABLE 16. U.S. BIOGAS MARKET, BY APPLICATION, 2022-2032 ($MILLION)
- TABLE 17. CANADA BIOGAS MARKET, BY SOURCE, 2022-2032 ($MILLION)
- TABLE 18. CANADA BIOGAS MARKET, BY APPLICATION, 2022-2032 ($MILLION)
- TABLE 19. MEXICO BIOGAS MARKET, BY SOURCE, 2022-2032 ($MILLION)
- TABLE 20. MEXICO BIOGAS MARKET, BY APPLICATION, 2022-2032 ($MILLION)
- TABLE 21. EUROPE BIOGAS MARKET, BY SOURCE, 2022-2032 ($MILLION)
- TABLE 22. EUROPE BIOGAS MARKET, BY APPLICATION, 2022-2032 ($MILLION)
- TABLE 23. EUROPE BIOGAS MARKET, BY COUNTRY, 2022-2032 ($MILLION)
- TABLE 24. GERMANY BIOGAS MARKET, BY SOURCE, 2022-2032 ($MILLION)
- TABLE 25. GERMANY BIOGAS MARKET, BY APPLICATION, 2022-2032 ($MILLION)
- TABLE 26. FRANCE BIOGAS MARKET, BY SOURCE, 2022-2032 ($MILLION)
- TABLE 27. FRANCE BIOGAS MARKET, BY APPLICATION, 2022-2032 ($MILLION)
- TABLE 28. ITALY BIOGAS MARKET, BY SOURCE, 2022-2032 ($MILLION)
- TABLE 29. ITALY BIOGAS MARKET, BY APPLICATION, 2022-2032 ($MILLION)
- TABLE 30. UK BIOGAS MARKET, BY SOURCE, 2022-2032 ($MILLION)
- TABLE 31. UK BIOGAS MARKET, BY APPLICATION, 2022-2032 ($MILLION)
- TABLE 32. SPAIN BIOGAS MARKET, BY SOURCE, 2022-2032 ($MILLION)
- TABLE 33. SPAIN BIOGAS MARKET, BY APPLICATION, 2022-2032 ($MILLION)
- TABLE 34. REST OF EUROPE BIOGAS MARKET, BY SOURCE, 2022-2032 ($MILLION)
- TABLE 35. REST OF EUROPE BIOGAS MARKET, BY APPLICATION, 2022-2032 ($MILLION)
- TABLE 36. ASIA-PACIFIC BIOGAS MARKET, BY SOURCE, 2022-2032 ($MILLION)
- TABLE 37. ASIA-PACIFIC BIOGAS MARKET, BY APPLICATION, 2022-2032 ($MILLION)
- TABLE 38. ASIA-PACIFIC BIOGAS MARKET, BY COUNTRY, 2022-2032 ($MILLION)
- TABLE 39. CHINA BIOGAS MARKET, BY SOURCE, 2022-2032 ($MILLION)
- TABLE 40. CHINA BIOGAS MARKET, BY APPLICATION, 2022-2032 ($MILLION)
- TABLE 41. JAPAN BIOGAS MARKET, BY SOURCE, 2022-2032 ($MILLION)
- TABLE 42. JAPAN BIOGAS MARKET, BY APPLICATION, 2022-2032 ($MILLION)
- TABLE 43. INDIA BIOGAS MARKET, BY SOURCE, 2022-2032 ($MILLION)
- TABLE 44. INDIA BIOGAS MARKET, BY APPLICATION, 2022-2032 ($MILLION)
- TABLE 45. SOUTH KOREA BIOGAS MARKET, BY SOURCE, 2022-2032 ($MILLION)
- TABLE 46. SOUTH KOREA BIOGAS MARKET, BY APPLICATION, 2022-2032 ($MILLION)
- TABLE 47. AUSTRALIA BIOGAS MARKET, BY SOURCE, 2022-2032 ($MILLION)
- TABLE 48. AUSTRALIA BIOGAS MARKET, BY APPLICATION, 2022-2032 ($MILLION)
- TABLE 49. REST OF ASIA-PACIFIC BIOGAS MARKET, BY SOURCE, 2022-2032 ($MILLION)
- TABLE 50. REST OF ASIA-PACIFIC BIOGAS MARKET, BY APPLICATION, 2022-2032 ($MILLION)
- TABLE 51. LAMEA BIOGAS MARKET, BY SOURCE, 2022-2032 ($MILLION)
- TABLE 52. LAMEA BIOGAS MARKET, BY APPLICATION, 2022-2032 ($MILLION)
- TABLE 53. LAMEA BIOGAS MARKET, BY COUNTRY, 2022-2032 ($MILLION)
- TABLE 54. BRAZIL BIOGAS MARKET, BY SOURCE, 2022-2032 ($MILLION)
- TABLE 55. BRAZIL BIOGAS MARKET, BY APPLICATION, 2022-2032 ($MILLION)
- TABLE 56. SAUDI ARABIA BIOGAS MARKET, BY SOURCE, 2022-2032 ($MILLION)
- TABLE 57. SAUDI ARABIA BIOGAS MARKET, BY APPLICATION, 2022-2032 ($MILLION)
- TABLE 58. SOUTH AFRICA BIOGAS MARKET, BY SOURCE, 2022-2032 ($MILLION)
- TABLE 59. SOUTH AFRICA BIOGAS MARKET, BY APPLICATION, 2022-2032 ($MILLION)
- TABLE 60. REST OF LAMEA BIOGAS MARKET, BY SOURCE, 2022-2032 ($MILLION)
- TABLE 61. REST OF LAMEA BIOGAS MARKET, BY APPLICATION, 2022-2032 ($MILLION)
- TABLE 62. WARTSILA: KEY EXECUTIVES
- TABLE 63. WARTSILA: COMPANY SNAPSHOT
- TABLE 64. WARTSILA: PRODUCT SEGMENTS
- TABLE 65. WARTSILA: SERVICE SEGMENTS
- TABLE 66. WARTSILA: PRODUCT PORTFOLIO
- TABLE 67. WARTSILA: KEY STRATERGIES
- TABLE 68. ENVITEC BIOGAS AG: KEY EXECUTIVES
- TABLE 69. ENVITEC BIOGAS AG: COMPANY SNAPSHOT
- TABLE 70. ENVITEC BIOGAS AG: PRODUCT SEGMENTS
- TABLE 71. ENVITEC BIOGAS AG: SERVICE SEGMENTS
- TABLE 72. ENVITEC BIOGAS AG: PRODUCT PORTFOLIO
- TABLE 73. ENVITEC BIOGAS AG: KEY STRATERGIES
- TABLE 74. AIR LIQUIDE: KEY EXECUTIVES
- TABLE 75. AIR LIQUIDE: COMPANY SNAPSHOT
- TABLE 76. AIR LIQUIDE: PRODUCT SEGMENTS
- TABLE 77. AIR LIQUIDE: SERVICE SEGMENTS
- TABLE 78. AIR LIQUIDE: PRODUCT PORTFOLIO
- TABLE 79. AIR LIQUIDE: KEY STRATERGIES
- TABLE 80. HINDUSTAN PETROLEUM CORPORATION LIMITED: KEY EXECUTIVES
- TABLE 81. HINDUSTAN PETROLEUM CORPORATION LIMITED: COMPANY SNAPSHOT
- TABLE 82. HINDUSTAN PETROLEUM CORPORATION LIMITED: PRODUCT SEGMENTS
- TABLE 83. HINDUSTAN PETROLEUM CORPORATION LIMITED: SERVICE SEGMENTS
- TABLE 84. HINDUSTAN PETROLEUM CORPORATION LIMITED: PRODUCT PORTFOLIO
- TABLE 85. HINDUSTAN PETROLEUM CORPORATION LIMITED: KEY STRATERGIES
- TABLE 86. PLANET BIOGAS GROUP GMBH: KEY EXECUTIVES
- TABLE 87. PLANET BIOGAS GROUP GMBH: COMPANY SNAPSHOT
- TABLE 88. PLANET BIOGAS GROUP GMBH: PRODUCT SEGMENTS
- TABLE 89. PLANET BIOGAS GROUP GMBH: SERVICE SEGMENTS
- TABLE 90. PLANET BIOGAS GROUP GMBH: PRODUCT PORTFOLIO
- TABLE 91. PLANET BIOGAS GROUP GMBH: KEY STRATERGIES
- TABLE 92. BOXLNG PVT. LTD.: KEY EXECUTIVES
- TABLE 93. BOXLNG PVT. LTD.: COMPANY SNAPSHOT
- TABLE 94. BOXLNG PVT. LTD.: PRODUCT SEGMENTS
- TABLE 95. BOXLNG PVT. LTD.: SERVICE SEGMENTS
- TABLE 96. BOXLNG PVT. LTD.: PRODUCT PORTFOLIO
- TABLE 97. BOXLNG PVT. LTD.: KEY STRATERGIES
- TABLE 98. BHARAT BIOGAS ENERGY LTD.: KEY EXECUTIVES
- TABLE 99. BHARAT BIOGAS ENERGY LTD.: COMPANY SNAPSHOT
- TABLE 100. BHARAT BIOGAS ENERGY LTD.: PRODUCT SEGMENTS
- TABLE 101. BHARAT BIOGAS ENERGY LTD.: SERVICE SEGMENTS
- TABLE 102. BHARAT BIOGAS ENERGY LTD.: PRODUCT PORTFOLIO
- TABLE 103. BHARAT BIOGAS ENERGY LTD.: KEY STRATERGIES
- TABLE 104. PRIMOVE ENGINEERING PVT. LTD.: KEY EXECUTIVES
- TABLE 105. PRIMOVE ENGINEERING PVT. LTD.: COMPANY SNAPSHOT
- TABLE 106. PRIMOVE ENGINEERING PVT. LTD.: PRODUCT SEGMENTS
- TABLE 107. PRIMOVE ENGINEERING PVT. LTD.: SERVICE SEGMENTS
- TABLE 108. PRIMOVE ENGINEERING PVT. LTD.: PRODUCT PORTFOLIO
- TABLE 109. PRIMOVE ENGINEERING PVT. LTD.: KEY STRATERGIES
- TABLE 110. GAIL GAS LIMITED: KEY EXECUTIVES
- TABLE 111. GAIL GAS LIMITED: COMPANY SNAPSHOT
- TABLE 112. GAIL GAS LIMITED: PRODUCT SEGMENTS
- TABLE 113. GAIL GAS LIMITED: SERVICE SEGMENTS
- TABLE 114. GAIL GAS LIMITED: PRODUCT PORTFOLIO
- TABLE 115. GAIL GAS LIMITED: KEY STRATERGIES
- TABLE 116. GPS RENEWABLES PVT. LTD: KEY EXECUTIVES
- TABLE 117. GPS RENEWABLES PVT. LTD: COMPANY SNAPSHOT
- TABLE 118. GPS RENEWABLES PVT. LTD: PRODUCT SEGMENTS
- TABLE 119. GPS RENEWABLES PVT. LTD: SERVICE SEGMENTS
- TABLE 120. GPS RENEWABLES PVT. LTD: PRODUCT PORTFOLIO
- TABLE 121. GPS RENEWABLES PVT. LTD: KEY STRATERGIES
LIST OF FIGURES
- FIGURE 01. BIOGAS MARKET, 2022-2032
- FIGURE 02. SEGMENTATION OF BIOGAS MARKET,2022-2032
- FIGURE 03. TOP IMPACTING FACTORS IN BIOGAS MARKET
- FIGURE 04. TOP INVESTMENT POCKETS IN BIOGAS MARKET (2023-2032)
- FIGURE 05. BARGAINING POWER OF SUPPLIERS
- FIGURE 06. BARGAINING POWER OF BUYERS
- FIGURE 07. THREAT OF SUBSTITUTION
- FIGURE 08. THREAT OF SUBSTITUTION
- FIGURE 09. COMPETITIVE RIVALRY
- FIGURE 10. GLOBAL BIOGAS MARKET:DRIVERS, RESTRAINTS AND OPPORTUNITIES
- FIGURE 11. IMPACT OF KEY REGULATION: BIOGAS MARKET
- FIGURE 12. PATENT ANALYSIS BY COMPANY
- FIGURE 13. PATENT ANALYSIS BY COUNTRY
- FIGURE 14. BIOGAS MARKET, BY SOURCE, 2022 AND 2032(%)
- FIGURE 15. COMPARATIVE SHARE ANALYSIS OF BIOGAS MARKET FOR LANDFILL GAS, BY COUNTRY 2022 AND 2032(%)
- FIGURE 16. COMPARATIVE SHARE ANALYSIS OF BIOGAS MARKET FOR LIVESTOCK WASTE, BY COUNTRY 2022 AND 2032(%)
- FIGURE 17. COMPARATIVE SHARE ANALYSIS OF BIOGAS MARKET FOR MUNICIPAL WASTE, BY COUNTRY 2022 AND 2032(%)
- FIGURE 18. COMPARATIVE SHARE ANALYSIS OF BIOGAS MARKET FOR OTHERS, BY COUNTRY 2022 AND 2032(%)
- FIGURE 19. BIOGAS MARKET, BY APPLICATION, 2022 AND 2032(%)
- FIGURE 20. COMPARATIVE SHARE ANALYSIS OF BIOGAS MARKET FOR POWER GENERATION, BY COUNTRY 2022 AND 2032(%)
- FIGURE 21. COMPARATIVE SHARE ANALYSIS OF BIOGAS MARKET FOR CO-GENERATION, BY COUNTRY 2022 AND 2032(%)
- FIGURE 22. COMPARATIVE SHARE ANALYSIS OF BIOGAS MARKET FOR BUILDINGS, BY COUNTRY 2022 AND 2032(%)
- FIGURE 23. COMPARATIVE SHARE ANALYSIS OF BIOGAS MARKET FOR OTHERS, BY COUNTRY 2022 AND 2032(%)
- FIGURE 24. BIOGAS MARKET BY REGION, 2022 AND 2032(%)
- FIGURE 25. U.S. BIOGAS MARKET, 2022-2032 ($MILLION)
- FIGURE 26. CANADA BIOGAS MARKET, 2022-2032 ($MILLION)
- FIGURE 27. MEXICO BIOGAS MARKET, 2022-2032 ($MILLION)
- FIGURE 28. GERMANY BIOGAS MARKET, 2022-2032 ($MILLION)
- FIGURE 29. FRANCE BIOGAS MARKET, 2022-2032 ($MILLION)
- FIGURE 30. ITALY BIOGAS MARKET, 2022-2032 ($MILLION)
- FIGURE 31. UK BIOGAS MARKET, 2022-2032 ($MILLION)
- FIGURE 32. SPAIN BIOGAS MARKET, 2022-2032 ($MILLION)
- FIGURE 33. REST OF EUROPE BIOGAS MARKET, 2022-2032 ($MILLION)
- FIGURE 34. CHINA BIOGAS MARKET, 2022-2032 ($MILLION)
- FIGURE 35. JAPAN BIOGAS MARKET, 2022-2032 ($MILLION)
- FIGURE 36. INDIA BIOGAS MARKET, 2022-2032 ($MILLION)
- FIGURE 37. SOUTH KOREA BIOGAS MARKET, 2022-2032 ($MILLION)
- FIGURE 38. AUSTRALIA BIOGAS MARKET, 2022-2032 ($MILLION)
- FIGURE 39. REST OF ASIA-PACIFIC BIOGAS MARKET, 2022-2032 ($MILLION)
- FIGURE 40. BRAZIL BIOGAS MARKET, 2022-2032 ($MILLION)
- FIGURE 41. SAUDI ARABIA BIOGAS MARKET, 2022-2032 ($MILLION)
- FIGURE 42. SOUTH AFRICA BIOGAS MARKET, 2022-2032 ($MILLION)
- FIGURE 43. REST OF LAMEA BIOGAS MARKET, 2022-2032 ($MILLION)
- FIGURE 44. TOP WINNING STRATEGIES, BY YEAR
- FIGURE 45. TOP WINNING STRATEGIES, BY DEVELOPMENT
- FIGURE 46. TOP WINNING STRATEGIES, BY COMPANY
- FIGURE 47. PRODUCT MAPPING OF TOP 10 PLAYERS
- FIGURE 48. COMPETITIVE DASHBOARD
- FIGURE 49. COMPETITIVE HEATMAP: BIOGAS MARKET
- FIGURE 50. TOP PLAYER POSITIONING, 2022

