
PUBLISHER: Bishop & Associates, Inc. | PRODUCT CODE: 1757090

PUBLISHER: Bishop & Associates, Inc. | PRODUCT CODE: 1757090
2025 Connector Industry Yearbook
Each year, Bishop & Associates prepares the Connector Industry Yearbook based on annual reports provided by publicly traded connector companies. Income statements and balance sheets are consolidated for the past 10 years, five years, and most current year, providing benchmarks on the industry and the overall performance of the public connector companies.
In addition, the report provides a review of the connector industry for the period 2014-2024 for sales by region, end-use equipment sector and our current forecast for 2025 and 2030 by region and end-use equipment sector.
This report features:
Consolidated history of the public companies including:
- Key Financial Measurements (2014-2024)
- Balance Sheet $ (2014-2024)
- Income Statement $ (2014-2024)
- Balance Sheet percent (2014-2024)
- Income Statement percent (2014-2024)
Fifteen-year history of performance by company, with industry averages for the following financial measurements:
- Selling, General, & Administrative percent (2010-2024)
- Net Income percent (2010-2024)
- Return on Assets (2010-2024)
- Long Term Debt/Equity (2010-2024)
- Accounts Receivables Turnover (2010-2024)
- Inventory Turns (2010-2024)
- Cost of Goods Sold percent (2010-2024)
- COGS + SG&A percent (2010-2024)
- Current Ratio (2010-2024)
- Return on Equity (2010-2024)
- Liabilities to Equity (2010-2024)
- Average Collection Period (2010-2024)
- Days Inventory (2010-2024)
2024 Yearbook Companies Net Income as a Percent of Sales
The following table provides Net Income as a percent of sales from 2014-2024 for public companies included in the 2025 Connector Industry Yearbook.
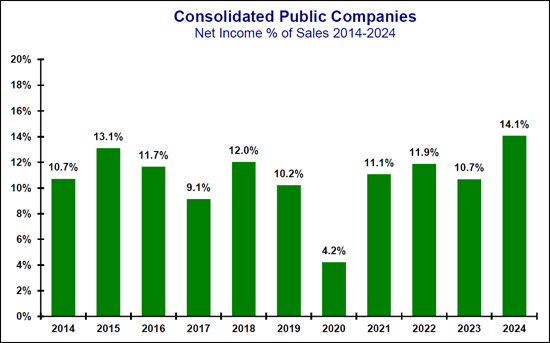
Net Income
In 2024 the connector industry had an average net income of 14.1% of sales. 2018 was a significant year in the United States because it was the year the Tax Cuts and Jobs Act was passed. This act reduced the federal corporate income tax from 35% to 21%. As a result of the worldwide COVID pandemic, the lowest net income as a percent of sales occurred in 2020 at 4.2%. Between 2015 and 2019, net income decreased from 13.1% of sales in 2015 to 10.2% of sales in 2019. Between 2020 and 2024, net income increased from 4.2% in 2020 to 14.1% in 2024.
The following chart provides a history of net income for the Connector Industry from 2010-2024.
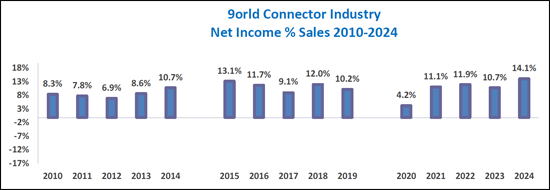
TABLE OF CONTENTS
PROLOGUE
CHAPTER 1 - THE WORLD ELECTRONIC CONNECTOR INDUSTRY
- The Last Ten Years (2014-2024)
- Table: Sales by Geographic Region
- Graph: Change by Region 2014 vs 2024
- The Last Five Years (2019-2024)
- Table: Sales by Geographic Region
- Graph: World Connector Industry - Year-To-Year Percent
- Change in Growth 1980-2025F
- Graph: North American Market Year-to-Year Growth 1980-2025F
- Graph: European Market Year-to-Year Growth 1980-2025F
- Graph: Japanese Market Year-to-Year Growth 1980-2025F
- Graph: Chinese Market Year-to-Year Growth 1995-2025F
- Graph: Asia Pacific Market Year-to-Year Growth 1980-2025F
- Graph: ROW Market Year-to-Year Growth 1980-2025F
- Last Year - 2024
- Table: 2022, 2023 and 2024 Percent Change in Growth Region
- Table: 2022, 2023 and 2024 Percent Share of Market by Region
- Equipment Sector Sales - 2022-2024
- Table: 2022-2024 Percent Change in Equipment Sales by Equipment Sector
- Graph: 2023-2024 Percent Change World Connector
- Sales by Equipment Sector
- Table: 2024 World Sales by Equipment Sector
- Graph: 2024 World Connector Market Top 5 Equipment Sectors
- Forecast 2025 and 2030 by Region
- Table: 2025 & 2030 Forecast by End-Use Market
- Graph: 2025 and 2030 End-Use Market Five-Year CAGR Mergers and Acquisitions
- Key Technology Trends
- Lead Times
- Price Trends
CHAPTER 2 - SIGNIFICANT EVENTS
CHAPTER 3 - CONSOLIDATED KEY PERFORMANCE MEASURES
Consolidated Key Performance Measures
- Key Financial Measurements (2014-2024)
- Charts: Key Financial Measurements
- Balance Sheet $ (2014-2024)
- Balance Sheet % (2014-2024)
- Income Statement $ (2014-2024)
- Income Statement % (2014-2024)
Performance History by Company
- Selected Connector Manufacturers
Cost-of-Goods Sold
- Cost of Goods Sold % (2010-2024)
Selling, General & Administrative (SG&A)
- Selling, General, & Administrative % (2010-2024)
COGS+SG&A
- COGS + SG&A % (2010-2024)
Net Income History
- Net Income % (2010-2024)
Current Ratio
- Current Ratio (2010-2024)
Return on Assets
- Return on Assets (2010-2024)
Return on Equity
- Return on Equity (2010-2024)
Long Term Debt/Equity
- Long Term Debt/Equity (2010-2024)
Liabilities to Equity
- Liabilities to Equity (2010-2024)
Accounts Receivable Turnover
- Accounts Receivables Turnover (2010-2024)
Average Collection Period
- Average Collection Period (2010-2024)
Inventory Turns
- Inventory Turns (2010-2024)
Days Inventory
- Days Inventory (2010-2024)
CHAPTER 4 - PERFORMANCE HISTORY OF SELECTED COMPANIES
Performance History of Selected Companies
Amphenol Corporation
- Key Financial Measurements
- Charts: Key Financial Measurements
- Balance Sheet $ (2014-2024)
- Balance Sheet % (2014-2024)
- Income Statement $ (2014-2024)
- Income Statement % (2014-2024)
Cheng Uei Precision Co. Ltd. (Foxlink)
- Key Financial Measurements
- Charts: Key Financial Measurements
- Balance Sheet $ (2014-2024)
- Balance Sheet % (2014-2024)
- Income Statement $ (2014-2024)
- Income Statement % (2014-2024)
FIT Hon Teng Ltd
- Key Financial Measurements
- Charts: Key Financial Measurements
- Balance Sheet $ (2014-2024)
- Balance Sheet % (2014-2024)
- Income Statement $ (2014-2024)
- Income Statement % (2014-2024)
Hirose Electric Co., Ltd
- Key Financial Measurements
- Charts: Key Financial Measurements
- Balance Sheet $ (2014-2024)
- Balance Sheet % (2014-2024)
- Income Statement $ (2014-2024)
- Income Statement % (2014-2024)
Hosiden
- Key Financial Measurements
- Charts: Key Financial Measurements
- Balance Sheet $ (2014-2024)
- Balance Sheet % (2014-2024)
- Income Statement $ (2014-2024)
- Income Statement % (2014-2024)
HUBER+SUHNER
- Key Financial Measurements
- Charts: Key Financial Measurements
- Balance Sheet $ (2014-2024)
- Balance Sheet % (2014-2024)
- Income Statement $ (2014-2024)
- Income Statement % (2014-2024)
Japan Aviation Electronics Industry (JAE), Limited
- Key Financial Measurements
- Charts: Key Financial Measurements
- Balance Sheet $ (2014-2024)
- Balance Sheet % (2014-2024)
- Income Statement $ (2014-2024)
- Income Statement % (2014-2024)
Korea Electric Terminal Co. Ltd.
- Key Financial Measurements
- Charts: Key Financial Measurements
- Balance Sheet $ (2014-2024)
- Balance Sheet % (2014-2024)
- Income Statement $ (2014-2024)
- Income Statement % (2014-2024)
SMK
- Key Financial Measurements
- Charts: Key Financial Measurements
- Balance Sheet $ (2014-2024)
- Balance Sheet % (2014-2024)
- Income Statement $ (2014-2024)
- Income Statement % (2014-2024)
TE Connectivity
- Key Financial Measurements
- Charts: Key Financial Measurements
- Balance Sheet $ (2014-2024)
- Balance Sheet % (2014-2024)
- Income Statement $ (2014-2024)
- Income Statement % (2014-2024)

