
PUBLISHER: Coherent Market Insights | PRODUCT CODE: 1708554

PUBLISHER: Coherent Market Insights | PRODUCT CODE: 1708554
High Potency Active Pharmaceutical Ingredients Market, By Molecule Type, By Production Technology, By Application, By Geography
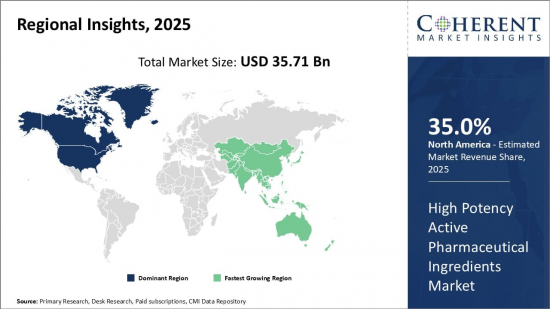
Global High Potency Active Pharmaceutical Ingredients Market is estimated to be valued at USD 35.71 Bn in 2025 and is expected to reach USD 71.39 Bn by 2032, growing at a compound annual growth rate (CAGR) of 10.4% from 2025 to 2032.
| Report Coverage | Report Details | ||
|---|---|---|---|
| Base Year: | 2024 | Market Size in 2025: | USD 35.71 Bn |
| Historical Data for: | 2020 To 2024 | Forecast Period: | 2025 To 2032 |
| Forecast Period 2025 to 2032 CAGR: | 10.40% | 2032 Value Projection: | USD 71.39 Bn |
Global high potency active pharmaceutical ingredients (HPAPI) market comprises of a significant segment of the pharmaceutical industry that specializes in the production of highly potent drugs. These ingredients are characterized by their ability to deliver therapeutic effects at low concentrations and their potential to target specific disease cells with precision. High potency active pharmaceutical ingredients (HPAPIs) are increasingly utilized in the treatment of chronic and complicated health conditions such as cancer, diabetes, and autoimmune diseases due to their effectiveness and specificity in action. As the prevalence of these diseases continues to rise globally, so does the demand for high potency medication, propelling the global high potency active pharmaceutical ingredients (HPAPI) market forward. Manufacturers in this sector are investing heavily in research and development (R&D) to create new HPAPIs that offer improved safety and efficacy profiles. The highly regulated nature of this market necessitates stringent containment measures and specialized facilities to handle these potent substances, which can be toxic at certain levels of exposure, thereby presenting significant operational challenges. Moreover, the advancement in technology and innovation in pharmaceuticals is leading to the development of targeted therapy approaches like antibody-drug conjugates (ADCs), where high potency active pharmaceutical ingredients (HPAPIs) are conjugated with monoclonal antibodies to deliver the active compound directly to cancer cells. This precision reduces damage to healthy cells and minimizes side effects, thereby enhancing patient outcomes. Global high potency active pharmaceutical ingredients (HPAPI) market is a dynamic and evolving field that holds substantial promise for the effective management of complex medical conditions. With continued investment in development, strong regulatory frameworks, and the advancement of personalized medicine, its role in the healthcare sector is expected to expand significantly in the near future.
Market Dynamics:
The growth of the global high potency active pharmaceutical ingredients market is driven by the increasing demand for biologics and targeted therapies. Rising prevalence of chronic diseases like cancer is propelling the demand for biologics with higher potency and specificity. Growing focus on the development of orphan drugs for rare medical conditions is boosting trial activities. This is expected to positively impact the global high potency active pharmaceutical ingredients (HPAPI) market.
Key Features of the Study:
- This report provides an in-depth analysis of the global high potency active pharmaceutical ingredients market, and provides market size (US$ Bn) and compound annual growth rate (CAGR %) for the forecast period (2025-2032), considering 2024 as the base year
- It elucidates potential revenue growth opportunities across different segments and explains attractive investment proposition matrices for this market
- This study also provides key insights about market drivers, restraints, opportunities, new product launches or approvals, market trends, regional outlook, and competitive strategies adopted by key players
- It profiles key players in the global high potency active pharmaceutical ingredients market based on the following parameters - company highlights, products portfolio, key highlights, financial performance, and strategies
- Key companies covered as a part of this study include Lonza, Novartis International AG, BASF AG, SEQENS, Carbogen Amcis AG, Eli Lilly and Company, Teva Pharmaceutical Industries Ltd, Bristol-Myers Squibb, Pfizer Inc., Roche Diagnostics, Boehringer Ingelheim, Merck & Co, Bayer AG, Ajinomoto Bio-Pharma Services, Cambrex Corporation, Minakem, and Sanofi Aventis
- Insights from this report would allow marketers and the management authorities of the companies to make informed decisions regarding their future product launches, type up gradation, market expansion, and marketing tactics
- Global high potency active pharmaceutical ingredients market report caters to various stakeholders in this industry including investors, suppliers, product manufacturers, distributors, new entrants, and financial analysts
- Stakeholders would have ease in decision-making through various strategy matrices used in analyzing the global high potency active pharmaceutical ingredients market
Detailed Segmentation:
- Global High Potency Active Pharmaceutical Ingredients Market, By Molecule Type
- Innovative
- Generic
- Global High Potency Active Pharmaceutical Ingredients Market, By Production Technology
- Chemical Synthesis
- Biotechnology
- Global High Potency Active Pharmaceutical Ingredients Market, By Application
- Oncology
- Hormonal
- Glaucoma
- Others
- Global High Potency Active Pharmaceutical Ingredients Market, By Region
- North America
- Europe
- Asia Pacific
- Latin America
- Middle East
- Africa
- Company Profiles
- Lonza
- Novartis International AG
- BASF AG
- SEQENS
- Carbogen Amcis AG
- Eli Lilly and Company
- Teva Pharmaceutical Industries Ltd
- Bristol-Myers Squibb
- Pfizer Inc.
- Roche Diagnostics
- Boehringer Ingelheim
- Merck & Co
- Bayer AG
- Ajinomoto Bio-Pharma Services
- Cambrex Corporation
- Minakem
- Sanofi Aventis
Table of Contents
1. Research Objectives and Assumptions
- Research Objectives
- Assumptions
- Abbreviations
2. Market Purview
- Report Description
- Market Definition and Scope
- Executive Summary
- Market High Potency Active Pharmaceutical Ingredients, By Molecule Type
- Market High Potency Active Pharmaceutical Ingredients, By Production Technology
- Market High Potency Active Pharmaceutical Ingredients, By Application
- Market High Potency Active Pharmaceutical Ingredients, By Region
- Coherent Opportunity Map (COM)
3. Market Dynamics, Regulations, and Trends Analysis
- Market Dynamics
- Drivers
- Rising prevalence of cancer and other chronic diseases
- Restraints
- High cost of production
- Opportunities
- Increased production of specialty drugs
- Key Highlights
- Regulatory Scenario
- Recent Trends
- Product Launches/Approvals
- PEST Analysis
- PORTER's Analysis
- Mergers, Acquisitions, and Collaborations
4. Global High Potency Active Pharmaceutical Ingredients Market - Impact of Coronavirus (COVID-19) Pandemic
- COVID-19 Epidemiology
- Supply Side and Demand Side Analysis
- Economic Impact
5. Global High Potency Active Pharmaceutical Ingredients Market, By Molecule Type, 2020-2032, (US$ Bn)
- Introduction
- Market Share Analysis, 2025 and 2032 (%)
- Y-o-Y Growth Analysis, 2021 - 2032
- Segment Trends
- Innovative
- Introduction
- Market Size and Forecast, and Y-o-Y Growth, 2020-2032,(US$ Bn)
- Generic
- Introduction
- Market Size and Forecast, and Y-o-Y Growth, 2020-2032,(US$ Bn)
6. Global High Potency Active Pharmaceutical Ingredients Market, By Production Technology, 2020-2032, (US$ Bn)
- Introduction
- Market Share Analysis, 2025 and 2032 (%)
- Y-o-Y Growth Analysis, 2021 - 2032
- Segment Trends
- Chemical Synthesis
- Introduction
- Market Size and Forecast, and Y-o-Y Growth, 2020-2032,(US$ Bn)
- Biotechnology
- Introduction
- Market Size and Forecast, and Y-o-Y Growth, 2020-2032,(US$ Bn)
7. Global High Potency Active Pharmaceutical Ingredients Market, By Application, 2020-2032, (US$ Bn)
- Introduction
- Market Share Analysis, 2025 and 2032 (%)
- Y-o-Y Growth Analysis, 2021 - 2032
- Segment Trends
- Oncology
- Introduction
- Market Size and Forecast, and Y-o-Y Growth, 2020-2032,(US$ Bn)
- Hormonal
- Introduction
- Market Size and Forecast, and Y-o-Y Growth, 2020-2032,(US$ Bn)
- Glaucoma
- Introduction
- Market Size and Forecast, and Y-o-Y Growth, 2020-2032,(US$ Bn)
- Others
- Introduction
- Market Size and Forecast, and Y-o-Y Growth, 2020-2032,(US$ Bn)
8. Global High Potency Active Pharmaceutical Ingredients Market, By Region, 2020-2032, (US$ Bn)
- Introduction
- Market Share Analysis, By Region, 2025 and 2032 (%)
- Y-o-Y Growth Analysis, For Region, 2021 - 2032
- Country Trends
- North America
- Introduction
- Market Size and Forecast, and Y-o-Y Growth, By Molecule Type, 2020-2032,(US$ Bn)
- Market Size and Forecast, and Y-o-Y Growth, By Production Technology, 2020-2032,(US$ Bn)
- Market Size and Forecast, and Y-o-Y Growth, By Application, 2020-2032,(US$ Bn)
- Market Size and Forecast, and Y-o-Y Growth, By Country, 2020-2032,(US$ Bn)
- U.S.
- Canada
- Europe
- Introduction
- Market Size and Forecast, and Y-o-Y Growth, By Molecule Type, 2020-2032,(US$ Bn)
- Market Size and Forecast, and Y-o-Y Growth, By Production Technology, 2020-2032,(US$ Bn)
- Market Size and Forecast, and Y-o-Y Growth, By Application, 2020-2032,(US$ Bn)
- Market Size and Forecast, and Y-o-Y Growth, By Country, 2020-2032,(US$ Bn)
- Germany
- U.K.
- Spain
- France
- Italy
- Russia
- Rest of Europe
- Asia Pacific
- Introduction
- Market Size and Forecast, and Y-o-Y Growth, By Molecule Type, 2020-2032,(US$ Bn)
- Market Size and Forecast, and Y-o-Y Growth, By Production Technology, 2020-2032,(US$ Bn)
- Market Size and Forecast, and Y-o-Y Growth, By Application, 2020-2032,(US$ Bn)
- Market Size and Forecast, and Y-o-Y Growth, By Country, 2020-2032,(US$ Bn)
- China
- India
- Japan
- Australia
- South Korea
- ASEAN
- Rest of Asia Pacific
- Latin America
- Introduction
- Market Size and Forecast, and Y-o-Y Growth, By Molecule Type, 2020-2032,(US$ Bn)
- Market Size and Forecast, and Y-o-Y Growth, By Production Technology, 2020-2032,(US$ Bn)
- Market Size and Forecast, and Y-o-Y Growth, By Application, 2020-2032,(US$ Bn)
- Market Size and Forecast, and Y-o-Y Growth, By Country, 2020-2032,(US$ Bn)
- Brazil
- Argentina
- Mexico
- Rest of Latin America
- Middle East
- Introduction
- Market Size and Forecast, and Y-o-Y Growth, By Molecule Type, 2020-2032,(US$ Bn)
- Market Size and Forecast, and Y-o-Y Growth, By Production Technology, 2020-2032,(US$ Bn)
- Market Size and Forecast, and Y-o-Y Growth, By Application, 2020-2032,(US$ Bn)
- Market Size and Forecast, and Y-o-Y Growth, By Country, 2020-2032,(US$ Bn)
- GCC Countries
- Israel
- Rest of Middle East
- Africa
- Introduction
- Market Size and Forecast, and Y-o-Y Growth, By Molecule Type, 2020-2032,(US$ Bn)
- Market Size and Forecast, and Y-o-Y Growth, By Production Technology, 2020-2032,(US$ Bn)
- Market Size and Forecast, and Y-o-Y Growth, By Application, 2020-2032,(US$ Bn)
- Market Size and Forecast, and Y-o-Y Growth, By Country/Region, 2020-2032,(US$ Bn)
- South Africa
- Central Africa
- North Africa
9. Competitive Landscape
- Company Profile
- Lonza
- Company Highlights
- Product Portfolio
- Key Developments
- Financial Performance
- Strategies
- Novartis International AG
- Company Highlights
- Product Portfolio
- Key Highlights
- Financial Performance
- Strategies
- BASF AG
- Company Highlights
- Product Portfolio
- Key Highlights
- Financial Performance
- Strategies
- SEQENS
- Company Highlights
- Product Portfolio
- Key Highlights
- Financial Performance
- Strategies
- Carbogen Amcis AG
- Company Highlights
- Product Portfolio
- Key Highlights
- Financial Performance
- Strategies
- Eli Lilly and Company
- Company Highlights
- Product Portfolio
- Key Highlights
- Financial Performance
- Strategies
- Teva Pharmaceutical Industries Ltd
- Company Highlights
- Product Portfolio
- Key Highlights
- Financial Performance
- Strategies
- Bristol-Myers Squibb
- Company Highlights
- Product Portfolio
- Key Developments
- Financial Performance
- Strategies
- Pfizer Inc.
- Roche Diagnostics
- Boehringer Ingelheim
- Merck & Co
- Bayer AG
- Ajinomoto Bio-Pharma Services
- Cambrex Corporation
- Minakem
- Sanofi Aventis
- Analyst Views
10. Section
- References
- Research Methodology
- About us

