
PUBLISHER: Coherent Market Insights | PRODUCT CODE: 1705982

PUBLISHER: Coherent Market Insights | PRODUCT CODE: 1705982
Utility Markers Market, By Product Type, By End User, By Technology, By Distribution Channel, By Geography
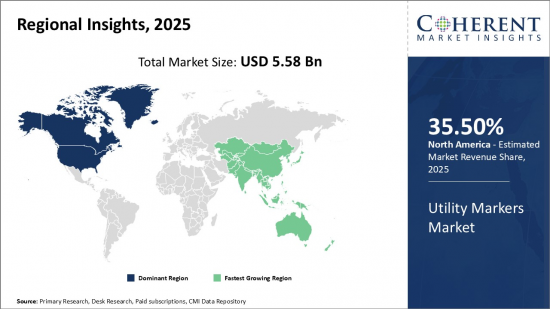
Global Utility Markers Market is estimated to be valued at USD 5.58 Bn in 2025 and is expected to reach USD 9.62 Bn by 2032, growing at a compound annual growth rate (CAGR) of 8.1% from 2025 to 2032.
| Report Coverage | Report Details | ||
|---|---|---|---|
| Base Year: | 2024 | Market Size in 2025: | USD 5.58 Bn |
| Historical Data for: | 2020 To 2024 | Forecast Period: | 2025 To 2032 |
| Forecast Period 2025 to 2032 CAGR: | 8.10% | 2032 Value Projection: | USD 9.62 Bn |
Utility markers are an essential component of any underground utility infrastructure. These markers help in the identification and location of various facilities such as gas lines, water lines, telecommunication cables, and electrical lines. They serve as crucial tools for construction, maintenance, and repair activities.
The utility markers market is witnessing significant growth due to the rising demand for efficient utility management and the increasing need for infrastructure development. As urbanization continues to expand, the need for accurate and reliable marking solutions becomes more crucial.
Traditional marking methods, such as paint and flags, have limitations in terms of durability, visibility, and longevity. Utility markers, on the other hand, provide long-lasting visibility and durability, thus ensuring that utility lines remain visible and safe over time. These markers are designed to withstand extreme weather conditions, thereby ensuring their effectiveness even in harsh environments.
Market Dynamics:
The utility markers market is driven by several factors. Growing concern for worker safety and regulatory compliance is propelling the demand for utility markers. These markers help in minimizing accidents and injuries by providing clear visibility of utility lines, thus reducing the risk of accidental damage or excavation.
Increasing investment in infrastructure development is boosting the demand for utility markers. With the expansion of urban areas and the construction of new buildings, there is a need for accurate and reliable utility marking solutions to ensure efficient and safe construction processes.
Opportunities in the utility markers market lie in the development of advanced marking technologies. The integration of GPS tracking and remote monitoring capabilities in utility markers provides enhanced accuracy and real-time information about utility line locations. This innovation presents significant growth prospects for the market.
However, high initial costs associated with marker installation and periodic replacements needed hinder the market potential. On the other hand, ongoing research and development (R&D) towards developing long-life markers with improved visibility is creating new opportunities. Marker manufacturers are also focusing on eco-friendly composite materials to reduce environmental footprint.
Key Features of the Study:
This report provides an in-depth analysis of the utility markers market, including market size (US$ Bn) and compound annual growth rate (CAGR %) for the forecast period (2025-2032), with 2024 as the base year
It highlights potential revenue opportunities across different segments and explains attractive investment propositions
The study offers key insights into market drivers, restraints, opportunities, new product launches or approvals, market trends, regional outlook, and competitive strategies adopted by key players
Key players in the global utility markers market are profiled based on company highlights, product portfolio, key highlights, financial performance, and strategies
The report covers key companies such as 3M, Utility Marking Services Inc., Gecko Group, Raychem RPG, SAE Systems, Subsite Electronics, Tempo Communications, Cable Detection Ltd., Rhino Marking & Protection Systems, Radiodetection Ltd., Ridgid, Leica Geosystem, USIC, Crafco Inc., Seba Dynatrac, Berntsen International, Musco Lighting, Cooper Industries, H.D. Electric Company, and Streamlight
Insights from this report will enable marketers and management authorities to make informed decisions regarding product launches, upgrades, market expansion, and marketing tactics
The report caters to various stakeholders in the utility markers market, including investors, suppliers, product manufacturers, distributors, new entrants, and financial analysts
Stakeholders will benefit from various strategy matrices used in analyzing the utility markers market, facilitating ease in decision-making.
Detailed Segmentation:
- Utility Markers Market, By Product Type
- Marker Balls
- Marker Tapes
- Marker Flags
- Marker Posts
- Others
- Utility Markers Market, By End User
- Electricity
- Oil & Gas
- Telecommunication
- Water & Sewage
- Transportation
- Others
- Utility Markers Market, By Technology
- Electromagnetic
- RFID
- Others
- Utility Markers Market, By Distribution Channel
- Direct Sales
- Retail Stores
- Online Channels
- Utility Markers Market, By Geography
- North America
- Europe
- Asia Pacific
- Latin America
- Middle East
- Africa
- Company Profiles
- 3M
- Utility Marking Services Inc.
- Gecko Group
- Raychem RPG
- SAE Systems
- Subsite Electronics
- Tempo Communications
- Cable Detection Ltd.
- Rhino Marking & Protection Systems
- Radiodetection Ltd.
- Ridgid
- Leica Geosystem
- USIC
- Crafco Inc.
- Seba Dynatrac
- Berntsen International
- Musco Lighting
- Cooper Industries
- D. Electric Company
- Streamlight
Table of Contents
1. Research Objectives and Assumptions
- Research Objectives
- Assumptions
- Abbreviations
2. Market Purview
- Report Description
- Market Definition and Scope
- Executive Summary
- Utility Markers Market, By Product Type
- Utility Markers Market, By End User
- Utility Markers Market, By Technology
- Utility Markers Market, By Distribution Channel
- Utility Markers Market, By Region
- Coherent Opportunity Map (COM)
3. Market Dynamics, Regulations, and Trends Analysis
- Market Dynamics
- Drivers
- Expanding utility infrastructure
- Restraints
- Lack of skilled workforce
- Opportunities
- Smart City Development
- Key Highlights
- Regulatory Scenario
- Recent Trends
- Product Launches/Approvals
- PEST Analysis
- PORTER's Analysis
- Mergers, and Acquisitions, and Collaborations
4. Utility Markers Market - Impact of Coronavirus (COVID-19) Pandemic
- COVID-19 Epidemiology
- Supply Side and Demand Side Analysis
- Economic Impact
5. Utility Markers Market, By Product Type, 2020-2032, (US$ Bn)
- Introduction
- Market Share Analysis, 2025 and 2032 (%)
- Y-o-Y Growth Analysis, 2021 - 2032
- Segment Trends
- Marker Balls
- Introduction
- Market Size and Forecast, and Y-o-Y Growth, 2020-2032,(US$ Bn)
- Marker Tapes
- Introduction
- Market Size and Forecast, and Y-o-Y Growth, 2020-2032,(US$ Bn)
- Marker Flags
- Introduction
- Market Size and Forecast, and Y-o-Y Growth, 2020-2032,(US$ Bn)
- Marker Posts
- Introduction
- Market Size and Forecast, and Y-o-Y Growth, 2020-2032,(US$ Bn)
- Others
- Introduction
- Market Size and Forecast, and Y-o-Y Growth, 2020-2032,(US$ Bn)
6. Utility Markers Market, By End User, 2020-2032, (US$ Bn)
- Introduction
- Market Share Analysis, 2025 and 2032 (%)
- Y-o-Y Growth Analysis, 2021- 2032
- Segment Trends
- Electricity
- Introduction
- Market Size and Forecast, and Y-o-Y Growth, 2020-2032,(US$ Bn)
- Oil & Gas
- Introduction
- Market Size and Forecast, and Y-o-Y Growth, 2020-2032,(US$ Bn)
- Telecommunication
- Introduction
- Market Size and Forecast, and Y-o-Y Growth, 2020-2032,(US$ Bn)
- Water & Sewage
- Introduction
- Market Size and Forecast, and Y-o-Y Growth, 2020-2032,(US$ Bn)
- Transportation
- Introduction
- Market Size and Forecast, and Y-o-Y Growth, 2020-2032,(US$ Bn)
- Others
- Introduction
- Market Size and Forecast, and Y-o-Y Growth, 2020-2032,(US$ Bn)
7. Utility Markers Market, By Technology, 2020-2032, (US$ Bn)
- Introduction
- Market Share Analysis, 2025 and 2032 (%)
- Y-o-Y Growth Analysis, 2021- 2032
- Segment Trends
- Electromagnetic
- Introduction
- Market Size and Forecast, and Y-o-Y Growth, 2020-2032,(US$ Bn)
- RFID
- Introduction
- Market Size and Forecast, and Y-o-Y Growth, 2020-2032,(US$ Bn)
- Others
- Introduction
- Market Size and Forecast, and Y-o-Y Growth, 2020-2032,(US$ Bn)
8. Utility Markers Market, By Distribution Channel, 2020-2032, (US$ Bn)
- Introduction
- Market Share Analysis, 2025 and 2032 (%)
- Y-o-Y Growth Analysis, 2021- 2032
- Segment Trends
- Direct Sales
- Introduction
- Market Size and Forecast, and Y-o-Y Growth, 2020-2032,(US$ Bn)
- Retail Stores
- Introduction
- Market Size and Forecast, and Y-o-Y Growth, 2020-2032,(US$ Bn)
- Online Channels
- Introduction
- Market Size and Forecast, and Y-o-Y Growth, 2020-2032,(US$ Bn)
9. Utility Markers Market, By Region, 2020-2032, (US$ Bn)
- Introduction
- Market Share Analysis, By Sub-region, 2025 and 2032 (%)
- Y-o-Y Growth Analysis, For Sub-region, 2021-2032
- Country Trends
- North America
- Introduction
- Market Size and Forecast, and Y-o-Y Growth, By Product Type, 2020-2032,(US$ Bn)
- Market Size and Forecast, and Y-o-Y Growth, By End User, 2020-2032,(US$ Bn)
- Market Size and Forecast, and Y-o-Y Growth, By Technology, 2020-2032,(US$ Bn)
- Market Size and Forecast, and Y-o-Y Growth, By Distribution Channel, 2020-2032,(US$ Bn)
- Market Size and Forecast, and Y-o-Y Growth, By Country, 2020-2032,(US$ Bn)
- U.S.
- Canada
- Europe
- Introduction
- Market Size and Forecast, and Y-o-Y Growth, By Product Type, 2020-2032,(US$ Bn)
- Market Size and Forecast, and Y-o-Y Growth, By End User, 2020-2032,(US$ Bn)
- Market Size and Forecast, and Y-o-Y Growth, By Technology, 2020-2032,(US$ Bn)
- Market Size and Forecast, and Y-o-Y Growth, By Distribution Channel, 2020-2032,(US$ Bn)
- Market Size and Forecast, and Y-o-Y Growth, By Country, 2020-2032,(US$ Bn)
- Germany
- U.K.
- Spain
- France
- Italy
- Russia
- Rest of Europe
- Asia Pacific
- Introduction
- Market Size and Forecast, and Y-o-Y Growth, By Product Type, 2020-2032,(US$ Bn)
- Market Size and Forecast, and Y-o-Y Growth, By End User, 2020-2032,(US$ Bn)
- Market Size and Forecast, and Y-o-Y Growth, By Technology, 2020-2032,(US$ Bn)
- Market Size and Forecast, and Y-o-Y Growth, By Distribution Channel, 2020-2032,(US$ Bn)
- Market Size and Forecast, and Y-o-Y Growth, By Country, 2020-2032,(US$ Bn)
- China
- India
- Japan
- Australia
- South Korea
- ASEAN
- Rest of Asia Pacific
- Latin America
- Introduction
- Market Size and Forecast, and Y-o-Y Growth, By Product Type, 2020-2032,(US$ Bn)
- Market Size and Forecast, and Y-o-Y Growth, By End User, 2020-2032,(US$ Bn)
- Market Size and Forecast, and Y-o-Y Growth, By Technology, 2020-2032,(US$ Bn)
- Market Size and Forecast, and Y-o-Y Growth, By Distribution Channel, 2020-2032,(US$ Bn)
- Market Size and Forecast, and Y-o-Y Growth, By Country, 2020-2032,(US$ Bn)
- Brazil
- Argentina
- Mexico
- Rest of Latin America
- Middle East & Africa
- Introduction
- Market Size and Forecast, and Y-o-Y Growth, By Product Type, 2020-2032,(US$ Bn)
- Market Size and Forecast, and Y-o-Y Growth, By End User, 2020-2032,(US$ Bn)
- Market Size and Forecast, and Y-o-Y Growth, By Technology, 2020-2032,(US$ Bn)
- Market Size and Forecast, and Y-o-Y Growth, By Distribution Channel, 2020-2032,(US$ Bn)
- Market Size and Forecast, and Y-o-Y Growth, By Country/Sub-region, 2020-2032,(US$ Bn)
- GCC Countries
- Israel
- South Africa
- Rest of Middle East
10. Competitive Landscape
- Compnay Profile3M
- Company Highlights
- Product Portfolio
- Key Developments
- Financial Performance
- Strategies
- Utility Marking Services Inc.
- Gecko Group
- Raychem RPG
- SAE Systems
- Subsite Electronics
- Tempo Communications
- Cable Detection Ltd.
- Rhino Marking & Protection Systems
- Radiodetection Ltd.
- Ridgid
- Leica Geosystem
- USIC
- Crafco Inc.
- Seba Dynatrac
- Berntsen International
- Musco Lighting
- Cooper Industries
- D. Electric Company
- Streamlight
- Analyst Views
11. Section
- References
- Research Methodology
- About us

