
PUBLISHER: Coherent Market Insights | PRODUCT CODE: 1708820

PUBLISHER: Coherent Market Insights | PRODUCT CODE: 1708820
Emissions Trading Market, By Type Of Trading, By End Use, By Geography
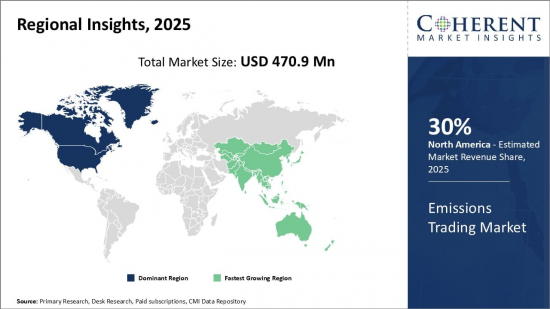
Global Emissions Trading Market is estimated to be valued at USD 470.9 Mn in 2025 and is expected to reach USD 1,554.1 Mn by 2032, growing at a compound annual growth rate (CAGR) of 18.6% from 2025 to 2032.
| Report Coverage | Report Details | ||
|---|---|---|---|
| Base Year: | 2024 | Market Size in 2025: | USD 470.9 Mn |
| Historical Data for: | 2020 To 2024 | Forecast Period: | 2025 To 2032 |
| Forecast Period 2025 to 2032 CAGR: | 18.60% | 2032 Value Projection: | USD 1,554.1 Mn |
Emissions trading, also known as cap-and-trade, is a market-based approach to controlling greenhouse gas emissions. It operates under the premise of setting a cap on the total allowable emissions from specific industries or regions. Companies are allocated emission allowances corresponding to their permitted emission levels. If a company emits below its allotted amount, it can sell the surplus allowances to other companies exceeding their emissions limits. This system incentivizes emissions reductions as companies strive to maintain compliance while providing flexibility in achieving emission targets. Emissions trading has gained prominence globally as a crucial tool in addressing climate change, fostering cooperation among industries, and encouraging investment in cleaner technologies.
The emissions trading market has witnessed significant growth in recent years, spurred by mounting environmental concerns and international efforts to combat climate change. Various regions, including the European Union, China, and parts of the U.S., have implemented emissions trading systems to regulate greenhouse gas emissions effectively. Additionally, the voluntary carbon market has emerged, enabling businesses and individuals to offset their carbon footprint voluntarily. As more countries and companies commit to reducing their carbon emissions, the emissions trading market is likely to continue expanding, playing a vital role in the global transition towards a more sustainable and climate-conscious future.
The European Union Emissions Trading System (EU ETS) is the largest carbon market in the world, accounting for around 90% of global carbon credit trading volume. The EU ETS is expected to continue to grow in the coming years, as the European Union commits to reducing its greenhouse gas emissions by 55% by 2030.
Market Dynamics:
Environmental concerns and climate change mitigation, regulatory compliance and international commitments are anticipated to drive growth of the global emissions trading market over the forecast period. Moreover, economic efficiency and cost-effectiveness, stimulating clean technologies and innovation is also expected to boost the growth of the emissions trading market over the forecast period. Expansion of emissions trading schemes, linking emissions trading systems, inclusion of new greenhouse gases, and market-based solutions for net-zero goals are expected to create growth opportunities for the emissions trading market during the forecast period.
However, political and policy uncertainty, insufficient stringency, market manipulation and price volatility are expected to hamper growth of the emissions trading market over the forecast period.
Key features of the study:
- This report provides in-depth analysis of the emissions trading market, and provides market size (US$ Mn) and compound annual growth rate (CAGR %) for the forecast period (2025-2032), considering 2024 as the base year.
- It elucidates potential revenue opportunities across different segments and explains attractive investment proposition matrices for this market.
- This study also provides key insights about market drivers, restraints, opportunities, new product launches or approval, market trends, regional outlook, and competitive strategies adopted by key players.
- It profiles key players in the emissions trading market based on the following parameters - company highlights, products portfolio, key highlights, financial performance, and strategies.
- Key companies covered as a part of this study include BP Plc., Royal Dutch Shell Plc., Total SE, Chevron Corporation, ExxonMobil Corporation, Engie SA, RWE AG, EON SE, Vattenfall AB, Gazprom, Mitsubishi UFJ Financial Group (MUFG), JPMorgan Chase & Co., Goldman Sachs Group, Inc. Citigroup Inc., and Barclays PLC Insights from this report would allow marketers and the management authorities of the companies to make informed decisions regarding their future product launches, type up-gradation, market expansion, and marketing tactics.
- The emissions trading market report caters to various stakeholders in this industry including investors, suppliers, product manufacturers, distributors, new entrants, and financial analysts.
- Stakeholders would have ease in decision-making through various strategy matrices used in analyzing the emissions trading market.
Detailed Segmentation:
- Emissions Trading Market Segmentation, By Trading Type:
- Cap-and-Trade
- Baseline-and-Credit
- Emissions Trading Market Segmentation, By End Use:
- Energy
- Power Generation
- Industrial
- Transportation
- Agriculture
- Emissions Trading Market Segmentation, By Region:
- North America
- Europe
- Asia Pacific
- Latin America
- Middle East
- Africa
- Company Profiles
- BP Plc.
- Royal Dutch Shell Plc.
- Total SE
- Chevron Corporation
- ExxonMobil Corporation
- Engie SA
- RWE AG
- ON SE
- Vattenfall AB
- Gazprom
- Mitsubishi UFJ Financial Group (MUFG)
- JPMorgan Chase & Co
- Citigroup Inc.
- Barclays PLC
- Goldman Sachs Group, Inc.
Table of Contents
1. Research Objectives and Assumptions
- Research Objectives
- Assumptions
- Abbreviations
2. Market Purview
- Report Description
- Market Definition and Scope
- Executive Summary
- Emissions Trading Market, By Trading Type
- Emissions Trading Market, By End Use
- Emissions Trading Market, By Region
- Coherent Opportunity Map (COM)
3. Market Dynamics, Regulations, and Trends Analysis
- Market Dynamics
- Drivers
- Environmental concerns and climate change mitigation
- Regulatory compliance and international commitments
- Economic efficiency and cost-effectiveness
- Stimulating clean technologies and innovation
- Restraints
- Lack of commitment by large emitters
- Prevalence of free allocation of emissions allowances
- Carbon leakage risk
- Opportunities
- Expansion of emissions trading schemes
- Linking emissions trading systems
- Inclusion of new greenhouse gases
- Market-based solutions for net-Zero goals
- Key Highlights
- Regulatory Scenario
- Recent Trends
- Product Launches/Approvals
- PEST Analysis
- PORTER's Analysis
- Mergers, Acquisitions, and Collaborations
4. Emissions Trading Market, By Trading Type, 2020-2032, (US$ Mn)
- Introduction
- Market Share Analysis, 2025 and 2032 (%)
- Y-o-Y Growth Analysis, 2021 - 2032
- Segment Trends
- Cap-and-Trade
- Introduction
- Market Size and Forecast, and Y-o-Y Growth, 2020-2032,(US$ Mn)
- Baseline-and-Credit
- Introduction
- Market Size and Forecast, and Y-o-Y Growth, 2020-2032,(US$ Mn)
5. Emissions Trading Market, By End Use, 2020-2032, (US$ Mn)
- Introduction
- Market Share Analysis, 2025 and 2032 (%)
- Y-o-Y Growth Analysis, 2021 - 2032
- Segment Trends
- Energy
- Introduction
- Market Size and Forecast, and Y-o-Y Growth, 2020-2032, (US$ Million)
- Power Generation
- Introduction
- Market Size and Forecast, and Y-o-Y Growth, 2020-2032, (US$ Million)
- Industrial
- Introduction
- Market Size and Forecast, and Y-o-Y Growth, 2020-2032, (US$ Million)
- Transportation
- Introduction
- Market Size and Forecast, and Y-o-Y Growth, 2020-2032, (US$ Million)
- Agriculture
- Introduction
- Market Size and Forecast, and Y-o-Y Growth, 2020-2032, (US$ Million)
6. Emission Trading Market, By Region, 2020-2032, (US$ Mn)
- Introduction
- Market Share Analysis, By Sub-region, 2025 and 2032 (%)
- Y-o-Y Growth Analysis, For Sub-region, 2021 - 2032
- Segment Trends
- North America
- Introduction
- Market Size and Forecast, and Y-o-Y Growth, By Trading Type , 2020-2032,(US$ Mn)
- Market Size and Forecast, and Y-o-Y Growth, By End Use, 2020-2032,(US$ Mn)
- Market Size and Forecast, and Y-o-Y Growth, By Country, 2020-2032,(US$ Mn)
- U.S.
- Canada
- Europe
- Introduction
- Market Size and Forecast, and Y-o-Y Growth, By Trading Type , 2020-2032,(US$ Mn)
- Market Size and Forecast, and Y-o-Y Growth, By End Use, 2020-2032,(US$ Mn)
- Market Size and Forecast, and Y-o-Y Growth, By Country, 2020-2032,(US$ Mn)
- Germany
- U.K.
- Spain
- France
- Italy
- Russia
- Rest of Europe
- Asia Pacific
- Introduction
- Market Size and Forecast, and Y-o-Y Growth, By Trading Type , 2020-2032,(US$ Mn)
- Market Size and Forecast, and Y-o-Y Growth, By End Use, 2020-2032,(US$ Mn)
- Market Size and Forecast, and Y-o-Y Growth, By Country, 2020-2032,(US$ Mn)
- China
- India
- Japan
- Australia
- South Korea
- ASEAN
- Rest of Asia Pacific
- Latin America
- Introduction
- Market Size and Forecast, and Y-o-Y Growth, By Trading Type , 2020-2032,(US$ Mn)
- Market Size and Forecast, and Y-o-Y Growth, By End Use, 2020-2032,(US$ Mn)
- Market Size and Forecast, and Y-o-Y Growth, By Country, 2020-2032,(US$ Mn)
- Brazil
- Argentina
- Mexico
- Rest of Latin America
- Middle East & Africa
- Introduction
- Market Size and Forecast, and Y-o-Y Growth, By Trading Type , 2020-2032,(US$ Mn)
- Market Size and Forecast, and Y-o-Y Growth, By End Use, 2020-2032,(US$ Mn)
- Market Size and Forecast, and Y-o-Y Growth, By Country, 2020-2032,(US$ Mn)
- GCC Countries
- Israel
- South Africa
- North Africa
- Central Africa
- Rest of Middle East
7. Competitive Landscape
- Company Profile
- BP Plc.
- Company Highlights
- Product Portfolio
- Key Developments
- Financial Performance
- Strategies
- Royal Dutch Shell Plc
- Company Highlights
- Product Portfolio
- Key Highlights
- Financial Performance
- Strategies
- Total SE
- Company Highlights
- Product Portfolio
- Key Highlights
- Financial Performance
- Strategies
- Chevron Corporation
- Company Highlights
- Product Portfolio
- Key Highlights
- Financial Performance
- Strategies
- ExxonMobil Corporation
- Company Highlights
- Product Portfolio
- Key Highlights
- Financial Performance
- Strategies
- Engie SA
- Company Highlights
- Product Portfolio
- Key Highlights
- Financial Performance
- Strategies
- RWE AG
- Company Highlights
- Product Portfolio
- Key Highlights
- Financial Performance
- Strategies
- ON SE
- Company Highlights
- Product Portfolio
- Key Highlights
- Financial Performance
- Strategies
- Vattenfall AB
- Company Highlights
- Product Portfolio
- Key Highlights
- Financial Performance
- Strategies
- Gazprom
- Company Highlights
- Product Portfolio
- Key Highlights
- Financial Performance
- Strategies
- Mitsubishi UFJ Financial Group (MUFG)
- Company Highlights
- Product Portfolio
- Key Highlights
- Financial Performance
- Strategies
- JPMorgan Chase & Co.
- Company Highlights
- Product Portfolio
- Key Highlights
- Financial Performance
- Strategies
- Goldman Sachs Group, Inc.
- Company Highlights
- Product Portfolio
- Key Highlights
- Financial Performance
- Strategies
- Citigroup Inc.
- Company Highlights
- Product Portfolio
- Key Highlights
- Financial Performance
- Strategies
- Barclays PLC
- Company Highlights
- Product Portfolio
- Key Highlights
- Financial Performance
- Strategies
- Analyst Views
8. Section
- References
- Research Methodology
- About us

