
PUBLISHER: Global Market Insights Inc. | PRODUCT CODE: 1876801

PUBLISHER: Global Market Insights Inc. | PRODUCT CODE: 1876801
Data Center Cooling Market Opportunity, Growth Drivers, Industry Trend Analysis, and Forecast 2025 - 2034
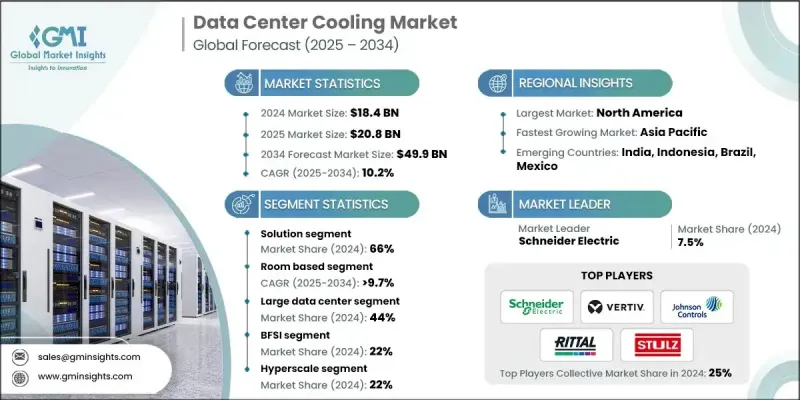
The Global Data Center Cooling Market was valued at USD 18.4 billion in 2024 and is estimated to grow at a CAGR of 10.2% to reach USD 49.9 billion by 2034.
Rising AI and high-performance computing (HPC) workloads are driving a transition from traditional air-based cooling to advanced liquid cooling solutions. Direct-to-chip and immersion cooling technologies are increasingly managing rack densities of 50 to 120 kW, allowing modern data centers to handle the latest compute infrastructure. Edge data centers, operating in varied environments, require flexible thermal management to maintain reliability in compact and remote spaces. With rack power densities nearly doubling from 5 kW to 8-10 kW, conventional air-based systems can no longer meet demand, prompting hyperscale and enterprise facilities to adopt liquid-based solutions. Direct-to-chip liquid cooling is emerging as a preferred method, ensuring stable temperatures for high-wattage CPUs and GPUs while reducing energy consumption and enhancing system reliability.
| Market Scope | |
|---|---|
| Start Year | 2024 |
| Forecast Year | 2025-2034 |
| Start Value | $18.4 Billion |
| Forecast Value | $49.9 Billion |
| CAGR | 10.2% |
The solutions segment held a 66% share in 2024 and is expected to grow at a CAGR of 10.4% through 2034. This growth is fueled by investments in next-generation liquid cooling systems capable of supporting high-density AI and HPC workloads, driving infrastructure expenditure and advanced heat management adoption.
The room-based cooling segment held a 76.4% share in 2024 and is projected to grow at a CAGR of 9.7% through 2034. Modern room-based systems now integrate AI-assisted optimization, variable-speed fans, and containment solutions, enabling real-time airflow adjustments and energy efficiency improvements. These innovations extend system lifespan and improve overall sustainability and reliability.
U.S. Data Center Cooling Market held a 89% share and generated USD 6.3 billion in 2024. Rising heat densities from AI workloads have accelerated the adoption of liquid and immersion cooling, as operators upgrade facilities to manage rack densities above 80 kW, particularly in large-scale campus environments.
Key players in the Data Center Cooling Market include Emerson Network Power, Johnson Controls, Vertiv, Schneider Electric, Motivair, Stulz, Degree Controls, Rittal, Airedale International, and Coolcentric. Companies in the Data Center Cooling Market are employing multiple strategies to strengthen their market presence. They are investing in R&D to develop high-efficiency liquid and immersion cooling technologies capable of handling extreme heat densities. Partnerships with hyperscale and enterprise data center operators help expand the adoption of advanced cooling solutions. Firms are also enhancing AI-based optimization tools for real-time energy management. Strategic mergers and acquisitions allow players to broaden their technology portfolios and geographic footprint.
Table of Contents
Chapter 1 Methodology
- 1.1 Market scope and definition
- 1.2 Research design
- 1.2.1 Research approach
- 1.2.2 Data collection methods
- 1.3 Data mining sources
- 1.3.1 Global
- 1.3.2 Regional/Country
- 1.4 Base estimates and calculations
- 1.4.1 Base year calculation
- 1.4.2 Key trends for market estimation
- 1.5 Primary research and validation
- 1.5.1 Primary sources
- 1.6 Forecast model
- 1.7 Research assumptions and limitations
Chapter 2 Executive Summary
- 2.1 Industry 3600 synopsis, 2021 - 2034
- 2.2 Key market trends
- 2.2.1 Regional
- 2.2.2 Component
- 2.2.3 Cooling technique
- 2.2.4 Data center size
- 2.2.5 Application
- 2.2.6 Data center
- 2.3 TAM Analysis, 2025-2034
- 2.4 CXO perspectives: Strategic imperatives
- 2.4.1 Executive decision points
- 2.4.2 Critical success factors
- 2.5 Future outlook and strategic recommendations
Chapter 3 Industry Insights
- 3.1 Industry ecosystem analysis
- 3.1.1 Supplier landscape
- 3.1.2 Profit margin analysis
- 3.1.3 Cost structure
- 3.1.4 Value addition at each stage
- 3.1.5 Factor affecting the value chain
- 3.1.6 Disruptions
- 3.2 Industry impact forces
- 3.2.1 Growth drivers
- 3.2.1.1 Increasing deployment of high-density AI and HPC workloads
- 3.2.1.2 Growing focus on sustainability and energy efficiency
- 3.2.1.3 Rising data center capacity expansions in emerging regions
- 3.2.1.4 Integration of DCIM and AI-based cooling optimization
- 3.2.2 Industry pitfalls & challenges
- 3.2.2.1 High upfront cost and retrofit challenges
- 3.2.2.2 Complexity in managing liquid cooling infrastructure
- 3.2.2.3 Rising environmental regulations on refrigerants
- 3.2.3 Market opportunities
- 3.2.3.1 Growth of hyperscale and colocation facilities in APAC and MEA
- 3.2.3.2 Integration of AI-driven thermal management
- 3.2.3.3 Shift toward modular, prefabricated data centers
- 3.2.1 Growth drivers
- 3.3 Growth potential analysis
- 3.4 Regulatory landscape
- 3.4.1 North America
- 3.4.2 Europe
- 3.4.3 Asia Pacific
- 3.4.4 South America
- 3.4.5 Middle East & Africa
- 3.5 Porter's analysis
- 3.6 PESTEL analysis
- 3.7 Technology and Innovation landscape
- 3.7.1 Current technological trends
- 3.7.2 Emerging technologies
- 3.8 Price trends
- 3.8.1 By region
- 3.8.2 By Products
- 3.9 Cost breakdown analysis
- 3.10 Patent analysis
- 3.11 Sustainability and environmental aspects
- 3.11.1 Sustainable practices
- 3.11.2 Waste reduction strategies
- 3.11.3 Energy efficiency in production
- 3.11.4 Eco-friendly initiatives
- 3.11.5 Carbon footprint considerations
- 3.11.6 Market Maturity & Adoption Analysis
- 3.12 Future trends & market disruptions
- 3.12.1 Artificial intelligence integration in cooling
- 3.12.2 Quantum computing cooling requirements
- 3.12.3 Sustainable & green cooling technologies
- 3.12.4 Modular & prefabricated cooling solutions
- 3.12.5 Waste heat recovery & reuse systems
- 3.12.6 Advanced materials & nanotechnology
- 3.12.7 Autonomous cooling system management
- 3.12.8 Blockchain & distributed computing impact
- 3.12.9. 6 G infrastructure cooling requirements
- 3.13 Data center cooling market dynamics & gap analysis
- 3.13.1 Power density trends and cooling requirements
- 3.13.2 Cooling technology migration patterns
- 3.13.3 Market gap analysis
- 3.13.4 Energy efficiency and sustainability imperatives
- 3.13.5 Mechanical systems evolution in data centers
- 3.14 Strategic R&D & market alignment framework
- 3.14.1 R&D investment priorities for HVAC companies
- 3.14.2 Market alignment strategies and frameworks
- 3.14.3 Advanced solutions development pathway
- 3.14.4 Partnership and ecosystem development
- 3.14.5 Implementation roadmap
- 3.15 Investment analysis & market opportunities
- 3.15.1 Investment landscape overview
- 3.15.2 Venture capital & private equity activity
- 3.15.3 Strategic investment opportunities
- 3.15.4 Market entry strategies
- 3.15.5 Technology licensing opportunities
- 3.15.6 Geographic expansion strategies
- 3.15.7 Investment return analysis
- 3.15.8 Future investment trends
- 3.16 Power Usage Effectiveness (PUE) trends and analysis
- 3.16.1 Introduction to PUE and its importance
- 3.16.2 Average PUE benchmarks by data center type
- 3.16.3 Impact of cooling technologies on PUE
- 3.16.4 PUE optimization strategies and ai-driven controls
- 3.16.5 Regional and regulatory implications for PUE standards
Chapter 4 Competitive Landscape, 2024
- 4.1 Introduction
- 4.2 Company market share analysis
- 4.2.1 North America
- 4.2.2 Europe
- 4.2.3 Asia Pacific
- 4.2.4 South America
- 4.2.5 MEA
- 4.3 Competitive analysis of major market players
- 4.4 Competitive positioning matrix
- 4.5 Strategic outlook matrix
- 4.6 Key developments
- 4.6.1 Mergers & acquisitions
- 4.6.2 Partnerships & collaborations
- 4.6.3 New Product Launches
- 4.6.4 Expansion Plans and funding
Chapter 5 Market Estimates & Forecast, By Component, 2021-2034 ($Bn, Units)
- 5.1 Key trends
- 5.2 Solution
- 5.2.1 Air conditioner
- 5.2.1.1 Air handling units
- 5.2.1.2 Split air conditioning systems
- 5.2.1.3 Packaged air conditioning units (PAC)
- 5.2.1.4 Others
- 5.2.2 Chilling unit
- 5.2.2.1 Air-cooled chillers
- 5.2.2.2 Water-cooled chillers
- 5.2.2.3 Glycol-cooled chillers
- 5.2.3 Cooling tower
- 5.2.3.1 Evaporative cooling
- 5.2.3.2 Dry
- 5.2.3.3 Others
- 5.2.4 Control system
- 5.2.4.1 Economizer system
- 5.2.4.2 Condensing
- 5.2.4.3 Non-condensing
- 5.2.5 Liquid cooling system
- 5.2.5.1 Direct to chip
- 5.2.5.2 Immersive
- 5.2.5.2.1 Single phase
- 5.2.5.2.2 Two phase
- 5.2.5.3 Others
- 5.2.1 Air conditioner
- 5.3 Service
- 5.3.1 Consulting
- 5.3.2 Maintenance and support
- 5.3.3 Installation and deployment
Chapter 6 Market Estimates & Forecast, By Cooling Technique, 2021-2034 ($Bn)
- 6.1 Key trends
- 6.2 Rack/row based
- 6.3 Room based
Chapter 7 Market Estimates & Forecast, By Data Center Size, 2021-2034 ($Bn, Units)
- 7.1 Key trends
- 7.2 Small data center
- 7.3 Medium data center
- 7.4 Large data center
Chapter 8 Market Estimates & Forecast, By Application, 2021-2034 ($Bn, Units)
- 8.1 Key trends
- 8.2 BFSI
- 8.3 Colocation
- 8.4 Energy
- 8.5 Government
- 8.6 Healthcare
- 8.7 Manufacturing
- 8.8 IT & Telecom
- 8.9 Others
Chapter 9 Market Estimates & Forecast, By Data Center, 2021-2034 ($Bn, Units)
- 9.1 Key trends
- 9.2 Hyperscale
- 9.3 Colocation
- 9.4 Enterprise
- 9.5 Edge
- 9.6 Cloud
Chapter 10 Market Estimates & Forecast, By Region, 2021 - 2034 ($Bn, Units)
- 10.1 Key trends
- 10.2 North America
- 10.2.1 US
- 10.2.2 Canada
- 10.2.3 Mexico
- 10.3 Europe
- 10.3.1 Germany
- 10.3.2 UK
- 10.3.3 France
- 10.3.4 Italy
- 10.3.5 Spain
- 10.3.6 Russia
- 10.3.7 Nordics
- 10.3.8 Poland
- 10.3.9 Benelux
- 10.4 Asia Pacific
- 10.4.1 China
- 10.4.2 India
- 10.4.3 Japan
- 10.4.4 Australia
- 10.4.5 South Korea
- 10.4.6 Southeast Asia
- 10.4.6.1 Brunei
- 10.4.6.2 Cambodia
- 10.4.6.3 Indonesia
- 10.4.6.4 Laos
- 10.4.6.5 Malaysia
- 10.4.6.6 Myanmar
- 10.4.6.7 Philippines
- 10.4.6.8 Singapore
- 10.4.6.9 Thailand
- 10.4.6.10 Timor-Leste
- 10.4.6.11 Vietnam
- 10.5 South America
- 10.5.1 Brazil
- 10.5.2 Argentina
- 10.5.3 Colombia
- 10.5.4 Chile
- 10.6 MEA
- 10.6.1 South Africa
- 10.6.2 Saudi Arabia
- 10.6.3 UAE
Chapter 11 Company Profiles
- 11.1 Global Players
- 11.1.1 Carrier Global
- 11.1.2 Daikin Industries
- 11.1.3 Emerson Electric
- 11.1.4 Honeywell International
- 11.1.5 Johnson Controls
- 11.1.6 Mitsubishi
- 11.1.7 Schneider Electric
- 11.1.8 Siemens
- 11.1.9 Trane Technologies
- 11.1.10 Vertiv
- 11.2 Regional Players
- 11.2.1 Airedale International
- 11.2.2 Asetek
- 11.2.3 Coolcentric
- 11.2.4 CoolIT Systems
- 11.2.5 Green Revolution Cooling (GRC)
- 11.2.6 LiquidStack
- 11.2.7 Motivair
- 11.2.8 Rittal
- 11.2.9 STULZ
- 11.2.10 Submer Technologies
- 11.3 Emerging Players
- 11.3.1 Boyd
- 11.3.2 Chilldyne
- 11.3.3 ExaScaler
- 11.3.4 Hardcore Computer
- 11.3.5 Iceotope Technologies
- 11.3.6 Kaltra
- 11.3.7 Midas Green Technologies
- 11.3.8 Phononic
- 11.3.9 TMGcore
- 11.3.10 ZutaCore

