
PUBLISHER: Global Market Insights Inc. | PRODUCT CODE: 1844366

PUBLISHER: Global Market Insights Inc. | PRODUCT CODE: 1844366
U.S. Variable Frequency Drives Market Opportunity, Growth Drivers, Industry Trend Analysis, and Forecast 2025 - 2034
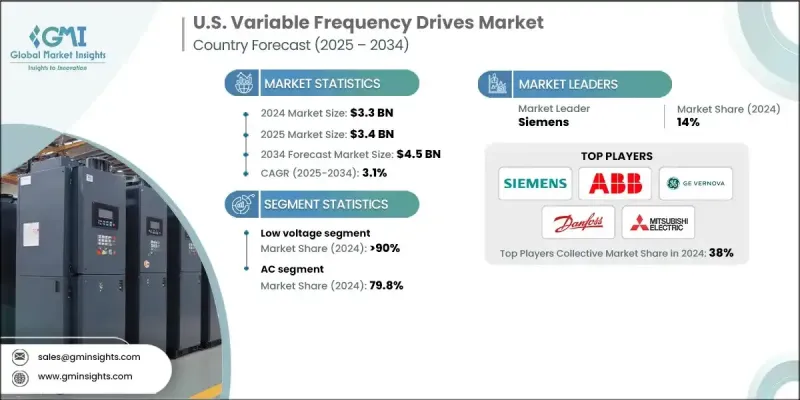
U.S. Variable Frequency Drives Market was valued at USD 3.3 billion in 2024 and is estimated to grow at a CAGR of 3.1% to reach USD 4.5 billion by 2034.
The growth is driven by the rapid integration of automation and smart technologies across diverse industries seeking precision, speed control, and greater energy efficiency. As industrial infrastructure continues to evolve, there is growing emphasis on deploying intelligent mechanical systems that support real-time monitoring and scalable operations. The rising adoption of VFDs stems from their ability to reduce power usage, optimize performance, and align with sustainability goals. Demand is also being propelled by increased consumer spending and a notable industry shift toward efficient and cost-effective solutions. By adjusting motor speeds based on load conditions, VFDs lower operational costs, extend equipment lifespan, and significantly cut emissions. These capabilities make them an essential part of modern industrial systems, helping companies meet both performance and regulatory benchmarks while positioning themselves for long-term operational resilience and growth.
| Market Scope | |
|---|---|
| Start Year | 2024 |
| Forecast Year | 2025-2034 |
| Start Value | $3.3 billion |
| Forecast Value | $4.5 billion |
| CAGR | 3.1% |
In 2024, the low voltage drives segment generated USD 3 billion. This segment benefits from a broad selection of product offerings and strict safety and efficiency standards guiding installation and use. These regulations, alongside advancements in product development, continue to push market growth.
The AC variable frequency drive segment held 79.8% share in 2024 and is expected to grow at a CAGR of 3.4% through 2034. The growing popularity of AC drives is linked to their adaptability across a wide range of load conditions and industries. Their use enhances motor speed regulation and ensures alignment with specific operational parameters, boosting system performance across various sectors. These characteristics make AC drives an essential choice for modern manufacturing and processing applications.
The servo drive segment reached USD 270 million in 2024. This segment is gaining rapid momentum as industries pursue advanced digital transformation strategies and prioritize precise, high-speed motor control. Ongoing updates to machinery and tighter energy efficiency mandates are reinforcing the need for servo drives. They are becoming indispensable for industrial setups focused on smarter, automated, and sustainable operations, where real-time performance optimization is essential.
Key companies competing in the U.S. Variable Frequency Drives Market include Schneider Electric, Yaskawa America, Inc., Beckhoff Automation, Franklin Electric Co., Inc., Fuji Electric Corp. of America, Hitachi Industrial Equipment & Solutions America, LLC, Bosch Rexroth Corporation, Danfoss, Mitsubishi Electric Automation Inc., Honeywell International, Inc., Rockwell Automation, Johnson Controls, Eaton, WEG, Siemens, Nidec Motor Corporation, ABB, GE Vernova, Applied Motion Products, Inc., and Emerson Electric Co. Leading players in the U.S. variable frequency drives market are focusing on continuous product innovation to boost efficiency, precision, and system integration. These companies are investing heavily in R&D to introduce compact, energy-efficient, and IoT-enabled VFD solutions tailored to evolving industrial demands. Strategic collaborations with automation providers, expansion of smart manufacturing portfolios, and the integration of AI and predictive maintenance capabilities are helping firms enhance value for end-users.
Table of Contents
Chapter 1 Methodology & Scope
- 1.1 Research design
- 1.2 Market estimates & forecast parameters
- 1.3 Forecast calculation
- 1.4 Data sources
- 1.4.1 Primary
- 1.4.2 Secondary
- 1.4.2.1 Paid
- 1.4.2.2 Public
- 1.5 Market definitions
Chapter 2 Executive Summary
- 2.1 Industry synopsis, 2021 - 2034
- 2.2 Business trends
- 2.3 Voltage trends
- 2.4 Drive trends
- 2.5 Application trends
- 2.6 End Use trends
Chapter 3 Industry Insights
- 3.1 Industry ecosystem analysis
- 3.1.1 Raw material availability & sourcing analysis
- 3.1.2 Key factors affecting the value chain
- 3.1.3 Disruptions
- 3.2 Regulatory landscape
- 3.3 Industry impact forces
- 3.3.1 Growth drivers
- 3.3.2 Industry pitfalls & challenges
- 3.4 Growth potential analysis
- 3.5 Porter's analysis
- 3.5.1 Bargaining power of suppliers
- 3.5.2 Bargaining power of buyers
- 3.5.3 Threat of new entrants
- 3.5.4 Threat of substitutes
- 3.6 PESTEL analysis
- 3.6.1 Political factors
- 3.6.2 Economic factors
- 3.6.3 Social factors
- 3.6.4 Technological factors
- 3.6.5 Legal factors
- 3.6.6 Environmental factors
- 3.7 Cost structure breakdown of variable frequency drives
- 3.8 Price trend analysis (USD/Unit)
- 3.8.1 By drive
- 3.9 Emerging opportunities & trends
- 3.9.1 Digital transformation with IoT technologies
- 3.9.2 Emerging market penetration
- 3.10 Investment analysis & future outlook
Chapter 4 Competitive Landscape, 2025
- 4.1 Introduction
- 4.2 Company market share analysis, 2024
- 4.3 Strategic initiatives
- 4.3.1 Key partnerships & collaborations
- 4.3.2 Major M&A activities
- 4.3.3 Product innovations & launches
- 4.3.4 Market expansion strategies
- 4.4 Competitive benchmarking
- 4.5 Strategic dashboard
- 4.6 Innovation & sustainability landscape
Chapter 5 Market Size and Forecast, By Voltage, 2021 - 2034 (USD Million & ‘000 Units)
- 5.1 Key trends
- 5.2 Low
- 5.3 Medium
Chapter 6 Market Size and Forecast, By Drive, 2021 - 2034 (USD Million & ‘000 Units)
- 6.1 Key trends
- 6.2 AC
- 6.3 DC
- 6.4 Servo
Chapter 7 Market Size and Forecast, By Application, 2021 - 2034 (USD Million & ‘000 Units)
- 7.1 Key trends
- 7.2 Pump
- 7.3 Fan
- 7.4 Conveyor
- 7.5 Compressor
- 7.6 Extruder
- 7.7 Others
Chapter 8 Market Size and Forecast, By End Use, 2021 - 2034 (USD Million & ‘000 Units)
- 8.1 Key trends
- 8.2 Oil & Gas
- 8.3 Power Generation
- 8.4 Mining & Metals
- 8.5 Pulp & Paper
- 8.6 Marine
- 8.7 Others
Chapter 9 Company Profiles
- 9.1 ABB
- 9.2 Applied Motion Products, Inc.
- 9.3 Bosch Rexroth Corporation
- 9.4 Beckhoff Automation
- 9.5 Danfoss
- 9.6 Eaton
- 9.7 Emerson Electric Co.
- 9.8 Franklin Electric Co., Inc.
- 9.9 Fuji Electric Corp. of America
- 9.10 GE Vernova
- 9.11 Hitachi Industrial Equipment & Solutions America, LLC
- 9.12 Honeywell International, Inc.
- 9.13 Johnson Controls
- 9.14 Mitsubishi Electric Corporation
- 9.15 Nidec Motor Corporation
- 9.16 Rockwell Automation
- 9.17 Schneider Electric
- 9.18 Siemens
- 9.19 WEG
- 9.20 Yaskawa America, Inc.

