
PUBLISHER: Global Market Insights Inc. | PRODUCT CODE: 1773215

PUBLISHER: Global Market Insights Inc. | PRODUCT CODE: 1773215
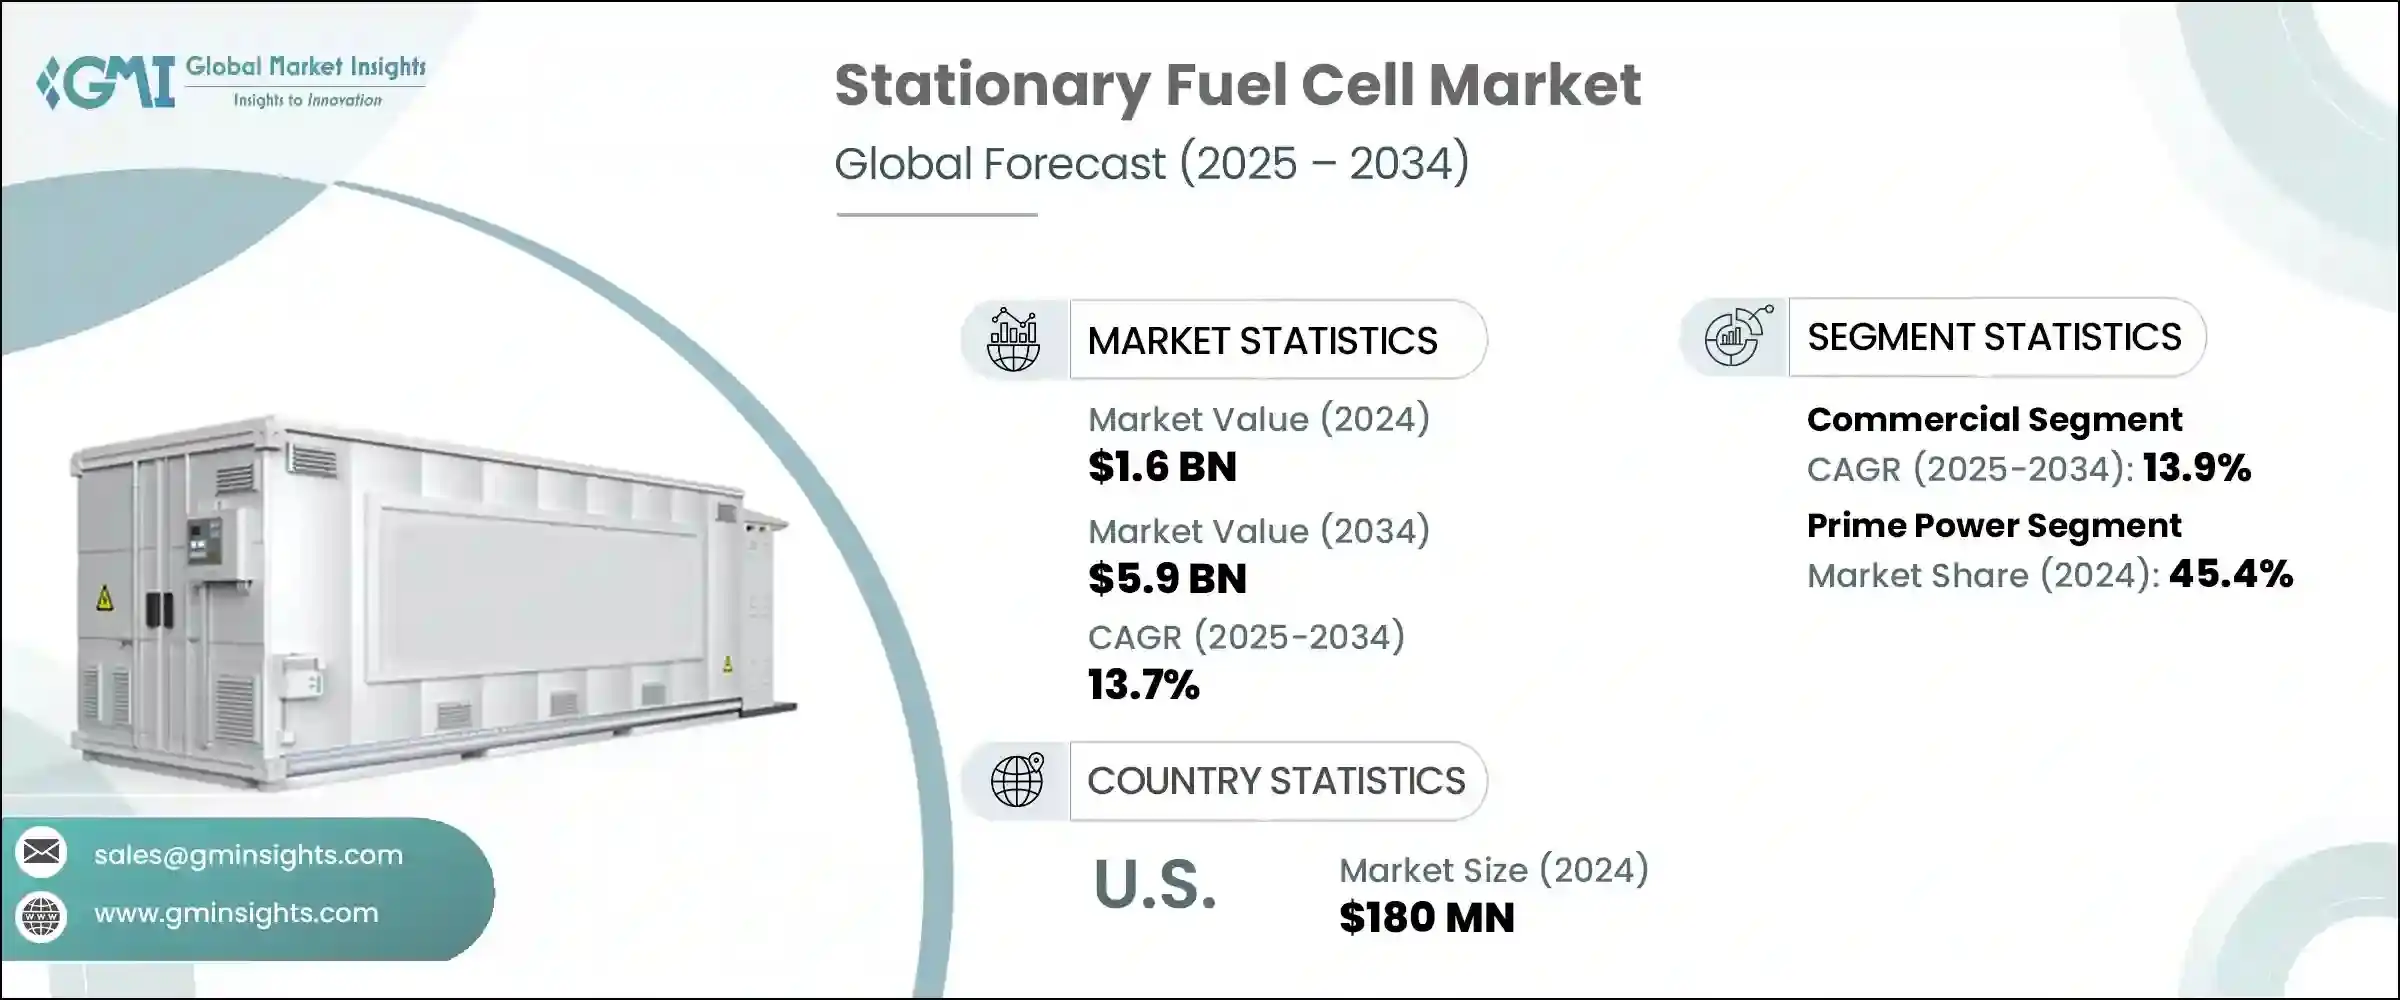
Stationary Fuel Cell Market Opportunity, Growth Drivers, Industry Trend Analysis, and Forecast 2025 - 2034
The Global Stationary Fuel Cell Market was valued at USD 1.6 billion in 2024 and is estimated to grow at a CAGR of 13.7% to reach USD 5.9 billion by 2034. These fuel cells provide a stable and dependable electricity source, making them ideal for permanent installations. They can run on various fuels, such as hydrogen, biogas, or natural gas, depending on the type of fuel cell technology. The rising demand for both small and large-capacity fuel cell systems, along with investments in hydrogen infrastructure by both public and private sectors, will likely boost market growth.
As businesses seek reliable and clean energy solutions, fuel cells are increasingly used to provide power in critical areas, reducing grid dependence and enhancing energy security. These systems offer uninterrupted power supply with minimal emissions, making them ideal for industries where downtime can lead to significant operational losses. Their scalability and flexibility also allow integration across a wide range of applications-from data centers and hospitals to remote facilities and backup power in manufacturing. Moreover, as sustainability goals tighten and carbon reduction targets become more stringent, the shift toward fuel cell technology aligns with broader environmental and regulatory mandates. This transition is driving investment and innovation across both public and private sectors, further accelerating fuel cell adoption globally.
| Market Scope | |
|---|---|
| Start Year | 2024 |
| Forecast Year | 2025-2034 |
| Start Value | $1.6 Billion |
| Forecast Value | $5.9 Billion |
| CAGR | 13.7% |
The residential segment is estimated to reach over USD 2.2 billion by 2034, augmented by the growing need for smaller sizes and lower noise-level power sources in the residential environment. These features make stationary fuel cells highly efficient for suburban and urban residences in the form of reliable and compact energy solutions. Additionally, consumer awareness about energy independence, sustainability, and the benefits of clean energy will drive the industry expansion.
The CHP segment is estimated to be worth more than USD 0.9 billion by 2034, owing to the great thermal efficiency of fuel cell systems that generate power and heat together, maximizing the energy utilization and reducing losses. In February 2024, Scale Microgrids acquired a 9.6 MW CHP fuel cell project in Bridgeport, Connecticut, which includes a 1.6-mile thermal loop and will be fabricated and operated by HyAxiom. Moreover, growing demand for industrial process heat will influence product deployment.
Asia Pacific stationary fuel cell market is projected to hit USD 4.8 billion by 2034. Rapid urbanization in countries including China and India is expected to stimulate fuel cell adoption. Additionally, Asia Pacific's major manufacturing hubs will foster substantial market growth as industries increasingly seek cost-effective, efficient, and sustainable energy solutions to meet their high-power requirements, further accelerating stationary fuel cell deployment in the region.
Eminent players operating in the stationary fuel cell industry are Altergy, AFC Energy, Bloom Energy, Ballard Power Systems, Cummins, Doosan Fuel Cell, Fuji Electric, Fuel Cell Energy, GenCell, poscoenergy, Plug Power, Nuvera Fuel Cells, Siemens Energy, SFC Energy, and Toshiba Corporation.
Table of Contents
Chapter 1 Methodology & Scope
- 1.1 Research design
- 1.2 Base estimates & calculations
- 1.3 Forecast calculation
- 1.4 Primary research & validation
- 1.4.1 Primary sources
- 1.4.2 Data mining sources
- 1.5 Market definitions
Chapter 2 Executive Summary
- 2.1 Industry synopsis, 2021 - 2034
Chapter 3 Industry Insights
- 3.1 Industry ecosystem
- 3.2 Regulatory landscape
- 3.3 Industry impact forces
- 3.3.1 Growth drivers
- 3.3.2 Industry pitfalls & challenges
- 3.4 Growth potential analysis
- 3.5 Porter's analysis
- 3.5.1 Bargaining power of suppliers
- 3.5.2 Bargaining power of buyers
- 3.5.3 Threat of new entrants
- 3.5.4 Threat of substitutes
- 3.6 PESTEL analysis
Chapter 4 Competitive landscape, 2025
- 4.1 Introduction
- 4.2 Company market share, 2024
- 4.3 Strategic dashboard
- 4.4 Strategic initiative
- 4.5 Competitive benchmarking
- 4.6 Innovation & technology landscape
Chapter 5 Market Size and Forecast, By Capacity, 2021 - 2034 (USD Million & MW)
- 5.1 Key trends
- 5.2 < 3 kW
- 5.3 3 - 10 kW
- 5.4 >10 - 50 kW
- 5.5 >50 kW
Chapter 6 Market Size and Forecast, By Application, 2021 - 2034 (USD Million & MW)
- 6.1 Key trends
- 6.2 Prime power
- 6.3 CHP
- 6.4 Others
Chapter 7 Market Size and Forecast, By End Use, 2021 - 2034 (USD Million & MW)
- 7.1 Key trends
- 7.2 Residential
- 7.3 Commercial
- 7.4 Industry/utility
Chapter 8 Market Size and Forecast, By Region, 2021 - 2034 (USD Million & MW)
- 8.1 Key trends
- 8.2 North America
- 8.2.1 U.S.
- 8.2.2 Canada
- 8.3 Europe
- 8.3.1 Germany
- 8.3.2 UK
- 8.3.3 France
- 8.3.4 Italy
- 8.3.5 Spain
- 8.3.6 Austria
- 8.4 Asia Pacific
- 8.4.1 Japan
- 8.4.2 South Korea
- 8.4.3 China
- 8.4.4 India
- 8.4.5 Philippines
- 8.4.6 Vietnam
- 8.5 Middle East & Africa
- 8.5.1 South Africa
- 8.5.2 Saudi Arabia
- 8.5.3 UAE
- 8.6 Latin America
- 8.6.1 Brazil
- 8.6.2 Peru
- 8.6.3 Mexico
Chapter 9 Company Profiles
- 9.1 Altergy
- 9.2 AFC Energy
- 9.3 Bloom Energy
- 9.4 Ballard Power Systems
- 9.5 Cummins
- 9.6 Doosan Fuel Cell
- 9.7 Fuji Electric
- 9.8 Fuel Cell Energy
- 9.9 GenCell
- 9.10 poscoenergy
- 9.11 Plug Power
- 9.12 Nuvera Fuel Cells
- 9.13 Siemens Energy
- 9.14 SFC Energy
- 9.15 Toshiba Corporation

