
PUBLISHER: Global Market Insights Inc. | PRODUCT CODE: 1716464

PUBLISHER: Global Market Insights Inc. | PRODUCT CODE: 1716464
Gas Insulated Switchgear Market Opportunity, Growth Drivers, Industry Trend Analysis, and Forecast 2025 - 2034
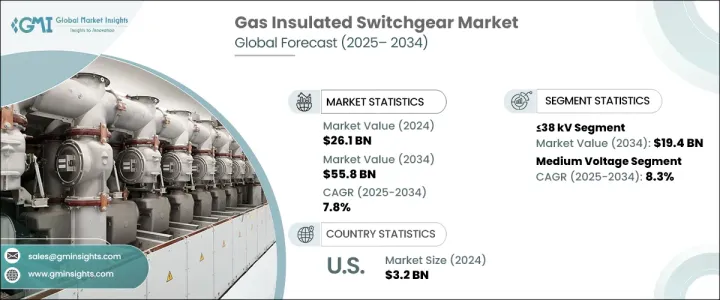
The Global Gas Insulated Switchgear Market reached USD 26.1 billion in 2024 and is projected to grow at a CAGR of 7.8% between 2025 and 2034. The rising global demand for electricity, rapid urbanization, and the continuous expansion of power transmission and distribution networks are fueling market growth. As countries move toward upgrading their power infrastructure, GIS technology is increasingly being adopted across industrial, commercial, and utility sectors. Its superior performance in terms of space efficiency, reliability, and low maintenance costs gives it an edge over traditional air-insulated switchgear (AIS). GIS is becoming essential for managing power systems in dense urban environments, large-scale industrial setups, and regions with extreme weather conditions, as it offers high durability and uninterrupted performance.
The market is witnessing increased investments from both government and private players to modernize power grids and ensure energy efficiency. As the energy transition gains momentum, integrating renewable sources into existing grids is becoming a priority. GIS plays a pivotal role in facilitating this shift, providing compact and high-performance solutions that align with sustainability goals. Additionally, advancements in insulation technologies and digital monitoring capabilities are enhancing GIS efficiency, making it a preferred choice for next-generation power infrastructure. The demand for smart grid solutions and intelligent power distribution systems is further accelerating GIS deployment, particularly in regions focusing on reducing transmission losses and improving grid stability. With rising concerns over environmental sustainability, many market players are also exploring eco-friendly gas alternatives to minimize the carbon footprint of GIS systems.
| Market Scope | |
|---|---|
| Start Year | 2024 |
| Forecast Year | 2025-2034 |
| Start Value | $26.1 Billion |
| Forecast Value | $55.8 Billion |
| CAGR | 7.8% |
The high-voltage segment remains the dominant force in the market, with GIS systems rated above 150 kV holding a substantial share. These high-capacity switchgear solutions are widely deployed in power plants, heavy manufacturing industries, and large-scale utility projects to ensure stable and efficient electricity distribution. Their compact designs and ability to function reliably in high-risk environments make them ideal for applications where space is limited and operational efficiency is paramount. Industries such as oil and gas, mining, and transportation are increasingly integrating GIS technology to meet stringent safety and performance requirements while optimizing power management systems.
The medium-voltage GIS segment is projected to experience significant growth, with an expected CAGR of 8.3% through 2034. The rapid expansion of urban infrastructure, alongside the rise of smart cities, is driving the demand for efficient and reliable power distribution solutions. Modernization initiatives in commercial and residential sectors, coupled with the growing focus on renewable energy integration, are fueling the adoption of medium-voltage GIS. Industries prioritizing sustainability and automation are shifting toward GIS technology to enhance operational efficiency and minimize power outages.
North America Gas Insulated Switchgear Market generated USD 3.2 billion in 2024, with the United States leading investments in power transmission upgrades. As the country modernizes its aging grid infrastructure to meet increasing electricity demand, GIS is playing a crucial role in supporting next-generation power distribution systems. The growing emphasis on smart grids and advanced power management solutions is further strengthening GIS adoption. With investments in renewable energy and digitalized grid networks on the rise, GIS is set to become a cornerstone of North America's power sector transformation.
Table of Contents
Chapter 1 Methodology & Scope
- 1.1 Market definitions
- 1.2 Base estimates & calculations
- 1.3 Forecast calculation
- 1.4 Data sources
- 1.4.1 Primary
- 1.4.2 Secondary
- 1.4.2.1 Paid
- 1.4.2.2 Public
Chapter 2 Executive Summary
- 2.1 Industry synopsis, 2021 - 2034
Chapter 3 Industry Insights
- 3.1 Industry ecosystem analysis
- 3.2 Regulatory landscape
- 3.3 Industry impact forces
- 3.3.1 Growth drivers
- 3.3.2 Industry pitfalls & challenges
- 3.4 Growth potential analysis
- 3.5 Porter's analysis
- 3.5.1 Bargaining power of suppliers
- 3.5.2 Bargaining power of buyers
- 3.5.3 Threat of new entrants
- 3.5.4 Threat of substitutes
- 3.6 PESTEL analysis
Chapter 4 Competitive landscape, 2024
- 4.1 Strategic dashboard
- 4.2 Innovation & sustainability landscape
Chapter 5 Market Size and Forecast, By Capacity, 2021 – 2034 (USD Million, ‘000 Units)
- 5.1 Key trends
- 5.2 ≤ 38 kV
- 5.3 > 38 kV to ≤ 72 kV
- 5.4 > 72 kV to ≤ 150 kV
- 5.5 > 150 kV
Chapter 6 Market Size and Forecast, By Voltage Level 2021 – 2034 (USD Million, ‘000 Units)
- 6.1 Key trends
- 6.2 Medium voltage
- 6.2.1 Primary distribution
- 6.2.2 Secondary distribution
- 6.3 High voltage
Chapter 7 Market Size and Forecast, By Application 2021 – 2034 (USD Million, ‘000 Units)
- 7.1 Key trends
- 7.2 Transmission & distribution
- 7.3 Manufacturing & processing
- 7.4 Infrastructure & transportation
- 7.5 Power generation
- 7.6 Others
Chapter 8 Market Size and Forecast, By Region, 2021 – 2034 (USD Million, ‘000 Units)
- 8.1 Key trends
- 8.2 North America
- 8.2.1 U.S.
- 8.2.2 Canada
- 8.2.3 Mexico
- 8.3 Europe
- 8.3.1 UK
- 8.3.2 France
- 8.3.3 Germany
- 8.3.4 Italy
- 8.3.5 Russia
- 8.3.6 Spain
- 8.4 Asia Pacific
- 8.4.1 China
- 8.4.2 Australia
- 8.4.3 India
- 8.4.4 Japan
- 8.4.5 South Korea
- 8.5 Middle East & Africa
- 8.5.1 Saudi Arabia
- 8.5.2 UAE
- 8.5.3 Turkey
- 8.5.4 South Africa
- 8.5.5 Egypt
- 8.6 Latin America
- 8.6.1 Brazil
- 8.6.2 Argentina
Chapter 9 Company Profiles
- 9.1 ABB
- 9.2 Bharat Heavy Electricals
- 9.3 CHINT Group
- 9.4 CG Power and Industrial Solutions
- 9.5 Eaton
- 9.6 Fuji Electric
- 9.7 General Electric
- 9.8 HD Hyundai Electric
- 9.9 Hitachi
- 9.10 Hyosung Heavy Industries
- 9.11 Lucy Group
- 9.12 Mitsubishi Electric
- 9.13 Ormazabal
- 9.14 Schneider Electric
- 9.15 Siemens
- 9.16 Skema
- 9.17 Toshiba

