
PUBLISHER: Global Market Insights Inc. | PRODUCT CODE: 1892759

PUBLISHER: Global Market Insights Inc. | PRODUCT CODE: 1892759
Pet Tech Market Opportunity, Growth Drivers, Industry Trend Analysis, and Forecast 2026 - 2035
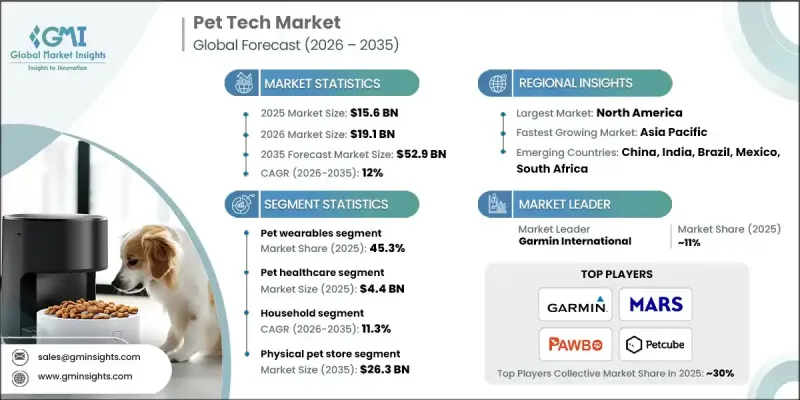
The Global Pet Tech Market was valued at USD 15.6 billion in 2025 and is estimated to grow at a CAGR of 12% to reach USD 52.9 billion by 2035.
The market growth is fueled by the rapid rise in pet ownership worldwide, increasing disposable incomes, higher spending on pet care, and the availability of innovative, technology-driven solutions for pets. Pet tech focuses on smart devices and digital platforms designed to monitor pets' health, ensure their safety, and provide engagement and convenience for owners. These solutions enable real-time monitoring, enhance overall pet wellness, and simplify care routines. Key players such as Petcube, Mars, Inc., Garmin International, and Pawbo are driving growth by launching smart collars, feeders, cameras, and health-monitoring devices that provide accurate, actionable insights on pets' wellbeing. Adoption of IoT-enabled and AI-integrated devices allows owners to remotely track behavior, activity, and health metrics, improving care quality while reducing manual monitoring efforts.
| Market Scope | |
|---|---|
| Start Year | 2025 |
| Forecast Year | 2026-2035 |
| Start Value | $15.6 Billion |
| Forecast Value | $52.9 Billion |
| CAGR | 12% |
The pet wearables segment held a 45.3% share in 2025. These devices, including smart collars, harnesses, and vests, enable owners to track heart rate, body temperature, activity levels, and location in real time. Integration with AI and IoT technologies enhances data collection and remote monitoring, allowing for improved preventive care and timely interventions.
The pet healthcare segment reached USD 4.4 billion in 2025. Growing awareness about pet wellness and the perception of pets as family members are driving demand for health-focused tech solutions. Smart collars, fitness trackers, and companion apps help owners monitor pets' health parameters and manage wellness routines effectively.
North America Pet Tech Market generated USD 8.6 billion in 2025 and is projected to reach USD 29.7 billion by 2035, at a CAGR of 12.2%. High pet ownership rates, advanced technological adoption, and growing expenditure on pet care contribute to strong market growth. The presence of established players and the widespread availability of innovative devices further support regional expansion.
Key players operating in the Global Pet Tech Market include Furbo, Actijoy, CleverPet, Dogtra, Felcana, Fitbark, Garmin International, Halo Collar, Link My Pet, Loc8tor, Mars, Inc., Pawbo, Pawscout, Petcube, Pet Huhou, PETKIT, PetPace, Qpets, Tianjin Smart Pets Technology, and Tractive. Companies in the Pet Tech Market are strengthening their presence through continuous innovation, launching new wearable devices, health trackers, and AI-integrated solutions that enhance pet monitoring capabilities. Strategic partnerships with veterinarians, pet retailers, and technology firms expand distribution channels and customer outreach. Firms are also focusing on user-friendly mobile apps and cloud-based platforms to improve real-time monitoring and data management. Expanding into emerging markets and offering customized solutions for different pet species helps capture a wider audience. Marketing campaigns emphasizing pet wellness, safety, and convenience further enhance brand recognition and consumer trust, supporting long-term market growth and competitive positioning.
Table of Contents
Chapter 1 Methodology and Scope
- 1.1 Market scope and definition
- 1.2 Research design
- 1.2.1 Research approach
- 1.2.2 Data collection methods
- 1.3 Data mining sources
- 1.3.1 Global
- 1.3.2 Regional/Country
- 1.4 Base estimates and calculations
- 1.4.1 Base year calculation
- 1.4.2 Key trends for market estimation
- 1.5 Primary research and validation
- 1.5.1 Primary sources
- 1.6 Forecast model
- 1.7 Research assumptions and limitations
Chapter 2 Executive Summary
- 2.1 Industry 360° synopsis
- 2.2 Key market trends
- 2.2.1 Regional trends
- 2.2.2 Product trends
- 2.2.3 Application trends
- 2.2.4 End use trends
- 2.2.5 Distribution channel trends
- 2.3 CXO perspectives: Strategic imperatives
- 2.3.1 Key decision points for industry executives
- 2.3.2 Critical success factors for market players
- 2.4 Future outlook and strategic recommendations
Chapter 3 Industry Insights
- 3.1 Industry ecosystem analysis
- 3.2 Industry impact forces
- 3.2.1 Growth drivers
- 3.2.1.1 Increased pet ownership and humanization
- 3.2.1.2 Growing awareness of pet health and wellness
- 3.2.1.3 Convenience and technological advancements like IoT, AI and data analytics for pet care
- 3.2.1.4 Governments supporting tech advancements through funding and regulations
- 3.2.2 Industry pitfalls and challenges
- 3.2.2.1 Device reliability and malfunctioning
- 3.2.2.2 High upfront cost
- 3.2.3 Market opportunities
- 3.2.3.1 AI-driven pet behavior and training solutions
- 3.2.3.2 Tele-veterinary and remote diagnostics platforms
- 3.2.1 Growth drivers
- 3.3 Growth potential analysis
- 3.4 Regulatory landscape
- 3.4.1 North America
- 3.4.1.1 U.S.
- 3.4.1.2 Canada
- 3.4.2 Europe
- 3.4.3 Asia Pacific
- 3.4.1 North America
- 3.5 Technology and innovation landscape
- 3.5.1 Current technologies
- 3.5.2 Emerging technologies
- 3.6 Porter's analysis
- 3.7 PESTEL analysis
Chapter 4 Competitive Landscape, 2023
- 4.1 Introduction
- 4.2 Company market share analysis
- 4.3 Company matrix analysis
- 4.4 Competitive analysis of major market players
- 4.5 Competitive positioning matrix
- 4.6 Key developments
- 4.6.1 Merger and acquisition
- 4.6.2 Partnership and collaboration
- 4.6.3 New product launches
- 4.6.4 Expansion plans
Chapter 5 Market Estimates and Forecast, By Product, 2022 - 2035 ($ Mn and Units)
- 5.1 Key trends
- 5.2 Pet wearables
- 5.2.1 Smart collar
- 5.2.2 Smart vest
- 5.2.3 Smart harness
- 5.2.4 Smart camera
- 5.3 Smart pet crates and beds
- 5.4 Smart pet doors
- 5.5 Smart pet feeders and bowls
- 5.6 Smart pet fence
- 5.7 Smart pet water dispenser
- 5.8 Smart pet toys
Chapter 6 Market Estimates and Forecast, By Application, 2022 - 2035 ($ Mn)
- 6.1 Key trends
- 6.2 Pet healthcare
- 6.3 Pet owner convenience
- 6.4 Communication and entertainment
- 6.5 Pet safety
Chapter 7 Market Estimates and Forecast, By End Use, 2022 - 2035 ($ Mn)
- 7.1 Key trends
- 7.2 Household
- 7.3 Commercial
Chapter 8 Market Estimates and Forecast, By Distribution Channel, 2022 - 2035 ($ Mn)
- 8.1 Key trends
- 8.2 Physical pet store
- 8.3 Online-only retailer
- 8.4 Physical mass merchant store
Chapter 9 Market Estimates and Forecast, By Region, 2022 - 2035 ($ Mn and Units)
- 9.1 Key trends
- 9.2 North America
- 9.2.1 U.S.
- 9.2.2 Canada
- 9.3 Europe
- 9.3.1 Germany
- 9.3.2 UK
- 9.3.3 France
- 9.3.4 Spain
- 9.3.5 Italy
- 9.4 Asia Pacific
- 9.4.1 China
- 9.4.2 Japan
- 9.4.3 India
- 9.4.4 Australia
- 9.4.5 South Korea
- 9.5 Latin America
- 9.5.1 Brazil
- 9.5.2 Mexico
- 9.5.3 Argentina
- 9.6 Middle East and Africa
- 9.6.1 South Africa
- 9.6.2 Saudi Arabia
- 9.6.3 UAE
Chapter 10 Company Profiles
- 10.1 Actijoy
- 10.2 CleverPet
- 10.3 Dogtra
- 10.4 Felcana
- 10.5 Fitbark
- 10.6 Furbo
- 10.7 Garmin International
- 10.8 Halo Collar
- 10.9 Link My Pet
- 10.10 Loc8tor
- 10.11 Mars Incorporated
- 10.12 Pawbo
- 10.13 Pawscout
- 10.14 Petcube
- 10.15 Pet Huhou
- 10.16 PETKIT
- 10.17 PetPace
- 10.18 Qpets
- 10.19 Tianjin Smart Pets Technology
- 10.20 Tractive

