
PUBLISHER: Global Market Insights Inc. | PRODUCT CODE: 1666895

PUBLISHER: Global Market Insights Inc. | PRODUCT CODE: 1666895
Cooling Meters Market Opportunity, Growth Drivers, Industry Trend Analysis, and Forecast 2025 - 2034
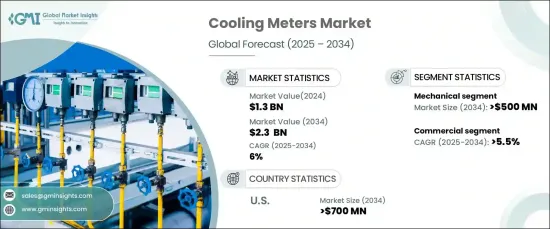
The Global Cooling Meters Market was valued at USD 1.3 billion in 2024 and is projected to grow at a steady CAGR of 6% from 2025 to 2034. Cooling meters, crucial devices used to measure cooling energy consumption or cooling rates in systems like air conditioning, refrigeration, and district cooling networks, play a vital role in monitoring parameters such as temperature, flow rate, and energy usage.
These devices help optimize cooling efficiency and energy management, making them increasingly indispensable in energy-conscious industries and buildings. As the demand for energy-efficient systems grows, driven by rising energy costs and environmental concerns, cooling meters are becoming an essential part of sustainability efforts. Additionally, ongoing innovations in technology continue to enhance the functionality and appeal of these devices, further driving their adoption across various sectors. Increasing awareness about climate change, along with more stringent regulations aimed at reducing energy consumption, also contributes to the market's expansion.
| Market Scope | |
|---|---|
| Start Year | 2024 |
| Forecast Year | 2025-2034 |
| Start Value | $1.3 Billion |
| Forecast Value | $2.3 Billion |
| CAGR | 6% |
The market is divided into mechanical and static cooling meters based on technology. The mechanical segment is expected to generate USD 500 million by 2034. This growth can be attributed to the efficient, cost-effective, and reliable design of mechanical cooling meters, which directly measure the flow of chilled water and temperature differences. These meters are particularly popular in settings where advanced smart technologies are not necessary. They are widely adopted in residential and commercial buildings that aim for green certifications, such as LEED, which further strengthens their market demand.
When considering applications, the cooling meters market is segmented into residential, commercial, and industrial sectors. The commercial sector is projected to grow at a CAGR of 5.5% through 2034. As businesses and commercial spaces look for ways to improve energy efficiency and reduce operational costs, the demand for cooling meters in offices, malls, and hotels continues to rise. Cooling meters are increasingly used in these spaces to help optimize energy usage, especially as companies look for sustainable solutions to mitigate the environmental impact of energy-intensive cooling systems.
In the U.S., the cooling meters market is expected to generate USD 700 million by 2034. This growth is supported by government incentives and initiatives promoting sustainable building practices, such as the adoption of advanced building codes aimed at addressing climate change. The increasing awareness among businesses and consumers about energy optimization and the potential for cost savings is also driving market expansion. With these market trends and developments, cooling meters are poised to continue playing a crucial role in optimizing cooling energy consumption in the years ahead.
Table of Contents
Chapter 1 Methodology & Scope
- 1.1 Research design
- 1.2 Base estimates & calculations
- 1.3 Forecast model
- 1.4 Primary research & validation
- 1.4.1 Primary sources
- 1.4.2 Data mining sources
- 1.5 Market definitions
Chapter 2 Executive Summary
- 2.1 Industry synopsis, 2021 – 2034
Chapter 3 Industry Insights
- 3.1 Industry ecosystem
- 3.2 Regulatory landscape
- 3.3 Industry impact forces
- 3.3.1 Growth drivers
- 3.3.2 Industry pitfalls & challenges
- 3.4 Growth potential analysis
- 3.5 Porter's analysis
- 3.5.1 Bargaining power of suppliers
- 3.5.2 Bargaining power of buyers
- 3.5.3 Threat of new entrants
- 3.5.4 Threat of substitutes
- 3.6 PESTEL analysis
Chapter 4 Competitive landscape, 2024
- 4.1 Introduction
- 4.2 Strategic dashboard
- 4.3 Innovation & technology landscape
Chapter 5 Market Size and Forecast, By Product, 2021 – 2034 (USD Million & ‘000 Units)
- 5.1 Key trends
- 5.2 Ultrasonic
- 5.3 Vortex
- 5.4 Others
Chapter 6 Market Size and Forecast, By Technology, 2021 – 2034 (USD Million & ‘000 Units)
- 6.1 Key trends
- 6.2 Mechanical
- 6.3 Static
Chapter 7 Market Size and Forecast, By Application, 2021 – 2034 (USD Million & ‘000 Units)
- 7.1 Key trends
- 7.2 Residential
- 7.3 Commercial
- 7.3.1 College/University
- 7.3.2 Office building
- 7.3.3 Government building
- 7.3.4 Others
- 7.4 Industrial
Chapter 8 Market Size and Forecast, By Region, 2021 – 2034 (USD Million & ‘000 Units)
- 8.1 Key trends
- 8.2 North America
- 8.2.1 U.S.
- 8.2.2 Canada
- 8.3 Europe
- 8.3.1 Germany
- 8.3.2 Poland
- 8.3.3 Sweden
- 8.3.4 Italy
- 8.3.5 France
- 8.4 Asia Pacific
- 8.4.1 China
- 8.4.2 Japan
- 8.4.3 South Korea
- 8.4.4 Singapore
- 8.4.5 India
- 8.5 Middle East
- 8.5.1 Saudi Arabia
- 8.5.2 UAE
- 8.5.3 Qatar
- 8.5.4 Oman
- 8.5.5 Kuwait
Chapter 9 Company Profiles
- 9.1 Axioma Metering
- 9.2 Danfoss
- 9.3 Diehl Stiftung & Co. KG
- 9.4 Honeywell International Inc.
- 9.5 Integra
- 9.6 Itron Inc.
- 9.7 ista Energy Solutions Limited
- 9.8 Kamstrup
- 9.9 Landis+Gyr
- 9.10 RB Flowmeter
- 9.11 Schneider Electric
- 9.12 Secure Meters Ltd.
- 9.13 Siemens
- 9.14 Smartdhome Srl
- 9.15 Sontex SA
- 9.16 Xylem
- 9.17 ZENNER International GmbH & Co. KG

