
PUBLISHER: Global Market Insights Inc. | PRODUCT CODE: 1858982

PUBLISHER: Global Market Insights Inc. | PRODUCT CODE: 1858982
Digital Therapeutics Market Opportunity, Growth Drivers, Industry Trend Analysis, and Forecast 2024 - 2032
The Global Digital Therapeutics Market was valued at USD 7.7 billion in 2024 and is estimated to grow at a CAGR of 25.7% to reach USD 75.4 billion by 2034.
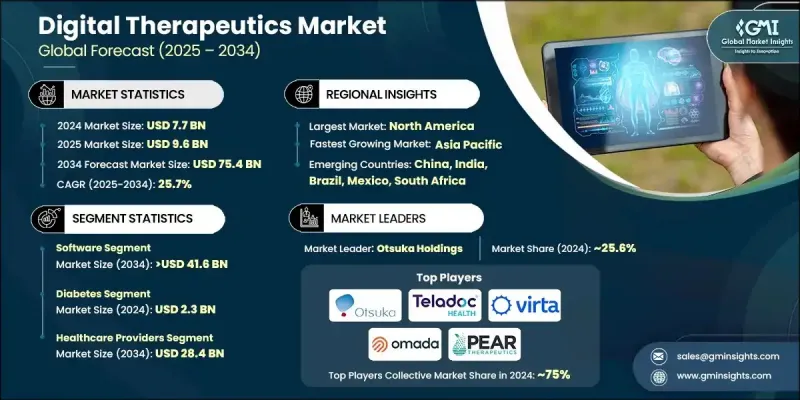
The growth is fueled by the rising global prevalence of chronic illnesses such as cardiovascular diseases, diabetes, and mental health conditions. These ongoing healthcare challenges are driving demand for digital therapeutics, which deliver cost-efficient, scalable, and personalized treatment alternatives. These software-driven medical interventions are increasingly integrated with artificial intelligence, wearables, gamification, and behavioral health tools that improve adherence, patient outcomes, and engagement. Designed to work either independently or in conjunction with traditional treatments, these tools are becoming a cornerstone of modern healthcare. As providers and patients increasingly seek flexible and non-invasive solutions, the appeal of digital therapeutics continues to grow. Their ability to deliver clinically proven outcomes while reducing overall care costs makes them particularly attractive to employers, insurers, and public health systems. Growing support from payers and expanded regulatory acceptance across major markets are further accelerating development and deployment across therapeutic areas, from metabolic conditions to mental wellness.
| Market Scope | |
|---|---|
| Start Year | 2024 |
| Forecast Year | 2025-2034 |
| Start Value | $7.7 Billion |
| Forecast Value | $75.4 Billion |
| CAGR | 25.7% |
The software segment held a 54.3% share in 2024 and is anticipated to reach USD 41.6 billion by 2034, growing at a CAGR of 25.9%. This segment includes both on-premise and cloud-based platforms that enable tailored therapeutic interventions based on user data, behavioral trends, and AI-driven algorithms. These solutions not only promote habit formation and chronic disease management but are also widely adopted due to their scalability and accessibility across digital devices such as smartphones, computers, and tablets. The growing ease of access and ability to deliver continuous care remotely make software-based digital therapeutics a preferred model in preventive and ongoing treatment frameworks.
The diabetes segment generated USD 2.3 billion in 2024. Increasing rates of all forms of diabetes, Type 1, Type 2, and gestational, are contributing to rising demand for tools that enable real-time monitoring and sustainable lifestyle changes. Digital therapeutics provide tailored interventions, including behavioral coaching, glucose tracking, medication reminders, and analytics-based insights, positioning them as key components in long-term diabetes care plans. This segment continues to benefit from growing patient awareness and clinical recognition of DTx in metabolic health management.
North America Digital Therapeutics Market held 58.1% share in 2024. The region's strong healthcare infrastructure, rising prevalence of chronic conditions, and favorable regulatory landscape are boosting adoption. In the U.S. and Canada, employers are increasingly including DTx platforms in workplace wellness strategies to enhance employee health outcomes and reduce insurance expenditures. Additionally, widespread reimbursement availability and robust technology adoption are supporting the integration of DTx into mainstream clinical and wellness environments.
Key players in the Global Digital Therapeutics Market are Teladoc Health, Virta Health, LifeScan, Hyfe, Omada Health, Akili Interactive, Pear Therapeutics, Orexo, Otsuka Holdings, Click Therapeutics, Propeller Health (ResMed), and AmerisourceBergen. To strengthen their presence, digital therapeutics companies are focusing on strategic partnerships with payers, pharmaceutical firms, and healthcare systems to broaden reach and ensure reimbursement coverage. Many are expanding their global distribution networks to penetrate emerging markets while investing heavily in R&D to enhance platform functionality using AI, machine learning, and real-time patient monitoring. Regulatory approvals remain a priority, with companies working closely with agencies to gain faster clearances. Integration with electronic health records and telehealth platforms is another core focus, aimed at improving interoperability and patient engagement.
Table of Contents
Chapter 1 Methodology and Scope
- 1.1 Market scope and definition
- 1.2 Research design
- 1.2.1 Research approach
- 1.2.2 Data collection methods
- 1.3 Data mining sources
- 1.3.1 Global
- 1.3.2 Regional/Country
- 1.4 Base estimates and calculations
- 1.4.1 Base year calculation
- 1.4.2 Key trends for market estimation
- 1.5 Primary research and validation
- 1.5.1 Primary sources
- 1.6 Forecast model
- 1.7 Research assumptions and limitations
Chapter 2 Executive Summary
- 2.1 Industry 360° synopsis
- 2.2 Key market trends
- 2.2.1 Regional trends
- 2.2.2 Component trends
- 2.2.3 Application trends
- 2.2.4 End use trends
- 2.3 CXO perspectives: Strategic imperatives
- 2.3.1 Key decision points for industry executives
- 2.3.2 Critical success factors for market players
- 2.4 Future outlook and strategic recommendations
Chapter 3 Industry Insights
- 3.1 Industry ecosystem analysis
- 3.2 Industry impact forces
- 3.2.1 Growth drivers
- 3.2.1.1 Increasing prevalence of chronic disease
- 3.2.1.2 Rising demand for cost containment
- 3.2.1.3 Expansion of quality-of-care delivery
- 3.2.1.4 Growing popularity of digital therapeutics
- 3.2.2 Industry pitfalls and challenges
- 3.2.2.1 Data security and privacy concerns
- 3.2.2.2 Lack of skilled IT professionals
- 3.2.3 Market opportunities
- 3.2.3.1 Increasing shift toward preventive and value-based care
- 3.2.3.2 Expansion of combination therapy models
- 3.2.1 Growth drivers
- 3.3 Growth potential analysis
- 3.4 Regulatory landscape
- 3.4.1 North America
- 3.4.1.1 U.S.
- 3.4.1.2 Canada
- 3.4.2 Europe
- 3.4.3 Asia Pacific
- 3.4.4 Latin America
- 3.4.5 Middle East and Africa
- 3.4.1 North America
- 3.5 Technology landscape
- 3.5.1 Current technological trends
- 3.5.2 Emerging technologies
- 3.6 Future market trends
- 3.7 Porter's analysis
- 3.8 PESTEL analysis
Chapter 4 Competitive Landscape, 2024
- 4.1 Introduction
- 4.2 Company market share analysis
- 4.2.1 Global
- 4.2.2 North America
- 4.2.3 Europe
- 4.3 Company matrix analysis
- 4.4 Competitive analysis of major market players
- 4.5 Competitive positioning matrix
- 4.6 Key developments
- 4.6.1 Merger and acquisition
- 4.6.2 Partnership and collaboration
- 4.6.3 New product launches
- 4.6.4 Expansion plans
Chapter 5 Market Estimates and Forecast, By Component, 2021 - 2034 ($ Mn)
- 5.1 Key trends
- 5.2 Software
- 5.2.1 On-premises
- 5.2.2 Cloud-based
- 5.3 Hardware
- 5.3.1 Wearable devices
- 5.3.2 Sensors and monitoring devices
- 5.3.3 Other devices
- 5.4 Services
- 5.4.1 Consulting and integration
- 5.4.2 Training and education
- 5.4.3 Other services
Chapter 6 Market Estimates and Forecast, By Application, 2021 - 2034 ($ Mn)
- 6.1 Key trends
- 6.2 Diabetes
- 6.3 Obesity
- 6.4 Cardiovascular
- 6.5 Mental & behavior health
- 6.6 Hypertension
- 6.7 Insomnia
- 6.8 Other applications
Chapter 7 Market Estimates and Forecast, By End Use, 2021 - 2034 ($ Mn)
- 7.1 Key trends
- 7.2 Healthcare providers
- 7.2.1 Hospitals
- 7.2.2 Clinics
- 7.2.3 Telehealth platforms
- 7.3 Payers
- 7.4 Patients
- 7.5 Other End Use
Chapter 8 Market Estimates and Forecast, By Region, 2021 - 2034 ($ Mn)
- 8.1 Key trends
- 8.2 North America
- 8.2.1 U.S.
- 8.2.2 Canada
- 8.3 Europe
- 8.3.1 Germany
- 8.3.2 UK
- 8.3.3 France
- 8.3.4 Spain
- 8.3.5 Italy
- 8.3.6 Netherlands
- 8.4 Asia Pacific
- 8.4.1 China
- 8.4.2 India
- 8.4.3 Japan
- 8.4.4 Australia
- 8.4.5 South Korea
- 8.5 Latin America
- 8.5.1 Brazil
- 8.5.2 Mexico
- 8.5.3 Argentina
- 8.6 Middle East and Africa
- 8.6.1 South Africa
- 8.6.2 Saudi Arabia
- 8.6.3 UAE
Chapter 9 Company Profiles
- 9.1 AmerisourceBergen
- 9.2 Akili Interactive
- 9.3 Click Therapeutics
- 9.4 Hyfe
- 9.5 LifeScan
- 9.6 Omada Health
- 9.7 Orexo
- 9.8 Otsuka Holdings
- 9.9 Pear Therapeutics
- 9.10 Propeller Health (ResMed)
- 9.11 Teladoc Health
- 9.12 Virta Health

