
PUBLISHER: Global Market Insights Inc. | PRODUCT CODE: 1666531

PUBLISHER: Global Market Insights Inc. | PRODUCT CODE: 1666531
HVDC Converter Market Opportunity, Growth Drivers, Industry Trend Analysis, and Forecast 2025 - 2034
The Global HVDC Converter Market, valued at USD 3.3 billion in 2024, is poised for exceptional growth, with a CAGR of 35.9% from 2025 to 2034. The market expansion is driven by a growing need for more efficient power transmission systems, especially as the world transitions to renewable energy sources. HVDC technology stands out for its ability to transmit electricity over vast distances with minimal loss, making it an ideal solution for modernizing aging energy infrastructures worldwide. The increasing focus on renewable energy integration, such as wind and solar power, is placing pressure on the existing grids to adapt quickly. As such, HVDC converters, which offer a reliable means of overcoming transmission challenges, are seeing significant adoption. Investment in renewable energy projects, the push for cross-border electricity connections, and ongoing advancements in grid infrastructure are also key factors contributing to the market growth.
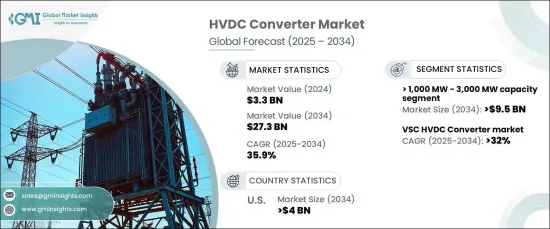
As more countries prioritize renewable energy integration, the need for high-capacity HVDC systems has never been more urgent. Systems with capacities ranging from 1,000 MW to 3,000 MW are expected to generate USD 9.5 billion by 2034. These systems are vital for large-scale renewable energy projects, such as offshore wind farms and solar power installations, ensuring efficient power transmission over long distances and addressing the energy demands of urban populations. They also play a crucial role in supporting cross-border electricity trade, connecting regions that rely on renewable energy generation.
| Market Scope | |
|---|---|
| Start Year | 2024 |
| Forecast Year | 2025-2034 |
| Start Value | $3.3 Billion |
| Forecast Value | $27.3 Billion |
| CAGR | 35.9% |
In particular, the voltage source converter (VSC) technology is anticipated to see a rapid increase in adoption, with a CAGR of 32% through 2034. VSCs are highly versatile and ideal for managing power flow in complex grids while enhancing renewable energy integration. Their ability to operate effectively in weak or isolated grids and support multi-terminal connections makes them an attractive option for both offshore and urban energy applications. Unlike traditional line-commutated converters (LCC), VSCs provide superior grid control and flexibility, positioning them as the technology of choice for modern power transmission systems.
The U.S. HVDC converter market is expected to generate USD 4 billion by 2034. This growth is driven by a combination of aging infrastructure, the push for cleaner energy, and an increased demand for long-distance HVDC transmission projects. The need to connect renewable energy production centers, such as wind and solar farms, with major urban areas underscores the growing relevance of HVDC systems. U.S. federal policies supporting clean energy and regulatory frameworks aimed at facilitating renewable energy integration are accelerating investments in HVDC technology. As a result, the U.S. is seeing an increasing preference for VSC-based HVDC systems, which offer the flexibility to seamlessly integrate diverse energy sources while meeting evolving grid demands.
Table of Contents
Chapter 1 Methodology & Scope
- 1.1 Market scope & definitions
- 1.2 Market estimates & forecast parameters
- 1.3 Forecast calculation
- 1.4 Data sources
- 1.4.1 Primary
- 1.4.2 Secondary
- 1.4.2.1 Paid
- 1.4.2.2 Public
Chapter 2 Executive Summary
- 2.1 Industry synopsis, 2021 - 2034
Chapter 3 Industry Insights
- 3.1 Industry ecosystem analysis
- 3.2 Regulatory landscape
- 3.3 Industry impact forces
- 3.3.1 Growth drivers
- 3.3.2 Industry pitfalls & challenges
- 3.4 Growth potential analysis
- 3.5 Porter's analysis
- 3.5.1 Bargaining power of suppliers
- 3.5.2 Bargaining power of buyers
- 3.5.3 Threat of new entrants
- 3.5.4 Threat of substitutes
- 3.6 PESTEL analysis
Chapter 4 Competitive Landscape, 2024
- 4.1 Introduction
- 4.2 Strategic outlook
- 4.3 Innovation & sustainability landscape
Chapter 5 Market Size and Forecast, By Capacity, 2021 – 2034 (MW, USD Billion)
- 5.1 Key trends
- 5.2 < 500 MW
- 5.3 ≥ 500 MW - 1,000 MW
- 5.4 > 1,000 MW - 3,000 MW
- 5.5 > 3,000 MW
Chapter 6 Market Size and Forecast, By Configuration, 2021 – 2034 (MW, USD Billion)
- 6.1 Key trends
- 6.2 Monopolar
- 6.3 Bipolar
- 6.4 Back to back
- 6.5 Others
Chapter 7 Market Size and Forecast, By Converter, 2021 – 2034 (MW, USD Billion)
- 7.1 Key trends
- 7.2 LCC
- 7.3 VSC
- 7.4 Others
Chapter 8 Market Size and Forecast, By Region, 2021 – 2034 (MW, USD Billion)
- 8.1 Key trends
- 8.2 North America
- 8.2.1 U.S.
- 8.2.2 Canada
- 8.3 Europe
- 8.3.1 UK
- 8.3.2 Germany
- 8.3.3 France
- 8.3.4 Norway
- 8.4 Asia Pacific
- 8.4.1 China
- 8.4.2 India
- 8.4.3 South Korea
- 8.4.4 Australia
- 8.5 Rest of World
Chapter 9 Company Profiles
- 9.1 ABB
- 9.2 Bharat Heavy Electricals
- 9.3 CG Power and Industrial Solutions
- 9.4 General Electric
- 9.5 Hitachi
- 9.6 Hyosung Heavy Industries
- 9.7 Power Grid Corporation of India
- 9.8 Rongxin Power
- 9.9 Siemens Energy
- 9.10 Toshiba

